Frequency Trees Demonstration This resource provides animated demonstrations


- Slides: 9
Frequency Trees – Demonstration This resource provides animated demonstrations of the mathematical method. Check animations and delete slides not needed for your class.
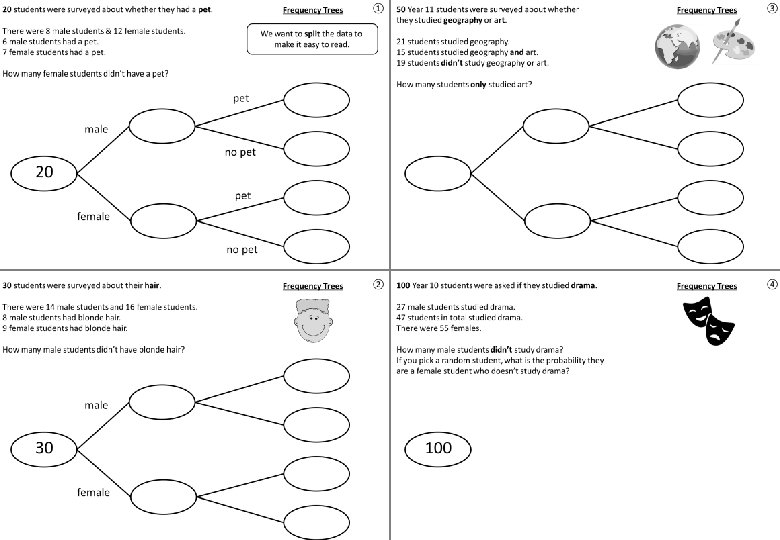
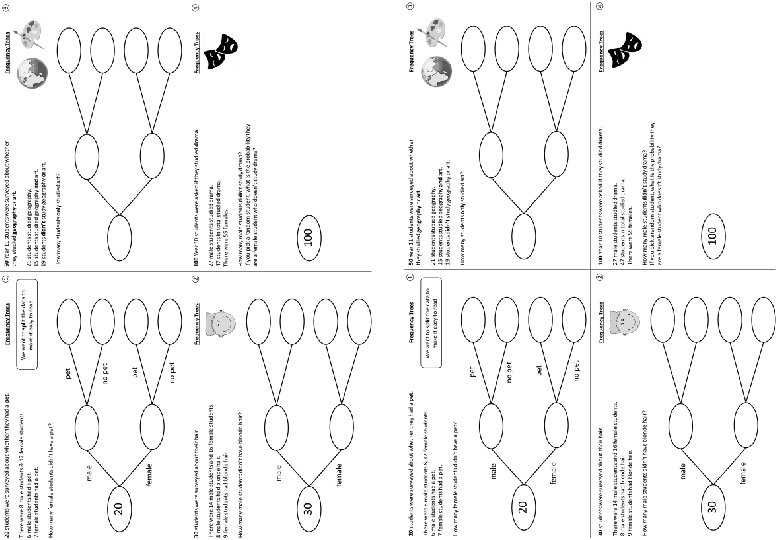
20 students were surveyed about whether they had a pet. How many females had no pet? How can we make this easier? Female with pet Male with pet Female & no pet Female with pet Male & no pet Female & no pet Male & no pet Female with pet Male with pet Female & no pet Male with pet Female with pet Female & no pet
20 students were surveyed about whether they had a pet. Frequency Trees There were 8 male students & 12 female students. 6 male students had a pet. 7 female students had a pet. We want to split the data to make it easy to read. How many female students didn’t have a pet? male pet 6 no pet 2 pet 7 no pet 5 8 20 female 12 ①
30 students were surveyed about their hair. Frequency Trees There were 14 male students and 16 female students. 8 male students had blonde hair. 9 female students had blonde hair. How many male students didn’t have blonde hair? male blonde 8 not blonde 6 blonde 9 not blonde 7 14 30 female 16 ②
50 Year 11 students were surveyed about whether they studied geography or art. Frequency Trees 21 students studied geography. 15 students studied geography and art. 19 students didn’t study geography or art. How many students only studied art? geography art 15 not art 6 art 10 not art 19 21 50 not geography 29 ③
100 Year 10 students were asked if they studied drama. Frequency Trees 27 male students studied drama. 47 students in total studied drama. There were 55 females. How many male students didn’t study drama? If you pick a random student, what is the probability they are a female student who doesn’t study drama? male drama 27 not drama 18 drama 20 not drama 35 45 100 female 55 ④
Questions? Comments? Suggestions? …or have you found a mistake!? Any feedback would be appreciated . Please feel free to email: tom@goteachmaths. co. uk