Frequency Tables Tally Charts Worksheet A The worksheet

Frequency Tables & Tally Charts – Worksheet A The worksheet is in a 2 sizes.

Printing To print handouts from slides Select the slide from the left. Then click: File > Print > ‘Print Current Slide’ To print multiple slides Click on a section title to highlight all those slides, or press ‘Ctrl’ at the same time as selecting slides to highlight more than one. Then click: File > Print > ‘Print Selection’ To print double-sided handouts Highlight both slides before using ‘Print Selection’. Choose ‘Print on Both Sides’ and ‘Flip on Short Edge’.
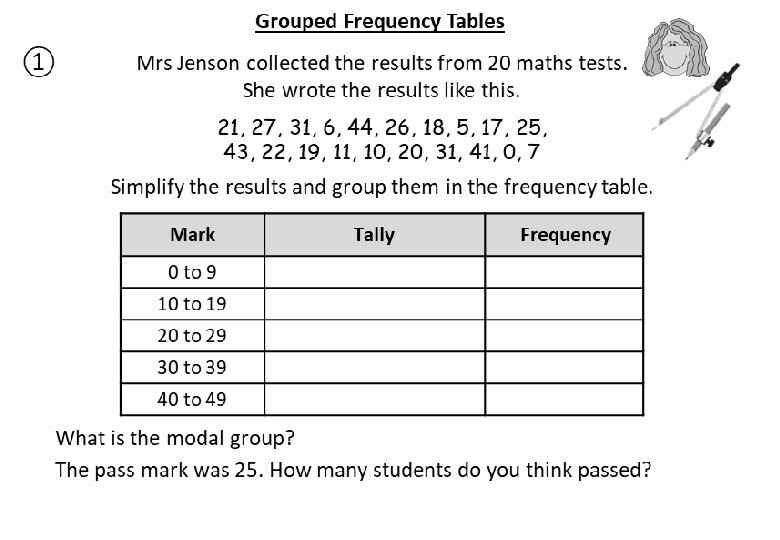
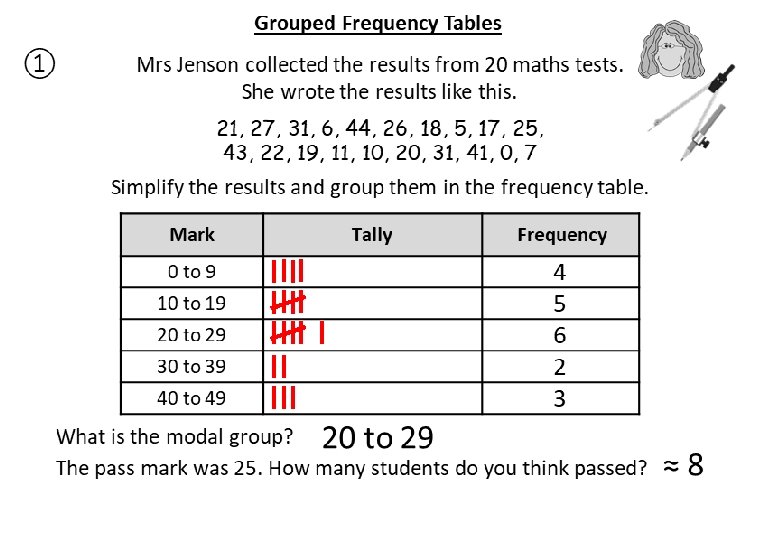

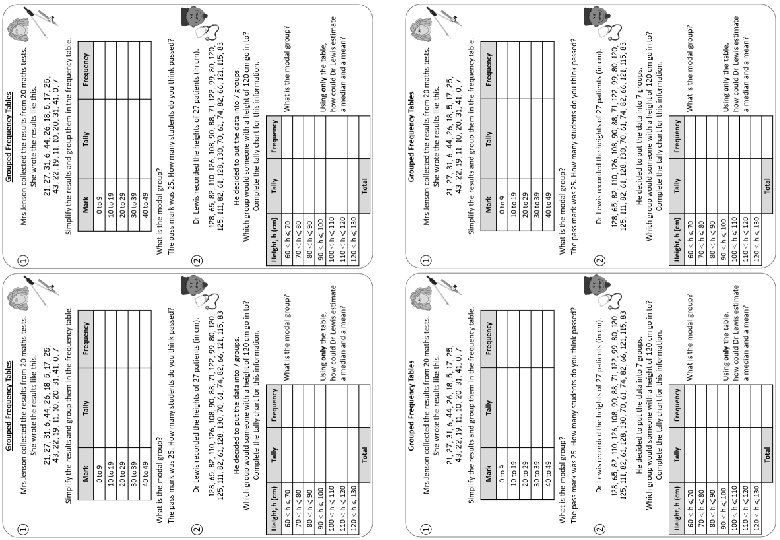
Grouped Frequency Tables ① Mrs Jenson collected the results from 20 maths tests. She wrote the results like this. 21, 27, 31, 6, 44, 26, 18, 5, 17, 25, 43, 22, 19, 11, 10, 20, 31, 41, 0, 7 Simplify the results and group them in the frequency table. Mark Tally Frequency 4 5 6 2 3 0 to 9 10 to 19 20 to 29 30 to 39 40 to 49 What is the modal group? 20 to 29 The pass mark was 25. How many students do you think passed? ② ≈8 Dr Lewis recorded the heights of 27 patients (in cm). 128, 65, 82, 110, 126, 108, 90, 88, 71, 122, 99, 80, 125, 111, 82, 61, 128, 130, 70, 61, 74, 82, 66, 121, 115, 83 He decided to put the data into 7 groups. Which group would someone with a height of 120 cm go in to? Complete the tally chart for this information. Height, h (cm) Tally Frequency 5 What is the modal group? 3 6 1 2 3 Using only the table, how could Dr Lewis estimate a median and a mean? Use midpoints. Answers

Grouped Frequency Tables ① Grouped Frequency Tables Mrs Jenson collected the results from 20 maths tests. She wrote the results like this. 21, 27, 31, 6, 44, 26, 18, 5, 17, 25, 43, 22, 19, 11, 10, 20, 31, 41, 0, 7 Simplify the results and group them in the frequency table. Mark Tally Frequency Mark Tally 0 to 9 10 to 19 20 to 29 30 to 39 40 to 49 What is the modal group? The pass mark was 25. How many students do you think passed? ② ① Dr Lewis recorded the heights of 27 patients (in cm). Frequency What is the modal group? The pass mark was 25. How many students do you think passed? ② Dr Lewis recorded the heights of 27 patients (in cm). 128, 65, 82, 110, 126, 108, 90, 88, 71, 122, 99, 80, 120, 125, 111, 82, 61, 128, 130, 70, 61, 74, 82, 66, 121, 115, 83 He decided to put the data into 7 groups. Which group would someone with a height of 120 cm go in to? Complete the tally chart for this information. Height, h (cm) Tally Frequency What is the modal group? Using only the table, how could Dr Lewis estimate a median and a mean?

Questions? Comments? Suggestions? …or have you found a mistake!? Any feedback would be appreciated . Please feel free to email: tom@goteachmaths. co. uk
- Slides: 8