Frequency Polygons Worksheet A The worksheet is in


- Slides: 8
Frequency Polygons – Worksheet A The worksheet is in 2 sizes.
Printing To print handouts from slides Select the slide from the left. Then click: File > Print > ‘Print Current Slide’ To print multiple slides Click on a section title to highlight all those slides, or press ‘Ctrl’ at the same time as selecting slides to highlight more than one. Then click: File > Print > ‘Print Selection’ To print double-sided handouts Highlight both slides before using ‘Print Selection’. Choose ‘Print on Both Sides’ and ‘Flip on Short Edge’.
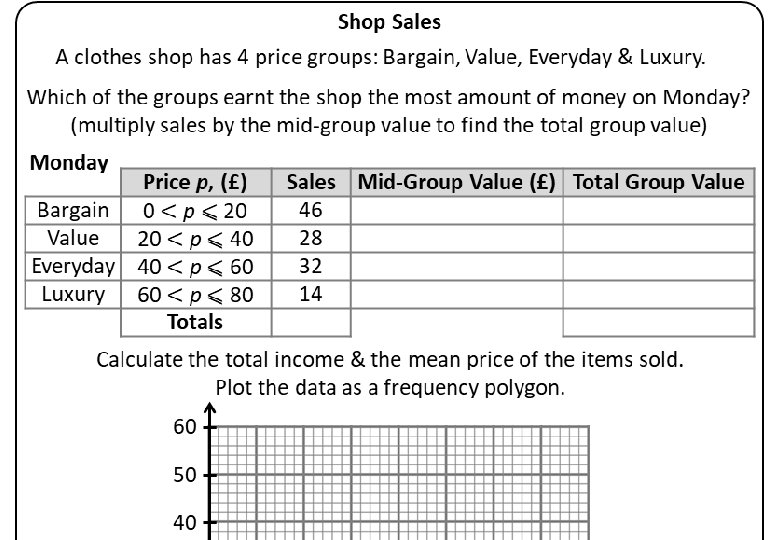
Shop Sales A clothes shop has 4 price groups: Bargain, Value, Everyday & Luxury. Which of the groups earnt the shop the most amount of money on Monday? (multiply sales by the mid-group value to find the total group value) Monday Price p, (£) Bargain Sales Mid-Group Value (£) Total Group Value 46 Value 28 Everyday 32 Luxury 14 Calculate the total income & the mean price of the items sold. Totals. Plot the data as a frequency polygon. 60 50 40 Sales 30 20 10 0 30 40 50 60 70 80 Price (£) Plot the data for Friday on the same grid. Calculate a mean price. Friday 0 10 Price p, (£) 20 Bargain Sales 26 Value 36 Everyday 40 Luxury 56 What comments can you make comparing the sales on Monday & Friday?
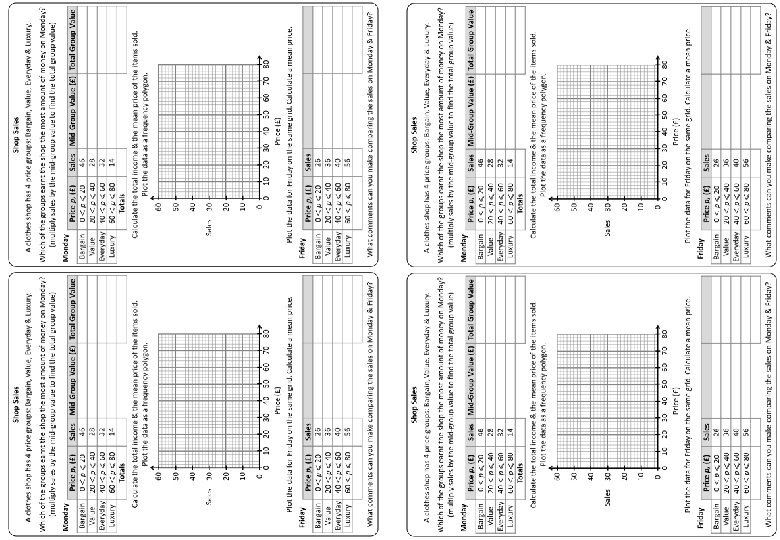
Shop Sales A clothes shop has 4 price groups: Bargain, Value, Everyday & Luxury. Which of the groups earnt the shop the most amount of money on Monday? (multiply sales by the mid-group value to find the total group value) Monday Mean = £ 3880 ÷ 120 = £ 32. 33 Price p, (£) Bargain Sales Mid-Group Value (£) Total Group Value 46 10 460 Value 28 30 840 Everyday 32 50 1600 Luxury 14 70 980 Calculate the total income & the mean price of the items sold. Totals. Plot the 120 3880 data as a frequency polygon. 60 50 40 Sales 30 20 10 0 30 40 50 60 70 80 Price (£) Plot the data for Friday on the same grid. Calculate a mean price. Friday 0 10 Price p, (£) 20 Bargain Sales 26 Value Everyday Mean = £ 7260 ÷ 158 = £ 45. 95 10 260 36 30 1080 40 50 2000 Luxury 56 70 3920 What comments can you make comparing the sales on Monday & Friday?
Shop Sales A clothes shop has 4 price groups: Bargain, Value, Everyday & Luxury. Which of the groups earnt the shop the most amount of money on Monday? (multiply sales by the mid-group value to find the total group value) Monday Price p, (£) Bargain Sales Mid-Group Value (£) Total Group Value 46 Value 28 Everyday 32 Luxury 14 Calculate the total income & the mean price of the items sold. Totals. Plot the data as a frequency polygon. 60 60 50 50 40 40 Sales 30 20 20 10 10 0 30 40 50 60 70 80 Price (£) Plot the data for Friday on the same grid. Calculate a mean price. Friday 0 10 Price p, (£) 20 0 30 40 50 60 70 80 Price (£) Plot the data for Friday on the same grid. Calculate a mean price. Friday 0 10 Bargain Sales 26 Value 36 Everyday 40 Luxury 56 What comments can you make comparing the sales on Monday & Friday? Price p, (£) 20 Luxury 56 What comments can you make comparing the sales on Monday & Friday?
Questions? Comments? Suggestions? …or have you found a mistake!? Any feedback would be appreciated . Please feel free to email: tom@goteachmaths. co. uk