Frequency Polygons Card Complete Match In this activity


 Frequency 120 < h ≤ 130 5 130 <")
 Frequency 120 < h ≤ 130 14 130 <")
 Frequency 120 < h ≤ 130 6 130 <")
 Frequency 120 < h ≤ 130 18 130 <")
 Frequency 120 < h ≤ 130 8 130 <")
 Frequency 120 < h ≤ 130 9 130 <")
 Frequency 120 < h ≤ 130 11 130 <")
 Frequency 120 < h ≤ 130 12 130 <")
 Frequency 120 < h ≤ 130 4 130 <")

- Slides: 18
Frequency Polygons – Card Complete & Match In this activity students work individually or in groups to match questions and answers. ‘Quick Cut’ – Choose the questions/slides you wish to use and delete others. Sets of questions can then be easily guillotined to save time.
Printing To print handouts from slides Select the slide from the left. Then click: File > Print > ‘Print Current Slide’ To print multiple slides Click on a section title to highlight all those slides, or press ‘Ctrl’ at the same time as selecting slides to highlight more than one. Then click: File > Print > ‘Print Selection’ To print double-sided handouts Highlight both slides before using ‘Print Selection’. Choose ‘Print on Both Sides’ and ‘Flip on Short Edge’.
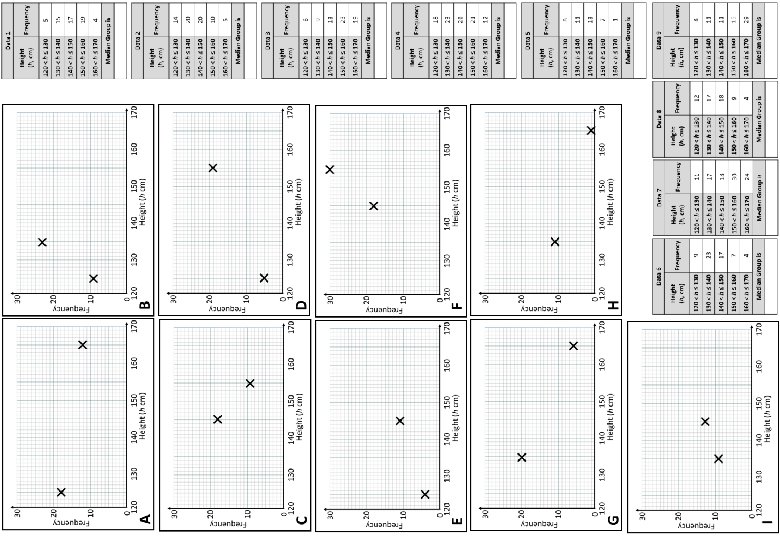
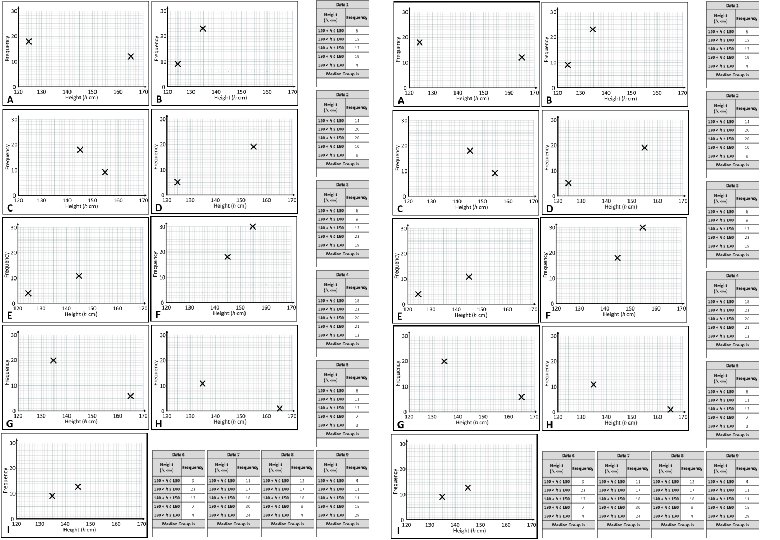
Match the data with a graph, then complete the frequency polygon. Calculate the median group from each set of data.
Half Answers
Answers
Data Frequency Polygon Median 1 D 140 < h ≤ 150 6 B 130 < h ≤ 140 2 G 140 < h ≤ 150 7 F 150 < h ≤ 160 3 I 150 < h ≤ 160 8 C 140 < h ≤ 150 4 A 140 < h ≤ 150 9 E 150 < h ≤ 160 5 H 140 < h ≤ 150 Answers
Data 1 Height (h, cm) Frequency 120 < h ≤ 130 5 130 < h ≤ 140 15 140 < h ≤ 150 17 150 < h ≤ 160 19 160 < h ≤ 170 4 D Median Group is
Data 2 Height (h, cm) Frequency 120 < h ≤ 130 14 130 < h ≤ 140 20 140 < h ≤ 150 20 150 < h ≤ 160 10 160 < h ≤ 170 6 G Median Group is
Data 3 Height (h, cm) Frequency 120 < h ≤ 130 6 130 < h ≤ 140 9 140 < h ≤ 150 13 150 < h ≤ 160 23 160 < h ≤ 170 19 I Median Group is
Data 4 Height (h, cm) Frequency 120 < h ≤ 130 18 130 < h ≤ 140 23 140 < h ≤ 150 26 150 < h ≤ 160 21 160 < h ≤ 170 12 A Median Group is
Data 5 Height (h, cm) Frequency 120 < h ≤ 130 8 130 < h ≤ 140 11 140 < h ≤ 150 13 150 < h ≤ 160 7 160 < h ≤ 170 1 H Median Group is
Data 6 Height (h, cm) Frequency 120 < h ≤ 130 9 130 < h ≤ 140 23 140 < h ≤ 150 17 150 < h ≤ 160 7 160 < h ≤ 170 4 B Median Group is
Data 7 Height (h, cm) Frequency 120 < h ≤ 130 11 130 < h ≤ 140 17 140 < h ≤ 150 18 150 < h ≤ 160 30 160 < h ≤ 170 24 F Median Group is
Data 8 Height (h, cm) Frequency 120 < h ≤ 130 12 130 < h ≤ 140 17 140 < h ≤ 150 18 150 < h ≤ 160 9 160 < h ≤ 170 4 C Median Group is
Data 9 Height (h, cm) Frequency 120 < h ≤ 130 4 130 < h ≤ 140 11 140 < h ≤ 150 11 150 < h ≤ 160 15 160 < h ≤ 170 29 E Median Group is
Questions? Comments? Suggestions? …or have you found a mistake!? Any feedback would be appreciated . Please feel free to email: tom@goteachmaths. co. uk