Frequency Histogram Relative Frequency Histogram Relative Frequency Histogram
")
")
")


 Material Fatigue (2) Vibration—Rotor-Bearing Dynamics (3) Natural Disasters----Cyclone,")


 (Deterministic) Physical Modeling with Safety Factor: Structure")


- Slides: 46
圖一 出現頻率記錄 (Frequency Histogram)
圖二 出現相對頻率記錄 (Relative Frequency Histogram)
圖三 修正出現相對頻率記錄 (Relative Frequency Histogram)
風車系統簡介與優化設計之應用 風車是一部能量轉換機器 Kinetic Energy → 風的動能 Wind Mechanical Energy → 風車 → Wind Turbine Windmill Electrical Energy 發電機 → Generator
Dutch windmill
Dutch Windmill interior Structure
Modern Wind Turbine 450 kw
Ocean Tidal Turbine
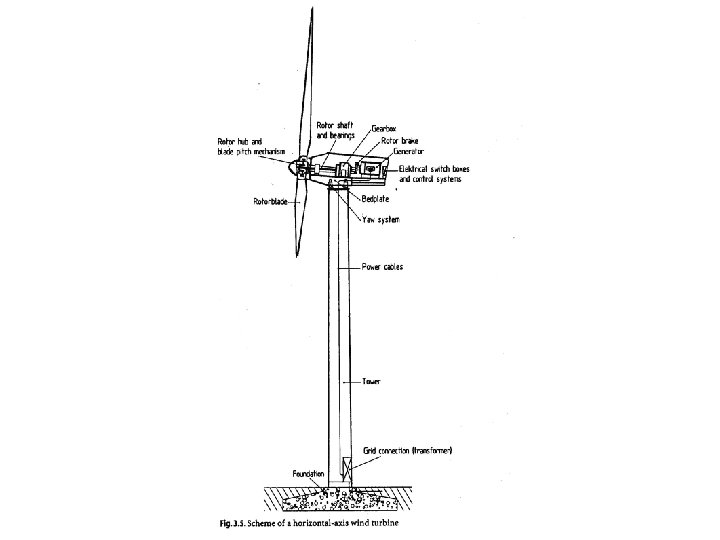
Modern Wind Turbine Sketch
Basic Mechanical Transmission and Power Generation Wind Turbine Grid frequency Europe 50 hz USA 60 hz → Gearbox Transmission Generator has to match grid frequency, required rpm → Generator → grid Gearbox converts turbine speed to generator speed Fixed transmission: turbine rotor is controlled to feed gearbox with a constant speed. Variable transmission turbine rotor is free to provide its variable speeds to the gearbox or add a frequency inverter aft the generator to feed the grid network.
Basic Mechanical Transmission and Power Generation Wind Turbine Grid frequency Europe 50 hz USA 60 hz → Gearbox Transmission Generator has to match grid frequency, required rpm → Generator → grid Gearbox converts turbine speed to generator speed Fixed transmission: turbine rotor is controlled to feed gearbox with a constant speed. Variable transmission turbine rotor is free to provide its variable speeds to the gearbox or add a frequency inverter aft the generator to feed the grid network.
Ideal and realistic wind turbine power extraction
Ideal turbine power extracted from free stream air P= Cp Po Cp= 0. 593 momentum theory P 0 = ½ ρV 03 A free stream power Realistic turbine power considering friction and rotor characteristics P=Cp ½ ρVw 3 A Cp= λCQ M= CQ ½ ρVw 2 AR λ=Vt / Vw
Rotor power coefficient vs. turbine tip speed
Whole wind turbine structure and generator
Gearbox changes low speed rotor to high speed generator
Gearbox close-up
SKF Roller Bearing for Wind Turbine
Roller Bearing Housing
Large Roller Bearing
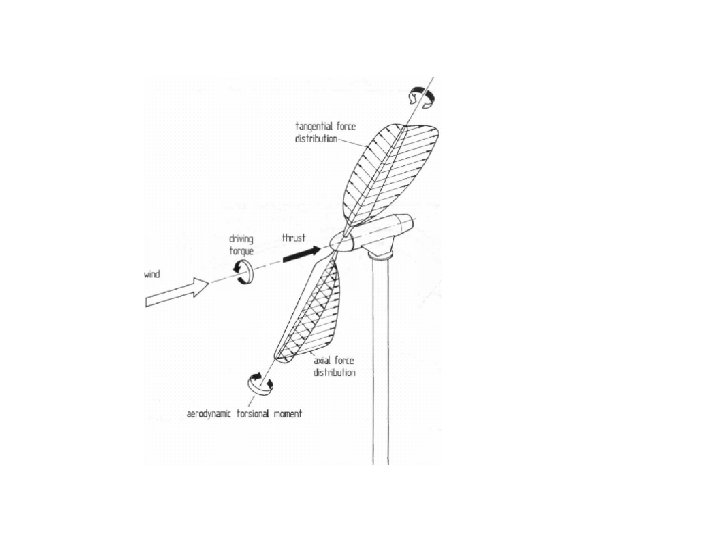
Wind Turbine Loading Situation
Causes of Wind Turbine Failure (1) Material Fatigue (2) Vibration—Rotor-Bearing Dynamics (3) Natural Disasters----Cyclone, Tornado, Tsunami and (4) Earthquake (1) Fatigue: Tower, Blade, Hub and Nacelle (2) Vibration: Rotor, Bearing and Gearbox “Failure” (3) Disaster: Foundation and Control Mechanism Possible Solutions: (1) Design (good tool) (2) Tests and Data Acquisition (field operation) (3) Experiments (models) (4) Research and Development (new tool & components)
Wind Turbine Damage
Wind Turbine Gearbox Damage
A Sample of Tilting-Pad Bearing
Tilting-Pad Bearing Sketch
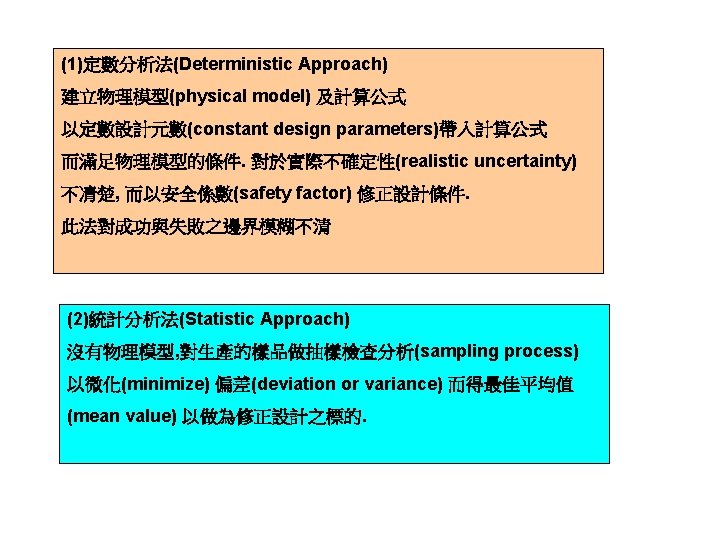
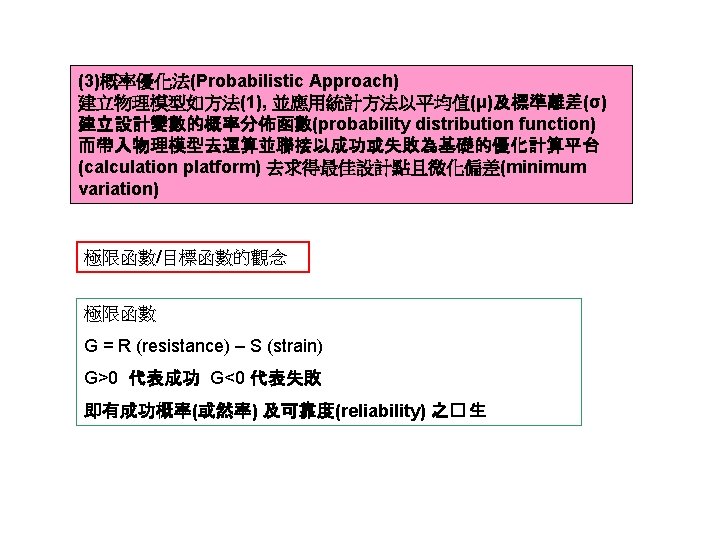
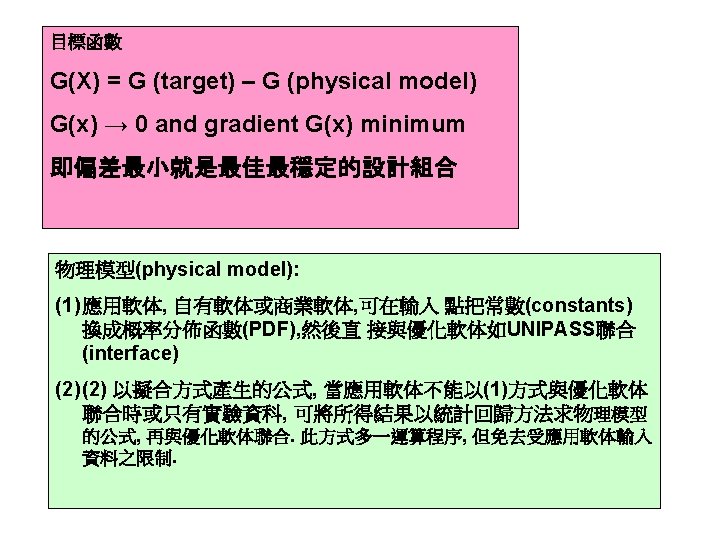
Robust Design and Reliability Three Methods: (1) (Deterministic) Physical Modeling with Safety Factor: Structure Dynamics, Computational Fluid Dynamics, Rotor Bearing Dynamics, Structure-Fluid interaction Fatigue Analysis, Test Data Acquisition etc. After computation, add a safety factor for design. (2) Statistic Method: Effective sampling, Searching for Expectation (mean) Value and Minimizing Variance. Find µ with minimum σ (3) Probabilistic Method (Statistic + Physical Modeling): Define a Limit state function= Target Value – Results of Physical Model In side the physical model, convert design parameters into probability distribution functions (random numbers for uncertainty). Analytic or Simulation Methods to satisfy limit-state function and minimize variance. Design numbers are expectation numbers µ’s.
Example of Probabilistic Robust Design of Wind Blade Wind Power equation: P= Cpρ/2 Vw 3 A A= πR 2 Let’s say to build a 1. 5 MW turbine with maximum power coefficient Cp=0. 48 (3 blades) from the figure Let Vw and R be random variables. We want to find best values of Vw and R (expectation numbers) for steady power output of 1. 5 MW. We assign normal distribution pdf’s for Vw and R with mean values in the ranges: Vw : 4 meter/sec-----12 meter/sec R : 50 meters ------ 100 meters UNIPASS calculation results: Vw = 10. 5 meter/sec R = 37. 4 meter Let us look at GE 1. 5 MW series Wind Turbines
Rotor power coefficient vs. turbine tip speed
GE 1. 5 MW series Wind Turbines
Operation and Maintenance “Tracking”, “Tracking” “Location”, “Location” Maintenance Cost: 1. 0 -1. 6 cents per kwhr. Turbine Cost: 5 cents per kw. Maintenance Difficulties: (1) Component Accessibility (2) Lubrication Challenge (3) Taiwan Special Situation: Earthquake and Typhon
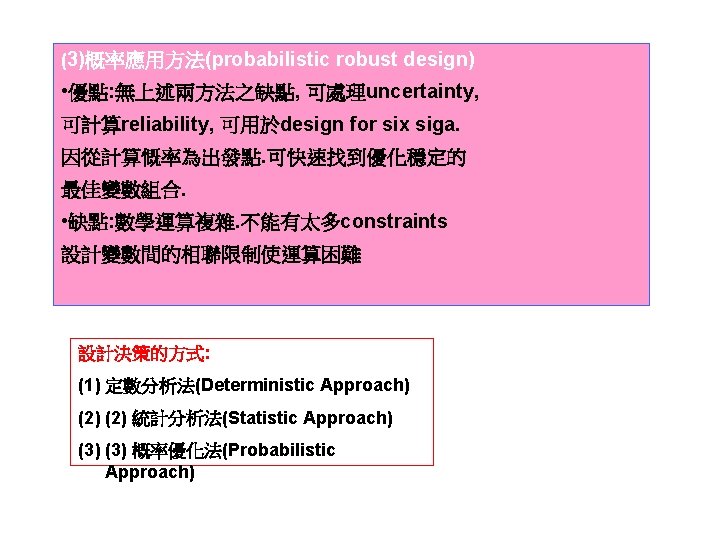
• The whole system is influenced by its uncertain environment. • 整個系統受不確定的周遭環境所影響 • Engineering ingenuity and probabilistic approach may serve as technical drivers for future developments. • 對未來的發展, 程創新能力及概率應用方法是主要的 推動力.