
Frequency Distributions 1128 Objective Students will be able
Frequency Distributions 11/28 Objective: Students will be able to understand frequency and probability distributions. Students will also be able to find measures of statistical dispersion. Standards: 1. 02 Summarize and analyze univariate data to solve problems Essential Question: What is your frequency table for the statistics project? LESSON One method for simplifying and organizing data is to construct a frequency distribution. A frequency distribution is an organized tabulation showing exactly how many individuals are located in each category on the scale of measurement. A frequency distribution presents an organized picture of the entire set of scores, and it shows where each individual is located relative to others in the distribution.
Frequency Distribution Tables • A frequency distribution table consists of at least two columns - one listing categories on the scale of measurement (X) and another for frequency (f). • In the X column, values are listed from the highest to lowest, without skipping any. • For the frequency column, tallies are determined for each value (how often each X value occurs in the data set). These tallies are the frequencies for each X value. • The sum of the frequencies should equal N.
Frequency Distribution Tables (cont. ) • A third column can be used for the proportion (p) for each category: p = f/N. The sum of the p column should equal 1. 00. • A fourth column can display the percentage of the distribution corresponding to each X value. The percentage is found by multiplying p by 100. The sum of the percentage column is 100%.
Types of Frequency Distribution Tables • When a frequency distribution table lists all of the individual categories (X values) it is called a regular frequency distribution. • Grouped frequency distribution is a set of scores that cover a wide range of values. A list of all the X values would be quite long - too long to be a “simple” presentation of the data.
Grouped Frequency Distribution (cont. ) • In a grouped table, the X column lists groups of scores, called class intervals, rather than individual values. • These intervals all have the same width, usually a simple number such as 2, 5, 10, and so on. • Each interval begins with a value that is a multiple of the interval width. The interval width is selected so that the table will have approximately ten intervals.
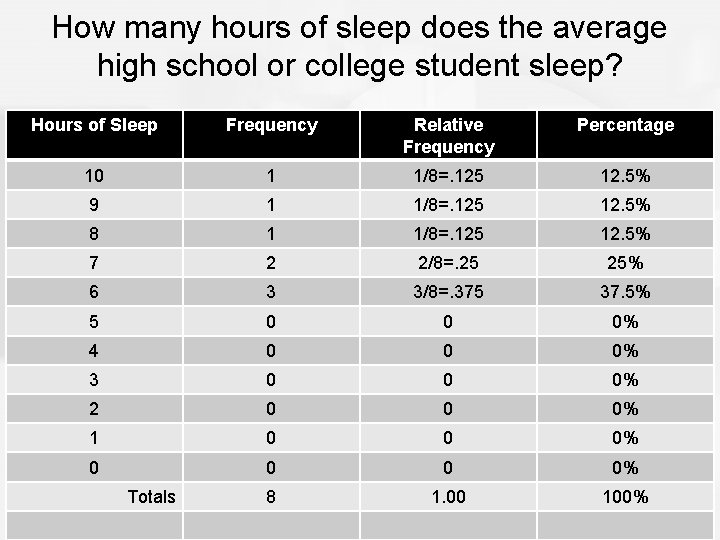
How many hours of sleep does the average high school or college student sleep? Hours of Sleep Frequency Relative Frequency Percentage 10 1 1/8=. 125 12. 5% 9 1 1/8=. 125 12. 5% 8 1 1/8=. 125 12. 5% 7 2 2/8=. 25 25% 6 3 3/8=. 375 37. 5% 5 0 0 0% 4 0 0 0% 3 0 0 0% 2 0 0 0% 1 0 0 0% 8 1. 00 100% Totals
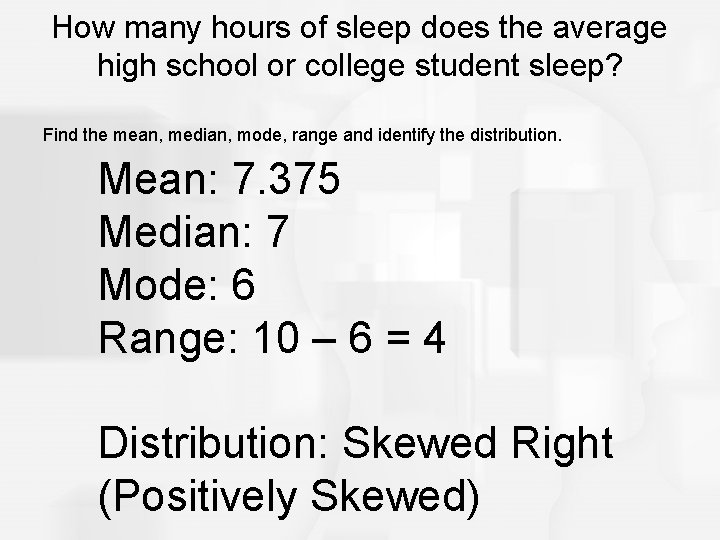
How many hours of sleep does the average high school or college student sleep? Find the mean, median, mode, range and identify the distribution. Mean: 7. 375 Median: 7 Mode: 6 Range: 10 – 6 = 4 Distribution: Skewed Right (Positively Skewed)
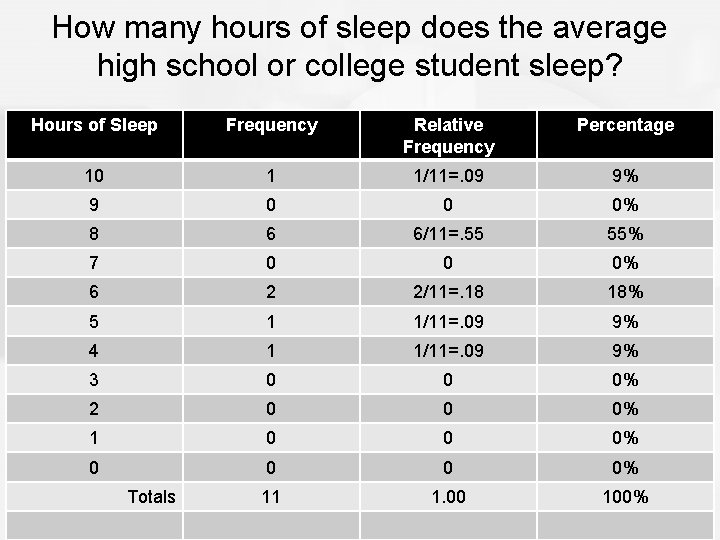
How many hours of sleep does the average high school or college student sleep? Hours of Sleep Frequency Relative Frequency Percentage 10 1 1/11=. 09 9% 9 0 0 0% 8 6 6/11=. 55 55% 7 0 0 0% 6 2 2/11=. 18 18% 5 1 1/11=. 09 9% 4 1 1/11=. 09 9% 3 0 0 0% 2 0 0 0% 1 0 0 0% 11 1. 00 100% Totals
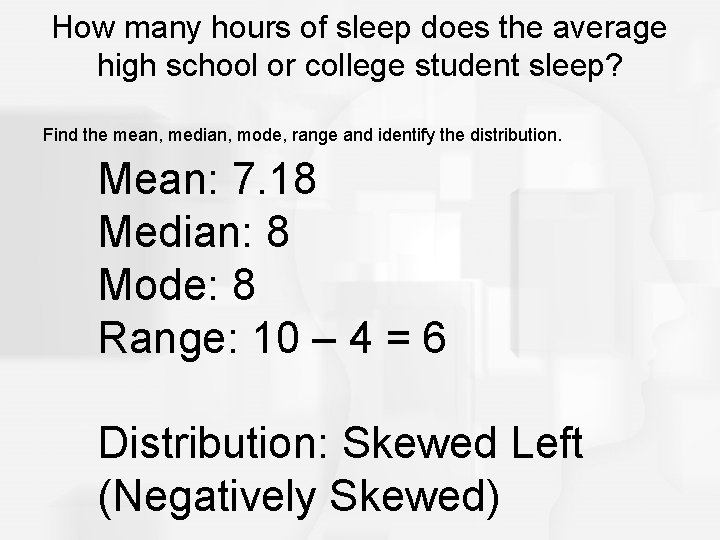
How many hours of sleep does the average high school or college student sleep? Find the mean, median, mode, range and identify the distribution. Mean: 7. 18 Median: 8 Mode: 8 Range: 10 – 4 = 6 Distribution: Skewed Left (Negatively Skewed)
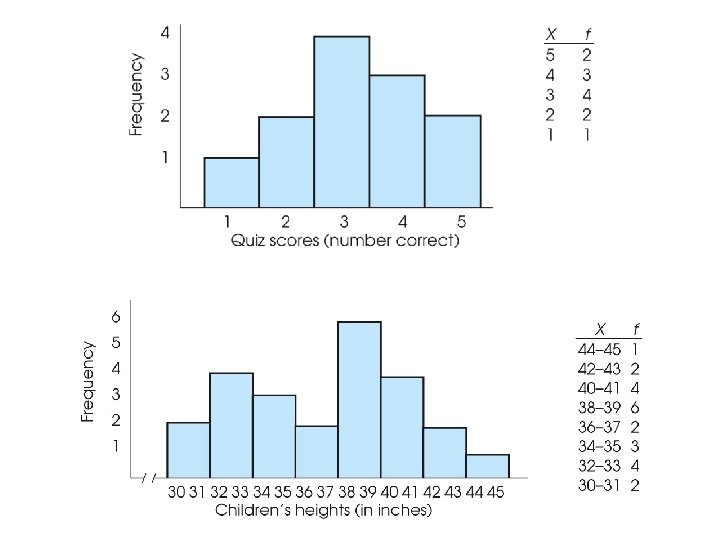
Frequency Distribution Graphs • In a frequency distribution graph, the score categories (X values) are listed on the X axis and the frequencies are listed on the Y axis. • When the score categories consist of numerical scores from an interval or ratio scale, the graph should be either a histogram or a polygon. 10
Histograms • In a histogram, a bar is centered above each score (or class interval) so that the height of the bar corresponds to the frequency and the width extends to the real limits, so that adjacent bars touch. 11
- Slides: 12