
Frequency Distribution A Frequency Distribution organizes data into
Frequency Distribution A Frequency Distribution organizes data into classes, or categories, with a count of the number of observations that fall into each class.
Characteristics of Classes • Class Limits; – smallest and largest observed values that can belong to a class • Boundaries; – actual values that separate successive classes • Intervals; – the distance spanned by the boundaries of a class • Class Midpoint – the arithmetic mean of its class boundaries
Steps for Constructing a Frequency Distribution • Array the data values in order by size from lowest to highest (or vice versa); • Compute the range; • Divide the range into a convenient number of class intervals of equal size; • Count the number of observations in each class to determine the total frequency; and • Display the class intervals with their frequencies.
How to Select a Class Interval? Some Rules of Thumb! • Select a class interval that • The number of classes, allows from 6 to 15 classes. k, should be the Too many classes can smallest integer such destroy the summary effect that 2 k > n, where n is of the grouping; too few the number of classes can produce observations. oversimplification of the data and result in inaccuracies from subsequent calculations.
The Two Firm Rules in Grouping Data: • The All-Inclusive • The Mutually-Exclusive Rule: classes must be All-Inclusive. Allmutually exclusive. inclusive classes are Classes must be arranged classes that together such that every piece of contain all the data can be placed in only one class.
Class Midpoint Each class has a lower limit and an upper limit. Class midpoint, Mi, is the arithmetic mean of the two limits. Mi = (lower limit + upper limit) / 2
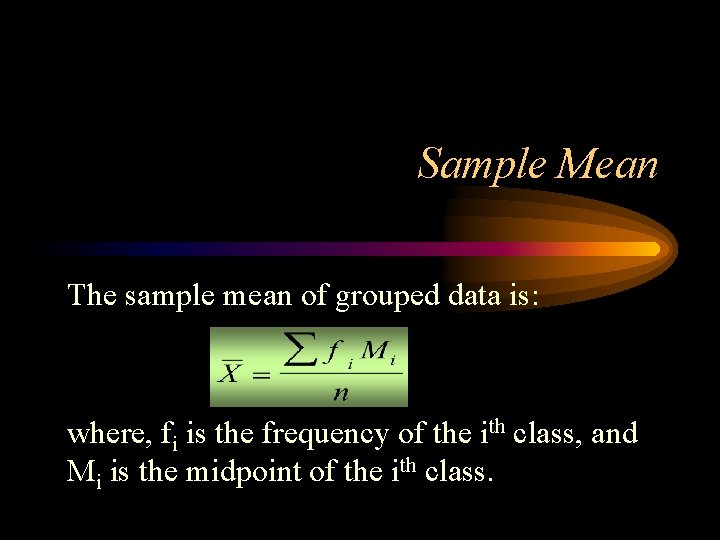
Sample Mean The sample mean of grouped data is: where, fi is the frequency of the ith class, and Mi is the midpoint of the ith class.
Sample Median The sample median of grouped data is: Med = L + ( n 1 / n 2 ) i where, L is the lower limit of the median class, n 1 is the number of data values in the median class that lie below the median position, n 2 is the number of observations in the median class, and i is class interval.
Sample Mode is the midpoint of the class having the greatest frequency.
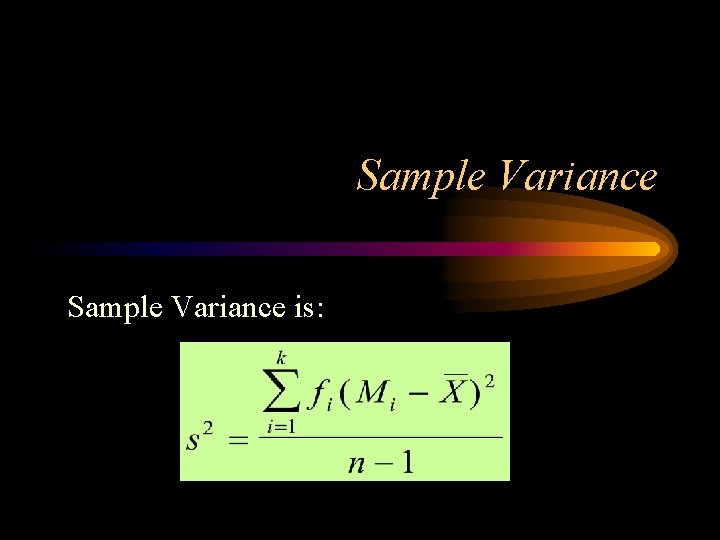
Sample Variance is:
Sample Standard Deviation is: s = SQRT( Variance )
- Slides: 11