Freeway Capacity and Level of Service Concepts of

 • LOS (demand vs. supply) •")


” conditions Factors that affect operation")
 Conditions (dependent on facility type) 12 ft lanes adequate")


 Weaving Section Ramp Junctions")
 for LOS Type of Facility Freeway Basic Segments Freeway")


Conditions for Basic Freeway Section • Good weather, good visibility, no incident, no")

")
")
")
 Density Maximum Service Flow rate")

 pcphpl")


 • Extended Freeway Segments Ex 11 -10 •")


 Vp = Peak 15 -min")


- Slides: 41
Freeway Capacity and Level of Service • Concepts of capacity and level of service • Freeway level of service analysis procedure based on HCM
Capacity and Level of Service • Capacity (supply) • LOS (demand vs. supply) • Capacity and LOS analysis for different types of facilities (HCM procedures) • Freeway basic segments • Freeway ramp junctures • Freeway weaving sections • Multilane highways • Two-lane highways • Signalized intersections
What is capacity, what is LOS? v u 1 LOS u 2 q 1 q 2 qmax capacity q
Capacity: Definition The maximum hourly flow rate of vehicles, passengers, or the like, which can be reasonably expected to traverse a point or a section under prevailing roadway, traffic, and control conditions.
Capacity Key word: maximum hourly flow rate - Expected maximum handling capability determined by physical feature of the facility - Independent of demand NOT number currently using facility (This is flow rate or volume!!)
Capacity Key word: prevailing conditions Actual conditions, not “ideal(base)” conditions Factors that affect operation of Traffic Flow & Capacity • Traffic (volume, PHF) • Roadway(# lanes, shoulder widths, grade, etc) • Vehicle composition (Truck/Bus/RV %) • Traffic control
Prevailing Conditions vs. Ideal (Base) Conditions (dependent on facility type) 12 ft lanes adequate shoulder 100% passenger cars 0% grades minimal disturbance (from interchange, access points, etc) ……
Factors Affecting Capacity and LOS
Level of Service Describes the QUALITY of service achieved on a transportation system in terms of… – Speed/travel time – freedom to maneuver – Traffic interruptions – Comfort – Convenience – Safety
Level of Service Qualitative measure that characterizes operational conditions. • 6 Levels (A – F) • A: free-flow • F: forced-flow • E: capacity A B C D E F
Highway LOS A LOS B LOS C
Highway LOS D LOS E LOS F
Service Flow Rate Maximum flow rate of vehicles, passengers, or the like, which can be accommodated by a given facility or system under given condition AT A GIVEN LEVEL OF SERVICE (except LOS F). – Service flow rate for LOS E: capacity – e. g. , If actual flow> service flow rate for LOS B & < service flow rate for LOS C == > LOS is C
Highway Capacity Manual Procedures • • Freeway Systems Highways Urban Streets Pedestrian and Bicycles • Transit • (Now HCM 2010)
Freeway System Basic Segments (sections) Weaving Section Ramp Junctions
Primary Measures of Effectiveness (MOEs) for LOS Type of Facility Freeway Basic Segments Freeway Weaving Areas Freeway Ramp Junctions Multilane Highways Signalized Intersections Arterials Transit Pedestrians MOE Density (pcpmpl) Density Flow Rate/Density (pcph) Density/FFS Average Control Delay (sec/veh) Average Travel Speed (mph) Load Factor(pers/seat, veh/h, people/hr) Space (sq ft/ped)
Selection of Design LOS A? No: too expensive and over design LOS E or F? No: too much congestion Mostly C or sometimes D allow some slowdowns, but no stop&go B is desired for rural highways
HCM Procedure for Freeway Basic Section • Basic Section: a section beyond the influence of merging or diverging movements • The procedure is very similar to that of multilane highways
Ideal (Base)Conditions for Basic Freeway Section • Good weather, good visibility, no incident, no work zone, no pavement deteriration • 12 ft (3. 6 m) lanes • At least 6 ft (1. 8 m) right shoulder clearance • All passenger cars • Level terrain • Familiar driving population • Capacity (under Ideal <base> Conditions) – 55 mph 2250 pcphpl – 70 or 75 mph 2400 pcphpl
Level of Service for Basic Freeway Section • Level of Service based on traffic density in section LOS A B C D E F Density Range (pc/mi/ln=pcpmpl) 0 -11 >11 -18 >18 -26 >26 -35 >35 -45 >45
Speed-flow curves and LOS (HCM 2000)
Speed-flow curves and LOS (HCM 2010)
LOS Criteria (HCM 2000)
LOS Criteria (HCM 2010) Density Maximum Service Flow rate
Steps for Determining LOS of Basic Freeway Segment • Step 1. Determine Free-Flow Speed • Step 2. Determine Flow Rate • Step 3. Determine Speed using Speed-Flow Curve • Step 4. Compute Density • Step 5. Determine Level of Service
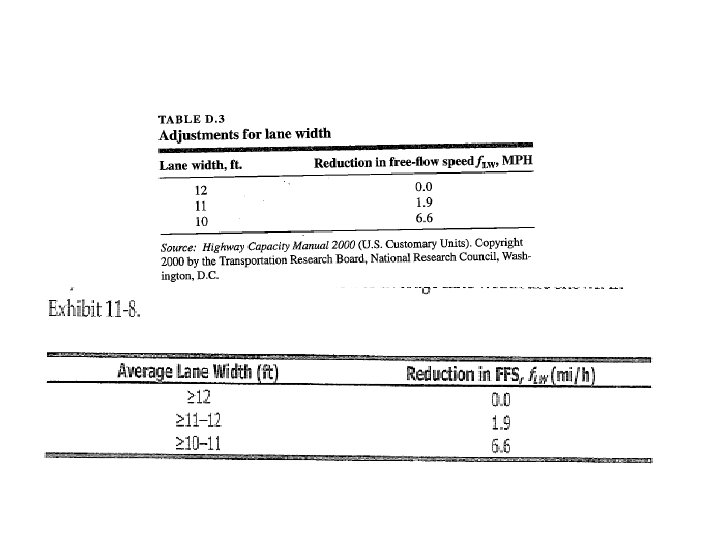
Step 1. Determine FFS a. Field measurement at flow<1000 (1300 in HCM 2000) pcphpl a. By estimation FFS = Estimated free-flow speed, mph. f. LW = adjustment for lane width Exhibit 11 -8, mph f. LC = adjustment for right shoulder clearance Ex. 11 -9, mph (no value change from HCM 2000 to HCM 2010) TRD=total ramp density (ramps/mi), defined as the # ramps (on and off, one direction) located btw 3 mile upstream and 3 mile downstream divided by 6.
Same values as in Exhibit 11 -9 in HCM 2010
Selection of FFS • Interpolation not recommended • Round to nearest 5 mph as follows:
Step 2. Determine Peak 15 -min Flow Rate vp = 15 -min passenger car equivalent flow rate, pc/h/ln (pcphpl) V = Hourly volume, veh/h (vph) PHF = peak hour factor (typically 0. 85 -0. 98 on freeways) N = number of lanes in one direction f. HV = heavy vehicle factor (must be computed) fp = driver population factor (Ranges from 0. 85 to 1. 0)
Heavy Vehicle Factor ET = Passenger Equivalent for Trucks and Buses PT = Percentage of Trucks and Buses in Traffic Stream ER = Passenger Equivalent for Recreational Vehicles PR = Percentage of RVs in Traffic Stream
Passenger Car Equivalents (No value changes) • Extended Freeway Segments Ex 11 -10 • Specific Upgrades – Trucks and Buses EX 11 -11 – RVs Ex 11 -12 • Specific Downgrades – Trucks and Buses Ex 11 -13 Depends on Grade Steepness, Length of Grade, and Percentage of Vehicles in Traffic Stream
HCM 2000, values same as those in Ex 11 -10 in HCM 2010
values same as those in Ex 11 -11 in HCM 2010
values same as those in Ex 11 -12 in HCM 2010
values same as those in Ex 11 -13 in HCM 2010
Step 3. Determine Speed Estimated from the flow-speed diagram
Step 4. Compute Density D = Density pc/mi/ln (pcpmpl) Vp = Peak 15 -min flow rate S = Estimated Speed
Step 5. Determine Level of Service • Compare computed density to values in Table LOS A B C D E F Density Range (pc/mi/ln) 0 -11 >11 -18 >18 -26 >26 -35 >35 -45 >45
Step 5. Determine Level of Service • Use Figure directly (Based on flow & speed). LOS D
Applications 1. Operation Analysis • LOS, Density, average speed 2. Design • # lanes 3. Planning • From AADT to # lanes