
Free Cooling Application for Energy Savings at Purdue

- Slides: 41
Free Cooling Application for Energy Savings at Purdue Jim Braun Travis Horton Bonggil Jeon Rita Jaramillo September 2012
Overview Problem Statement Background Northwest Chiller Plant Overview Free Cooling Plume abatement Preliminary Findings Free Cooling Approach Free Cooling Modeling Cooling Tower Modeling Northwest Plant Free Cooling Model Results Free Cooling Performance with All CT Free Cooling Performance with Concrete CT Economic comparison Conclusions Next Steps
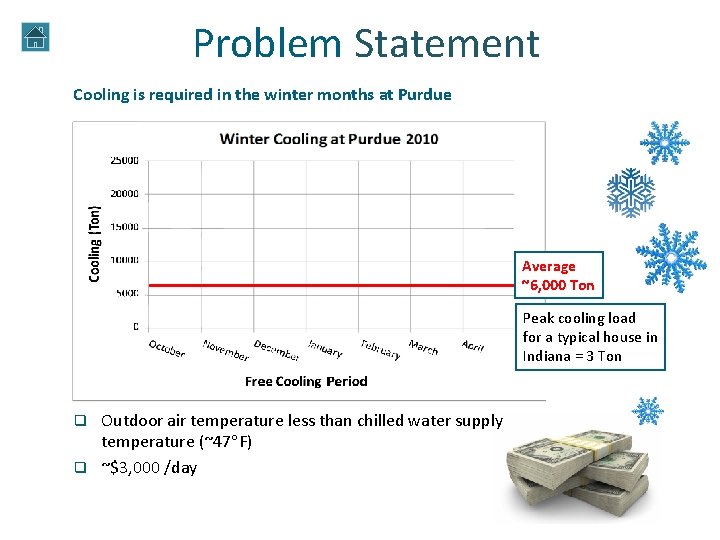
Problem Statement Cooling is required in the winter months at Purdue 2010 Average ~6, 000 Ton Peak cooling load for a typical house in Indiana = 3 Ton Outdoor air temperature less than chilled water supply temperature (~47 F) q ~$3, 000 /day q
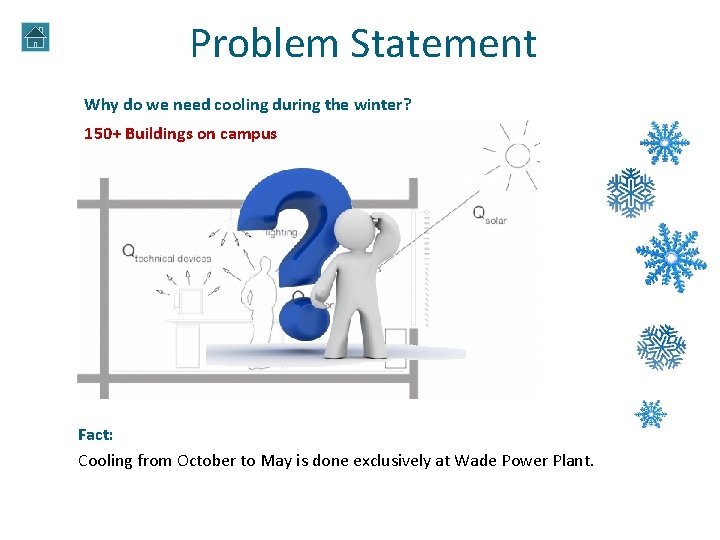
Problem Statement Why do we need cooling during the winter? 150+ Buildings on campus Fact: Cooling from October to May is done exclusively at Wade Power Plant.
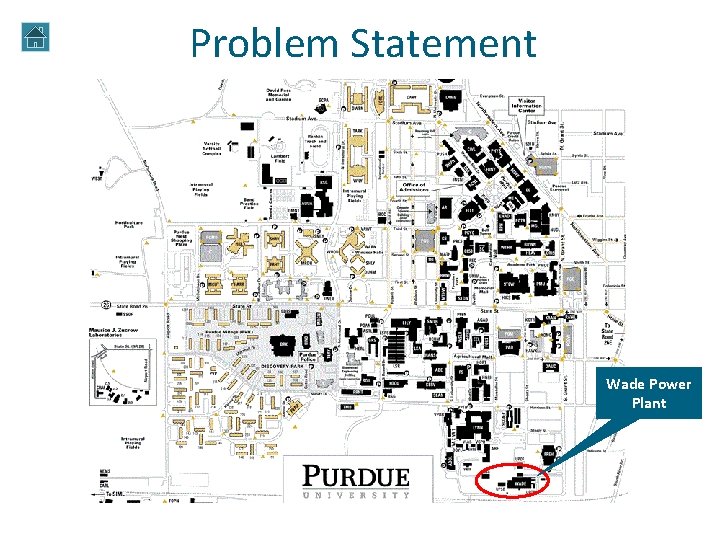
Problem Statement Wade Power Plant
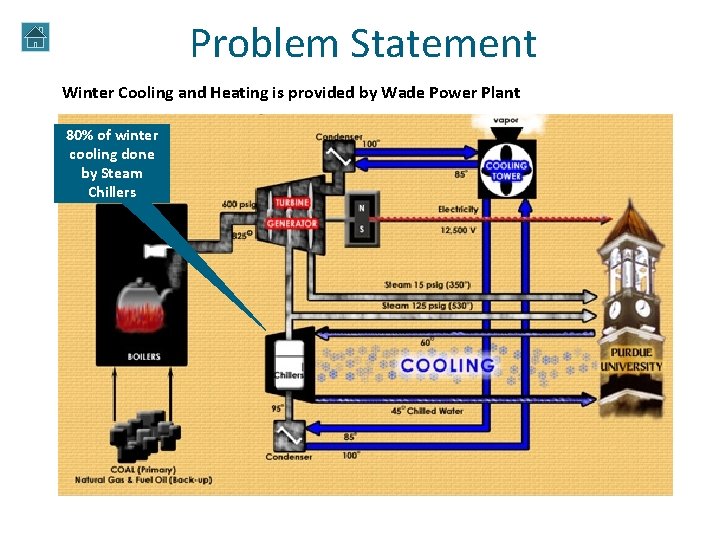
Problem Statement Winter Cooling and Heating is provided by Wade Power Plant 80% of winter cooling done by Steam Chillers
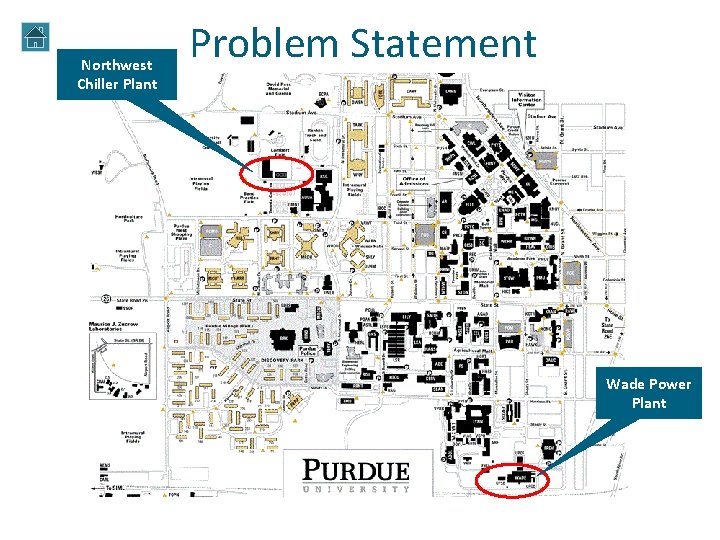
Northwest Chiller Plant Problem Statement Wade Power Plant
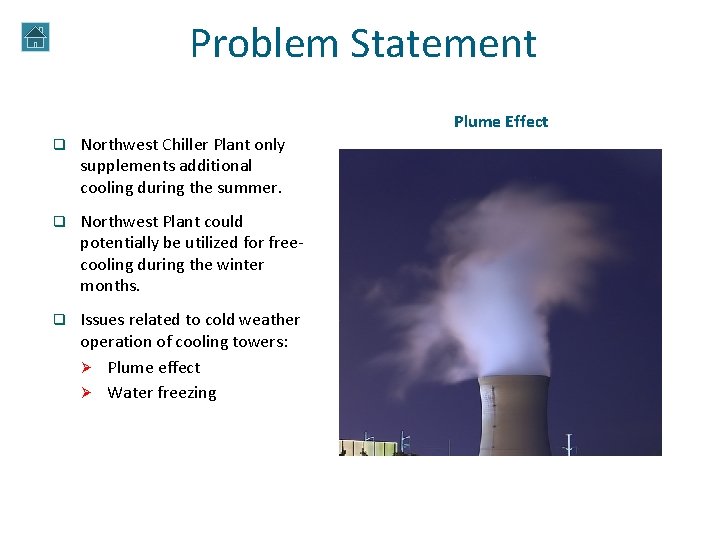
Problem Statement Northwest Plume. Chiller Effect Plant q Northwest Chiller Plant only supplements additional cooling during the summer. q Northwest Plant could potentially be utilized for freecooling during the winter months. q Issues related to cold weather operation of cooling towers: Ø Plume effect Ø Water freezing
Problem Statement Is it feasible to operate the Northwest Plant in free cooling mode during the coldest months of the year? q What are the modifications and costs for implementing free cooling technology at the Northwest Plant? q What are the modifications of the cooling towers for cold weather operation? q What are the performance characteristics and economic benefits of free cooling implementation at Northwest Plant?
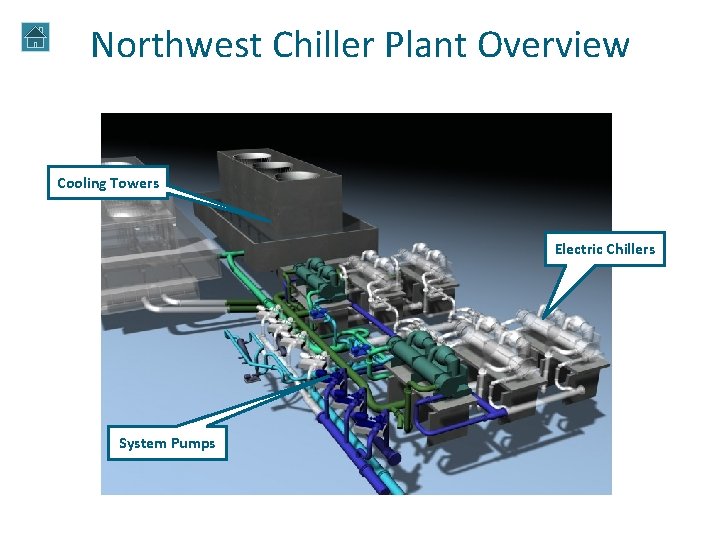
Northwest Chiller Plant Overview Cooling Towers Electric Chillers System Pumps
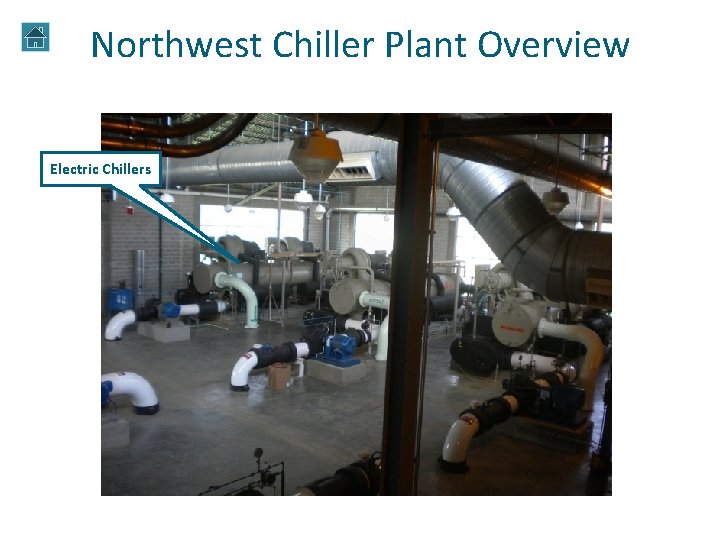
Northwest Chiller Plant Overview Electric Chillers
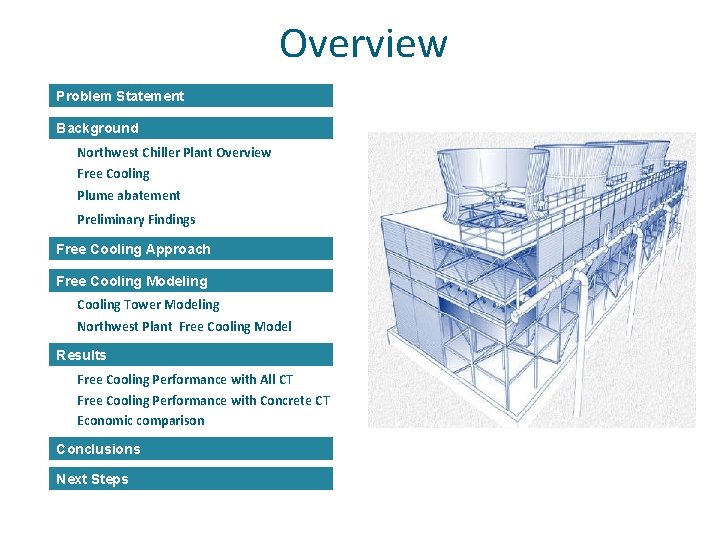
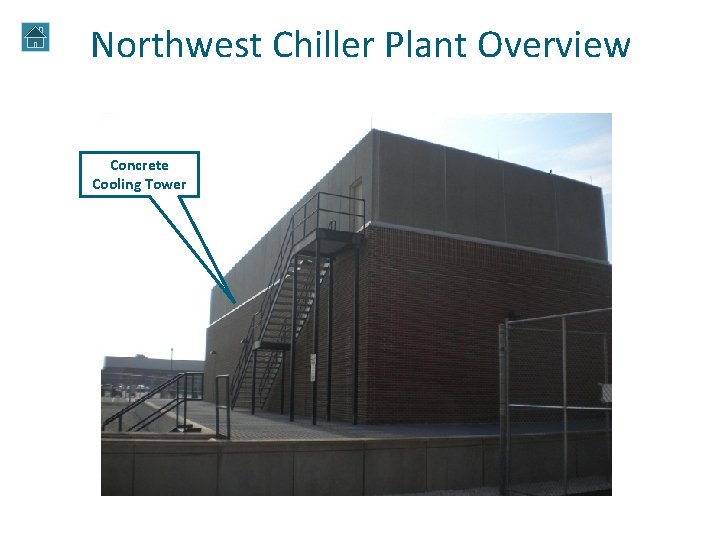
Northwest Chiller Plant Overview Concrete Cooling Tower
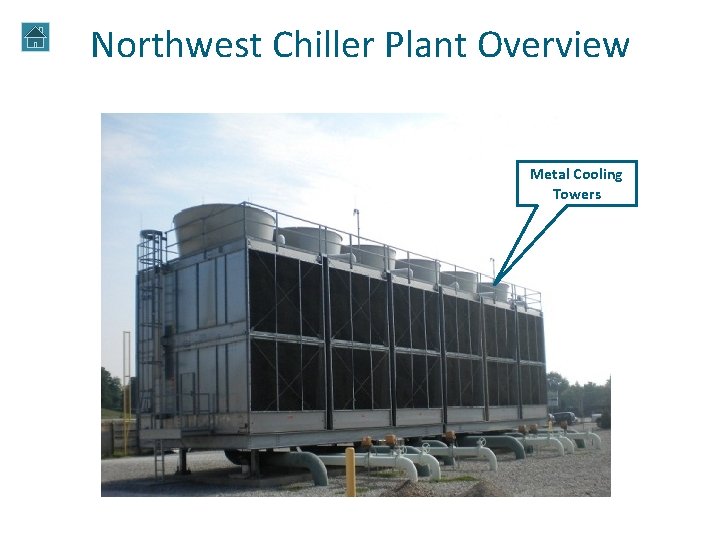
Northwest Chiller Plant Overview Metal Cooling Towers
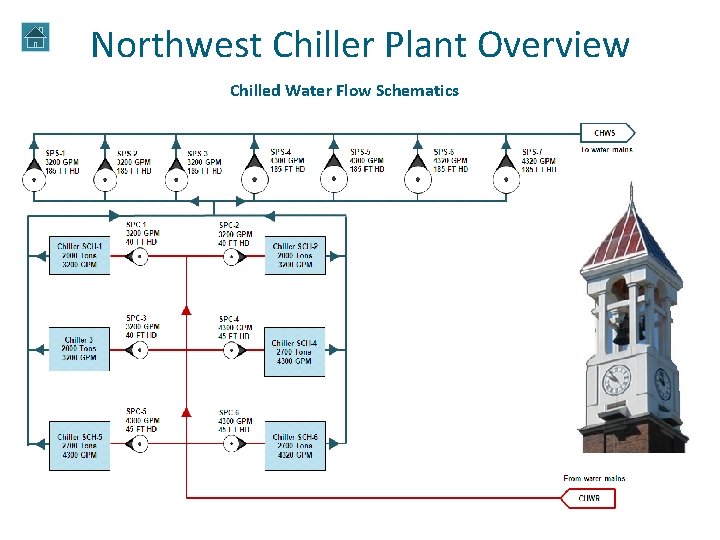
Northwest Chiller Plant Overview Chilled Water Flow Schematics
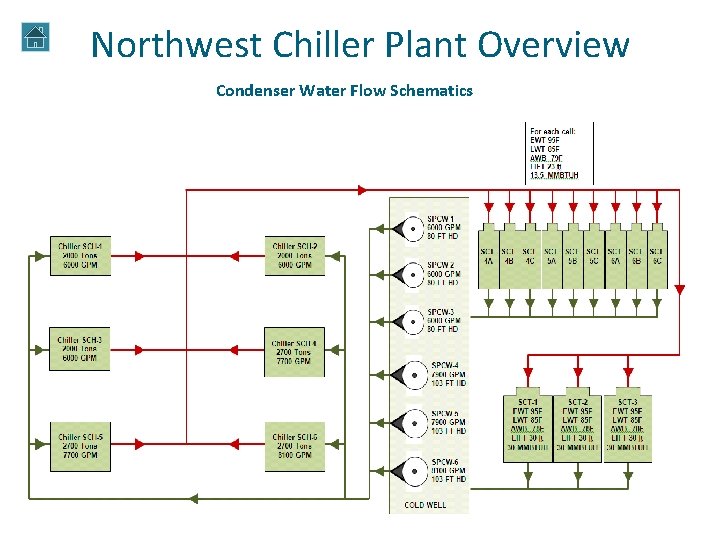
Northwest Chiller Plant Overview Condenser Water Flow Schematics
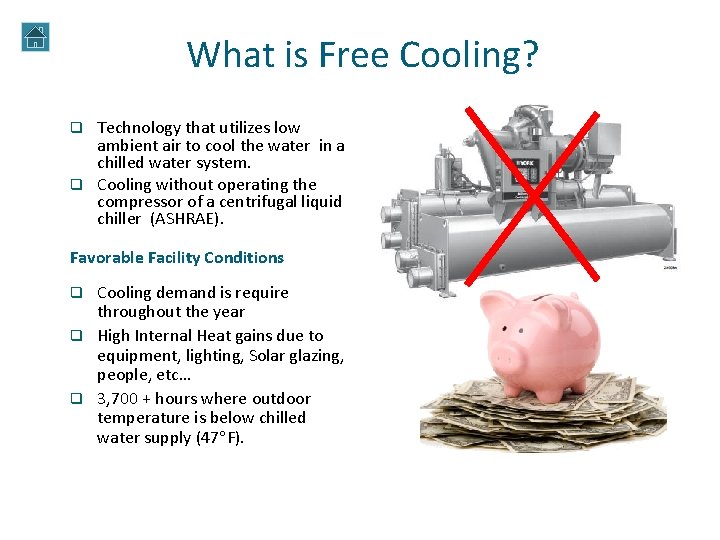
What is Free Cooling? Technology that utilizes low ambient air to cool the water in a chilled water system. q Cooling without operating the compressor of a centrifugal liquid chiller (ASHRAE). q Favorable Facility Conditions Cooling demand is require throughout the year q High Internal Heat gains due to equipment, lighting, Solar glazing, people, etc… q 3, 700 + hours where outdoor temperature is below chilled water supply (47 F). q Chiller
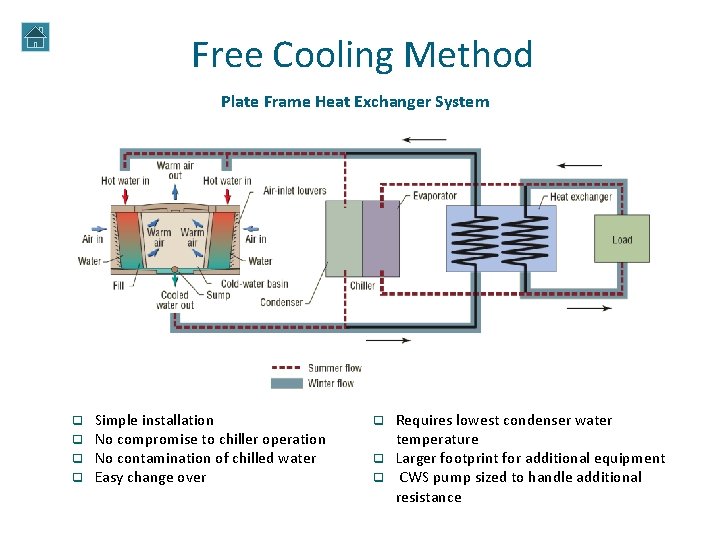
Free Cooling Method Plate Frame Heat Exchanger System q q Simple installation No compromise to chiller operation No contamination of chilled water Easy change over Requires lowest condenser water temperature q Larger footprint for additional equipment q CWS pump sized to handle additional resistance q
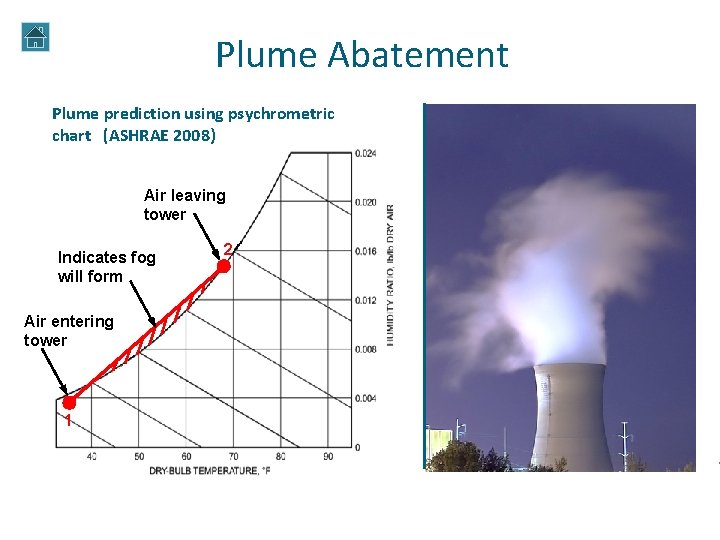
Plume Abatement Plume prediction using psychrometric chart (ASHRAE 2008) Air leaving tower Indicates fog will form Air entering tower 1 2 Plume abatement methods q Heating the tower exhaust with natural gas burners. q Heating the tower exhaust with hot-water or steam coils. q Installing precipitators. q Spraying chemicals at the tower exhaust. q Clear. Sky and Air 2 Air (SPX Technologies). q Hybrid wet-dry cooling tower (SPX Technologies)
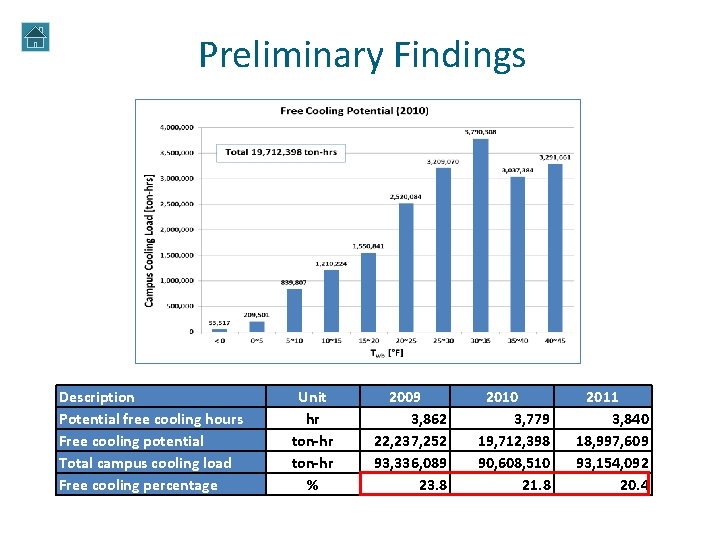
Preliminary Findings Description Potential free cooling hours Free cooling potential Total campus cooling load Free cooling percentage Unit hr ton-hr % 2009 3, 862 22, 237, 252 93, 336, 089 23. 8 2010 3, 779 19, 712, 398 90, 608, 510 21. 8 2011 3, 840 18, 997, 609 93, 154, 092 20. 4
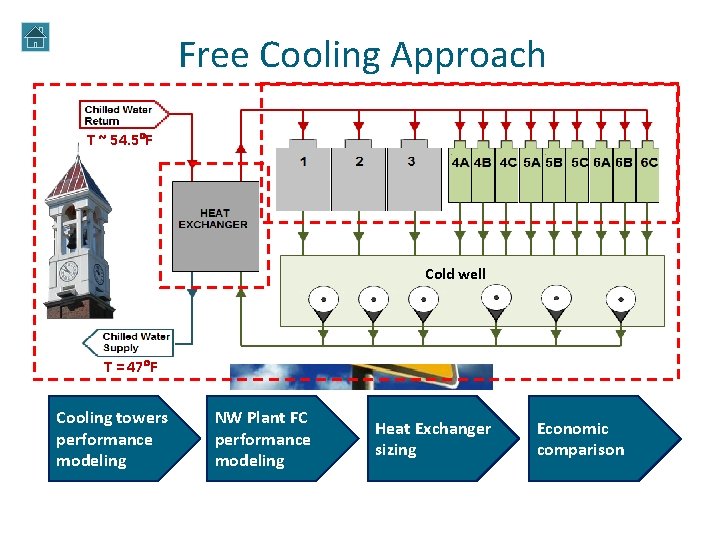
Free Cooling Approach T ~ 54. 5 F Cold well T = 47 F Cooling towers performance modeling NW Plant FC performance modeling Heat Exchanger sizing Economic comparison
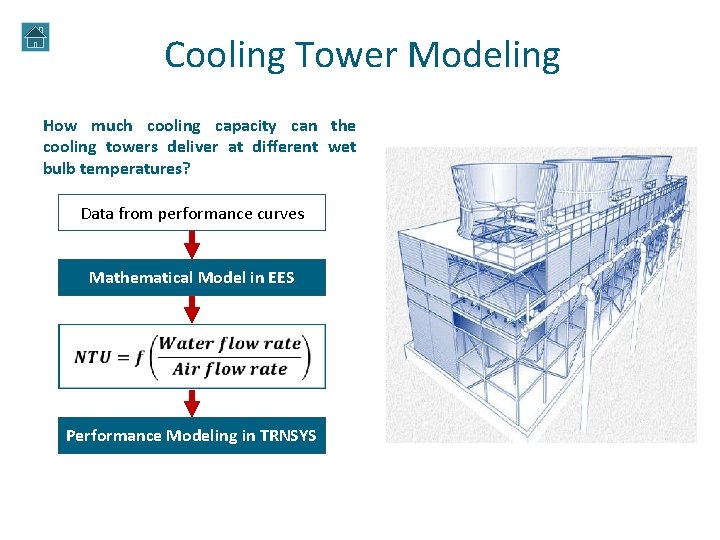
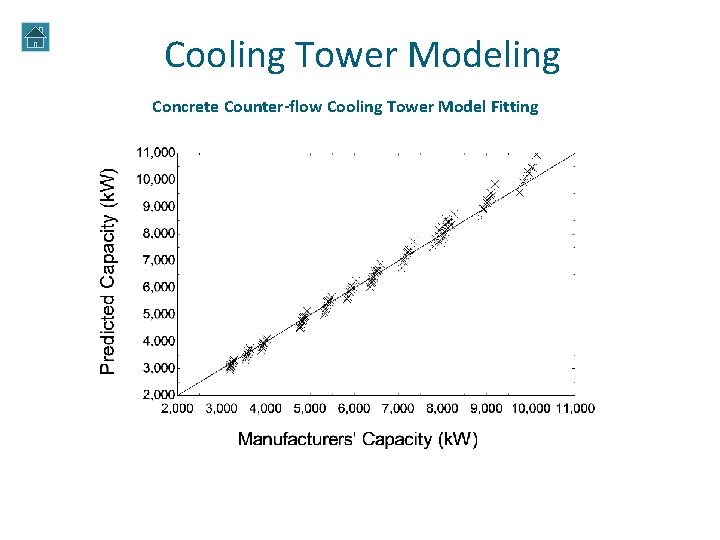
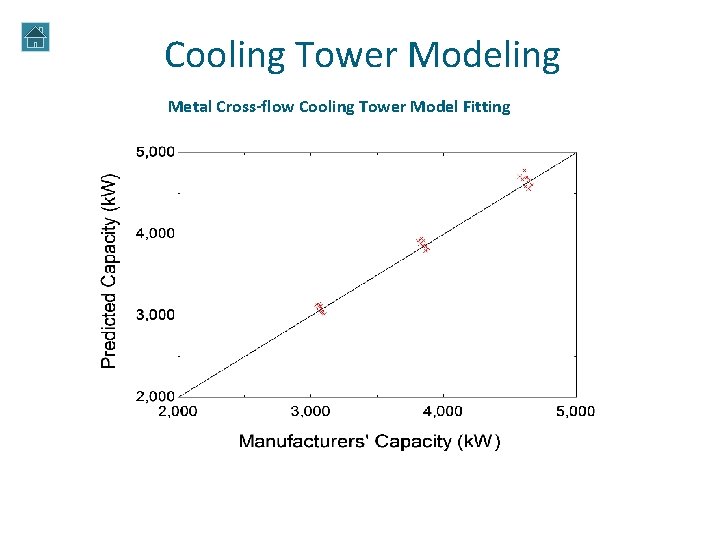
Cooling Tower Modeling How much cooling capacity can the cooling towers deliver at different wet bulb temperatures? Data from performance curves Mathematical Model in EES Performance Modeling in TRNSYS
Cooling Tower Modeling Concrete Counter-flow Cooling Tower Model Fitting
Cooling Tower Modeling Metal Cross-flow Cooling Tower Model Fitting
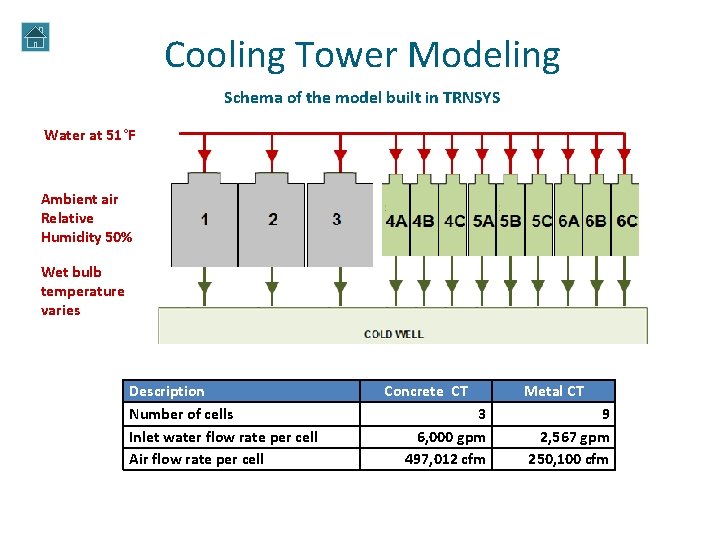
Cooling Tower Modeling Schema of the model built in TRNSYS Water at 51°F Ambient air Relative Humidity 50% Wet bulb temperature varies Description Number of cells Inlet water flow rate per cell Air flow rate per cell Concrete CT 3 6, 000 gpm 497, 012 cfm Metal CT 9 2, 567 gpm 250, 100 cfm
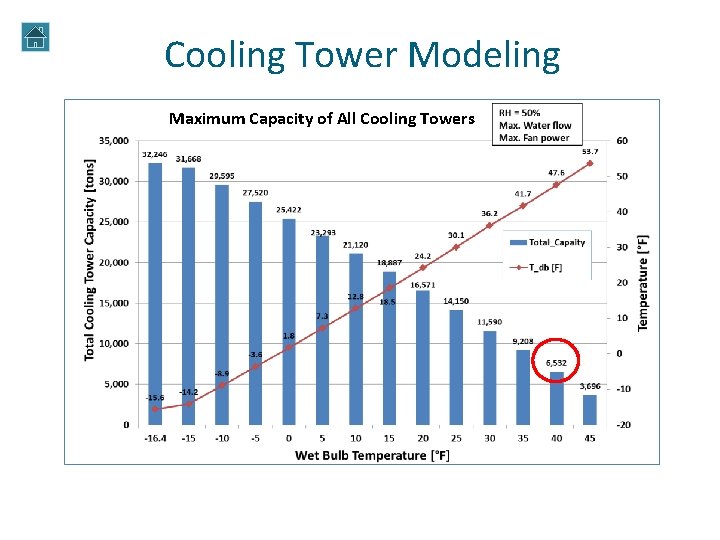
Cooling Tower Modeling Maximum Capacity of All Cooling Towers
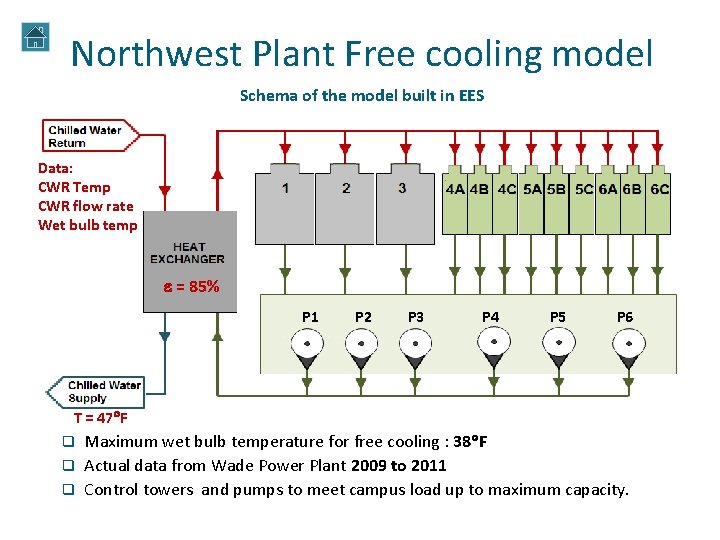
Northwest Plant Free cooling model Schema of the model built in EES Data: CWR Temp CWR flow rate Wet bulb temp e = 85% P 1 P 2 P 3 P 4 P 5 P 6 T = 47 F Maximum wet bulb temperature for free cooling : 38 F q Actual data from Wade Power Plant 2009 to 2011 q Control towers and pumps to meet campus load up to maximum capacity. q
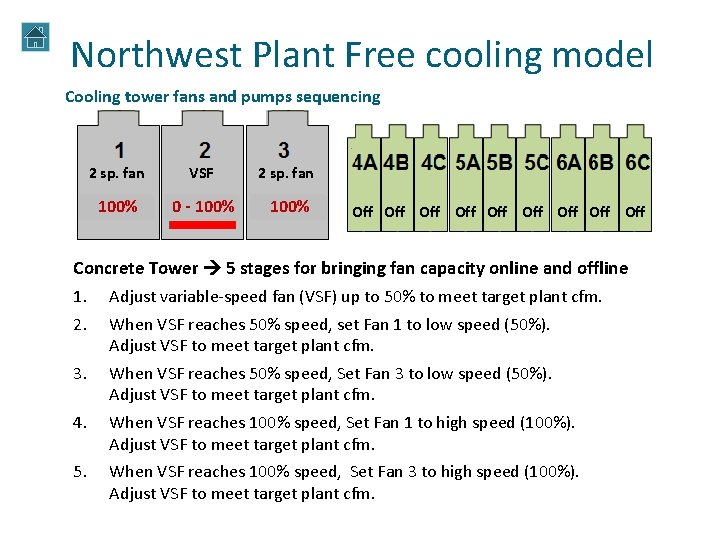
Northwest Plant Free cooling model Cooling tower fans and pumps sequencing 2 sp. fan VSF 2 sp. fan Off 100% 50% 00 --Off 100% 50% Off 50% 100% Off Off Off Concrete Tower 5 stages for bringing fan capacity online and offline 1. Adjust variable-speed fan (VSF) up to 50% to meet target plant cfm. 2. When VSF reaches 50% speed, set Fan 1 to low speed (50%). Adjust VSF to meet target plant cfm. 3. When VSF reaches 50% speed, Set Fan 3 to low speed (50%). Adjust VSF to meet target plant cfm. 4. When VSF reaches 100% speed, Set Fan 1 to high speed (100%). Adjust VSF to meet target plant cfm. 5. When VSF reaches 100% speed, Set Fan 3 to high speed (100%). Adjust VSF to meet target plant cfm.
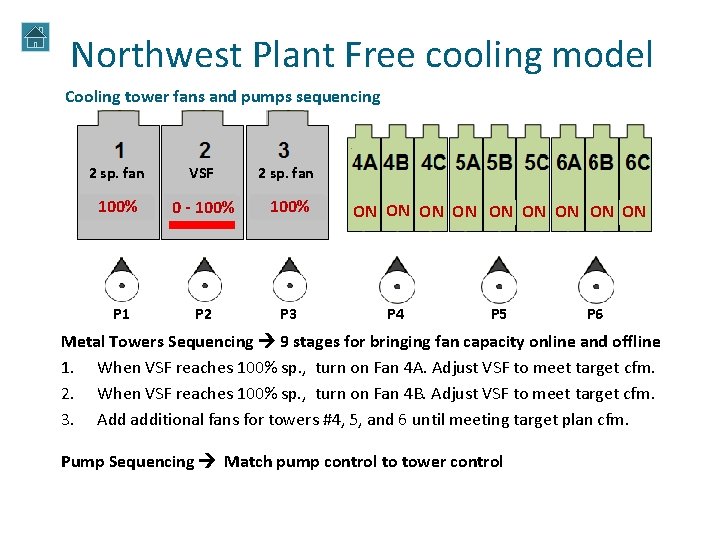
Northwest Plant Free cooling model Cooling tower fans and pumps sequencing 2 sp. fan VSF 2 sp. fan Off 100% 0 -Off 100% P 1 P 2 P 3 ON Off ON ON ON Off Off P 4 P 5 P 6 Metal Towers Sequencing 9 stages for bringing fan capacity online and offline 1. When VSF reaches 100% sp. , turn on Fan 4 A. Adjust VSF to meet target cfm. 2. When VSF reaches 100% sp. , turn on Fan 4 B. Adjust VSF to meet target cfm. 3. Add additional fans for towers #4, 5, and 6 until meeting target plan cfm. Pump Sequencing Match pump control to tower control
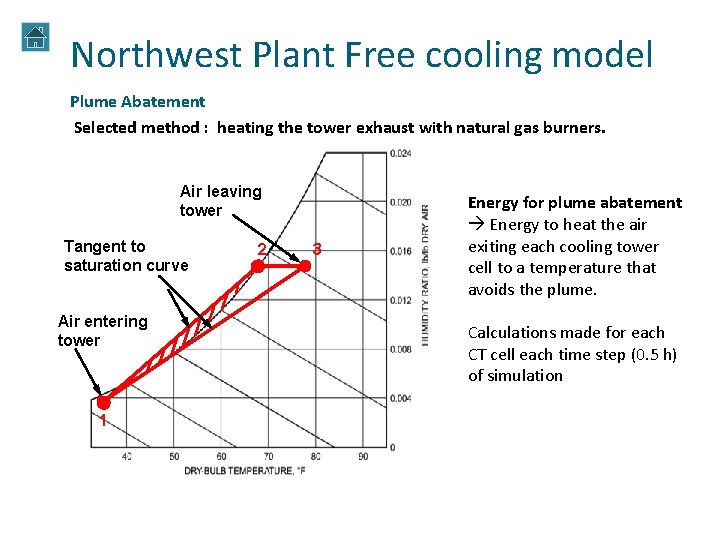
Northwest Plant Free cooling model Plume Abatement Selected method : heating the tower exhaust with natural gas burners. Air leaving tower Tangent to Indicates fog saturation curve will form Air entering tower 1 2 3 Energy for plume abatement Energy to heat the air exiting each cooling tower cell to a temperature that avoids the plume. Calculations made for each CT cell each time step (0. 5 h) of simulation
Results q Free cooling performance with all cooling towers q Free cooling performance with concrete cooling tower only q Economic comparison
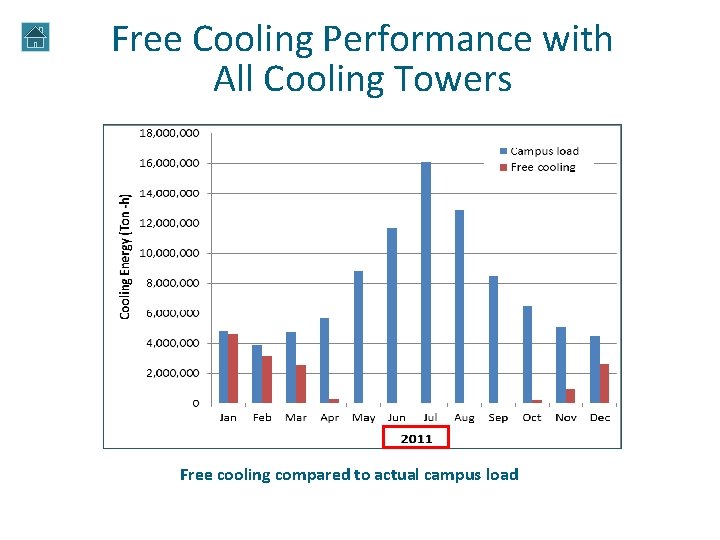
Free Cooling Performance with All Cooling Towers Free cooling compared to actual campus load
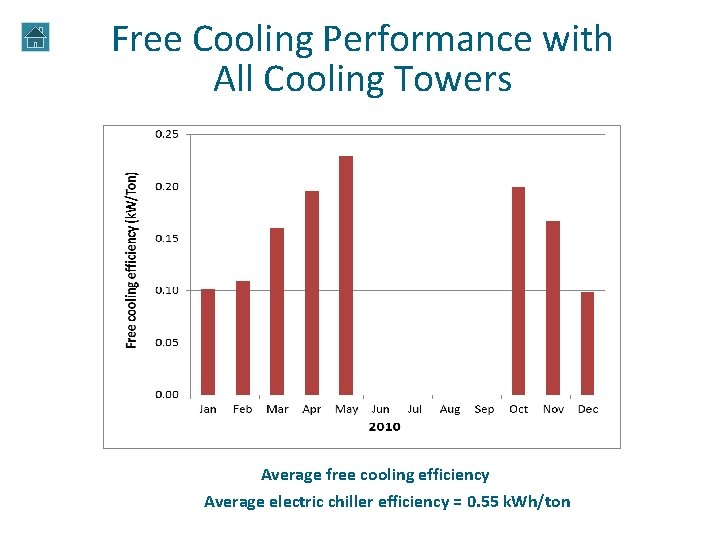
Free Cooling Performance with All Cooling Towers Average free cooling efficiency Average electric chiller efficiency = 0. 55 k. Wh/ton
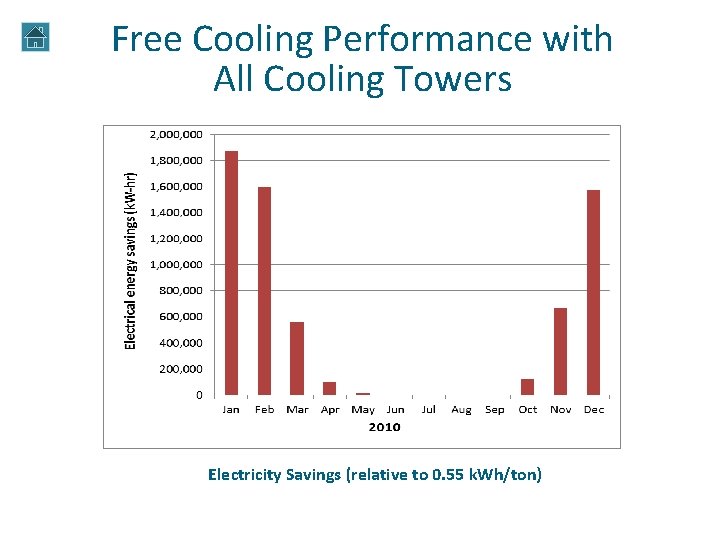
Free Cooling Performance with All Cooling Towers Electricity Savings (relative to 0. 55 k. Wh/ton)
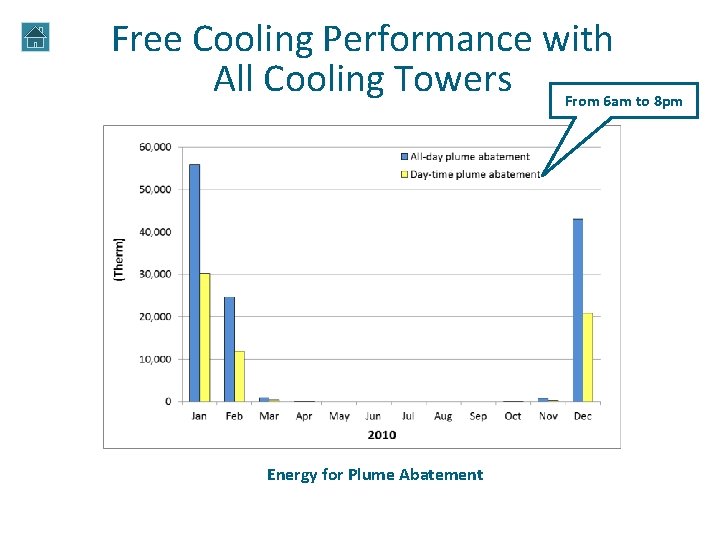
Free Cooling Performance with All Cooling Towers From 6 am to 8 pm Energy for Plume Abatement
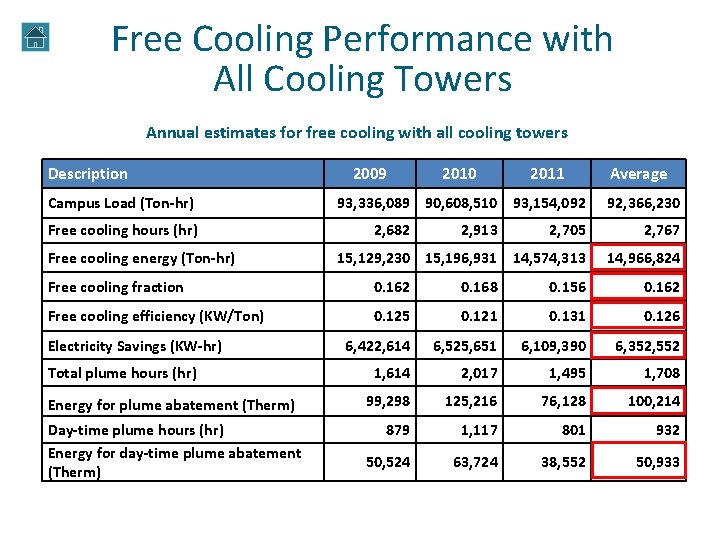
Free Cooling Performance with All Cooling Towers Annual estimates for free cooling with all cooling towers Description Campus Load (Ton-hr) Free cooling hours (hr) Free cooling energy (Ton-hr) 2009 2010 2011 93, 336, 089 90, 608, 510 93, 154, 092 2, 682 2, 913 Average 92, 366, 230 2, 705 2, 767 15, 129, 230 15, 196, 931 14, 574, 313 14, 966, 824 Free cooling fraction 0. 162 0. 168 0. 156 0. 162 Free cooling efficiency (KW/Ton) 0. 125 0. 121 0. 131 0. 126 6, 422, 614 6, 525, 651 6, 109, 390 6, 352, 552 1, 614 2, 017 1, 495 1, 708 99, 298 125, 216 76, 128 100, 214 879 1, 117 801 932 50, 524 63, 724 38, 552 50, 933 Electricity Savings (KW-hr) Total plume hours (hr) Energy for plume abatement (Therm) Day-time plume hours (hr) Energy for day-time plume abatement (Therm)
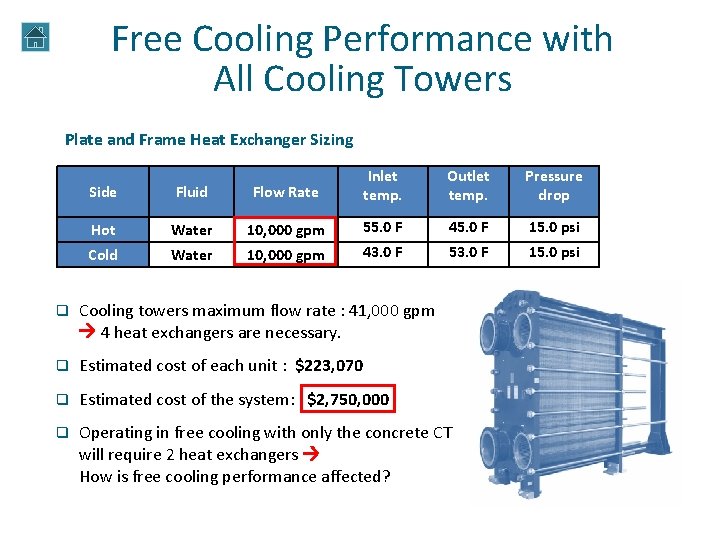
Free Cooling Performance with All Cooling Towers Plate and Frame Heat Exchanger Sizing Side Fluid Flow Rate Inlet temp. Outlet temp. Pressure drop Hot Water 10, 000 gpm 55. 0 F 45. 0 F 15. 0 psi Cold Water 10, 000 gpm 43. 0 F 53. 0 F 15. 0 psi q Cooling towers maximum flow rate : 41, 000 gpm 4 heat exchangers are necessary. q Estimated cost of each unit : $223, 070 q Estimated cost of the system: $2, 750, 000 q Operating in free cooling with only the concrete CT will require 2 heat exchangers How is free cooling performance affected?
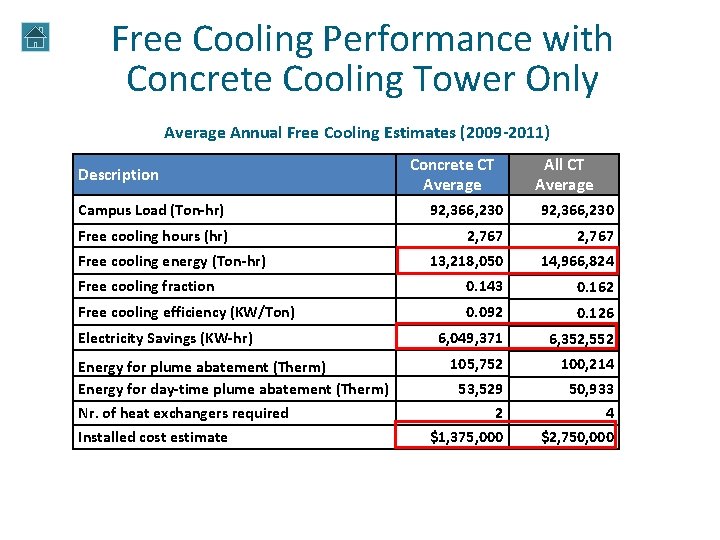
Free Cooling Performance with Concrete Cooling Tower Only Average Annual Free Cooling Estimates (2009 -2011) Description Concrete CT Average All CT Average Campus Load (Ton-hr) 92, 366, 230 Free cooling hours (hr) 2, 767 13, 218, 050 14, 966, 824 Free cooling fraction 0. 143 0. 162 Free cooling efficiency (KW/Ton) 0. 092 0. 126 6, 049, 371 6, 352, 552 105, 752 100, 214 53, 529 50, 933 4 Free cooling energy (Ton-hr) Electricity Savings (KW-hr) Energy for plume abatement (Therm) Energy for day-time plume abatement (Therm) Nr. of heat exchangers required Installed cost estimate 2 $1, 375, 000 $2, 750, 000
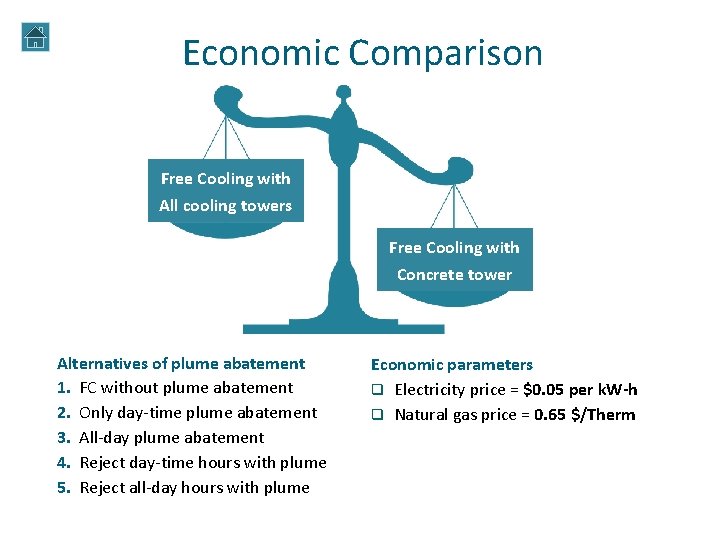
Economic Comparison Free Cooling with All cooling towers Free Cooling with Concrete tower Alternatives of plume abatement 1. FC without plume abatement 2. Only day-time plume abatement 3. All-day plume abatement 4. Reject day-time hours with plume 5. Reject all-day hours with plume Economic parameters q Electricity price = $0. 05 per k. W-h q Natural gas price = 0. 65 $/Therm
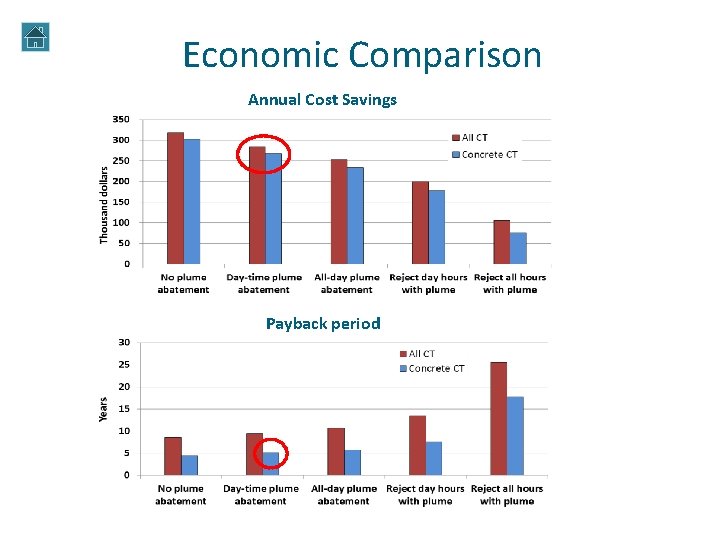
Economic Comparison Annual Cost Savings Payback period
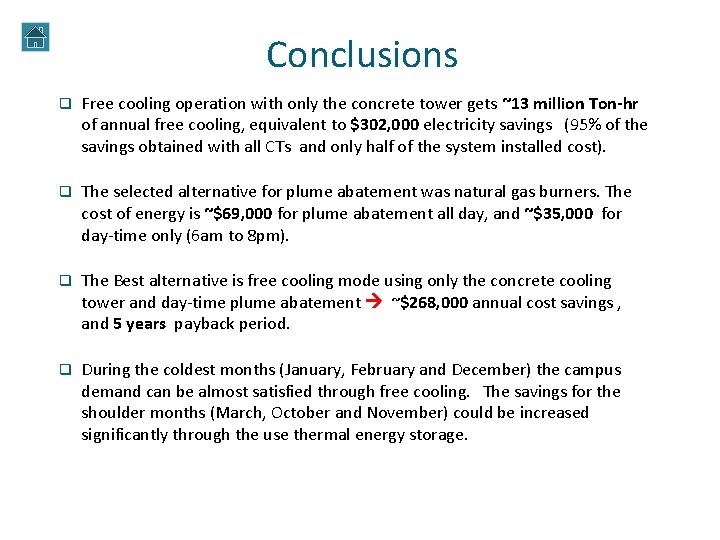
Conclusions q Free cooling operation with only the concrete tower gets ~13 million Ton-hr of annual free cooling, equivalent to $302, 000 electricity savings (95% of the savings obtained with all CTs and only half of the system installed cost). q The selected alternative for plume abatement was natural gas burners. The cost of energy is ~$69, 000 for plume abatement all day, and ~$35, 000 for day-time only (6 am to 8 pm). q The Best alternative is free cooling mode using only the concrete cooling tower and day-time plume abatement ~$268, 000 annual cost savings , and 5 years payback period. q During the coldest months (January, February and December) the campus demand can be almost satisfied through free cooling. The savings for the shoulder months (March, October and November) could be increased significantly through the use thermal energy storage.
Next Steps… q More accurate estimation of installed cost of the system. q Design system to control campus chilled water flow into the system, so maximum flow and cooling capacity are not exceeded. q Consider application of thermal storage.