Fred Li 2009 Data Record Fred Li 2009


 或 N(母群)表示 • 例如: n = 231 • Cases")


 Skewness Non-mean based measure Mode, median")


 quantitative variable 學費 < $9, 000 > $9, 000 市立 36")
 quantitative variable 學費 < $9, 000 > $9, 000 Total qualitative")

- Slides: 70
抽樣&推論 Fred Li, 2009
Data Record Fred Li, 2009
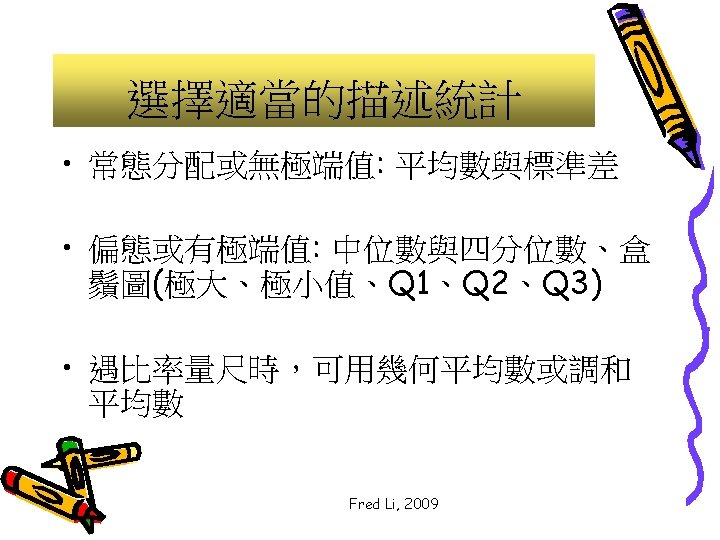
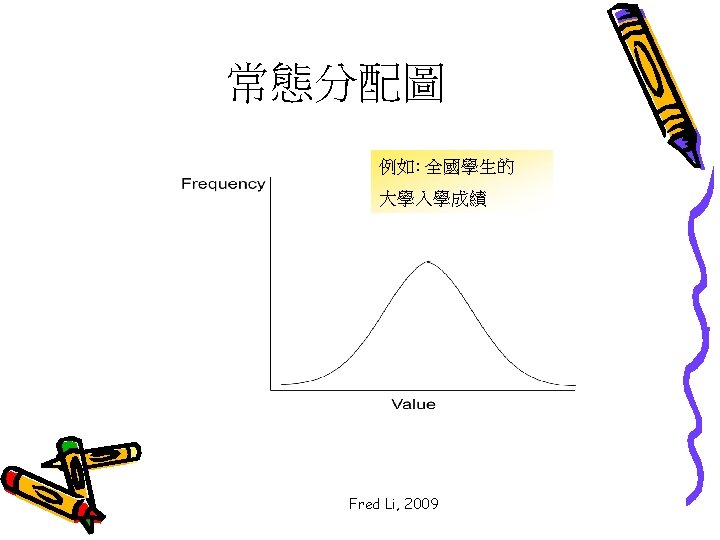
常態分配曲線 • 為一典型的分數分配曲線 – Majority of cases distributed around the peak in the middle – Progressively fewer cases moving away form the middle – Symmetrical – one side mirrors the other – Mean, median, and mode have the same value Fred Li, 2009
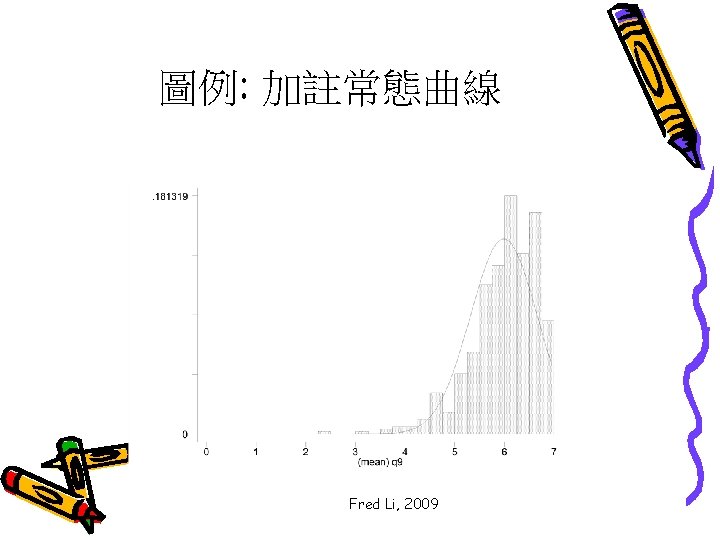
常態曲線 Fred Li, 2009
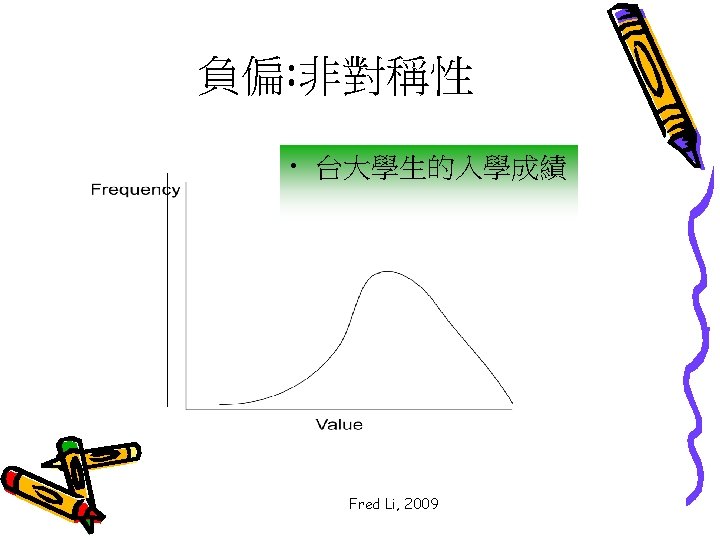
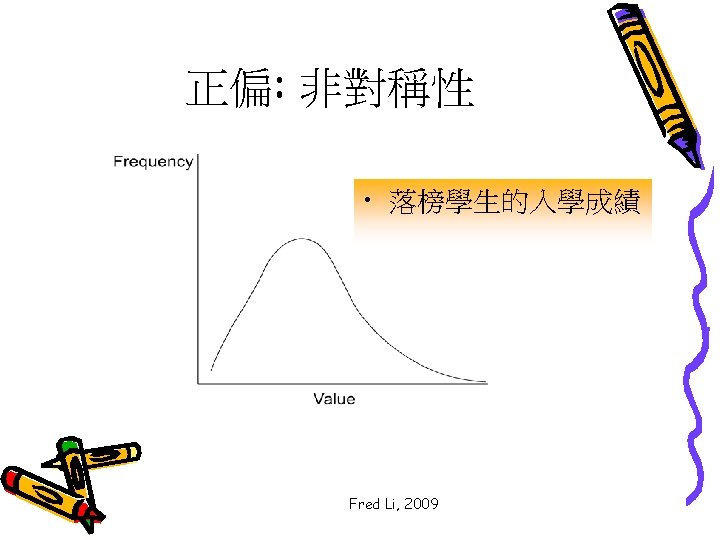
Skewed Distributions • 非對稱性 正偏 負偏 Fred Li, 2009
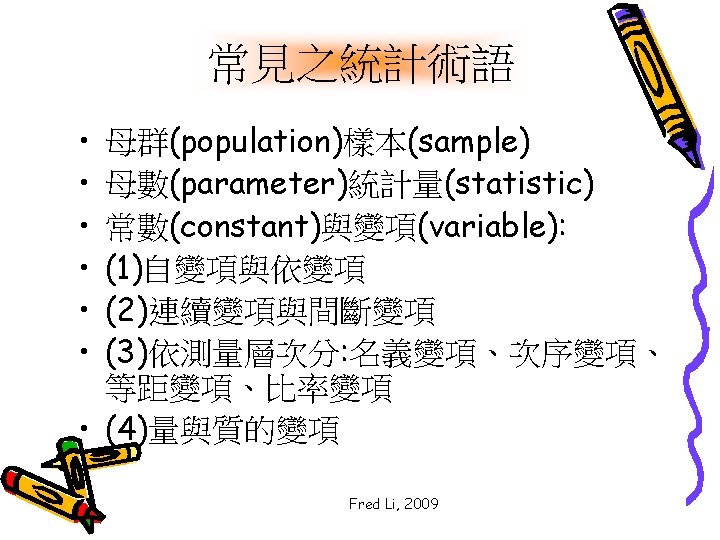
個案人數 • 以 n (樣本) 或 N(母群)表示 • 例如: n = 231 • Cases may be people, speaking turns, episodes Fred Li, 2009
集中量數 • Mean – Arithmetic mean or average – Most sensitive to extreme scores • Median – Middle of all scores on one variable • Mode – Score or scores that appear most often Fred Li, 2009
離散量數 • Describes the variability or spread of scores • Should be reported with mean • Range – Highest to lowest score • Standard deviation or sd – If sd = 0, all scores are the same – Larger the sd, the more the scores differ from the mean Fred Li, 2009
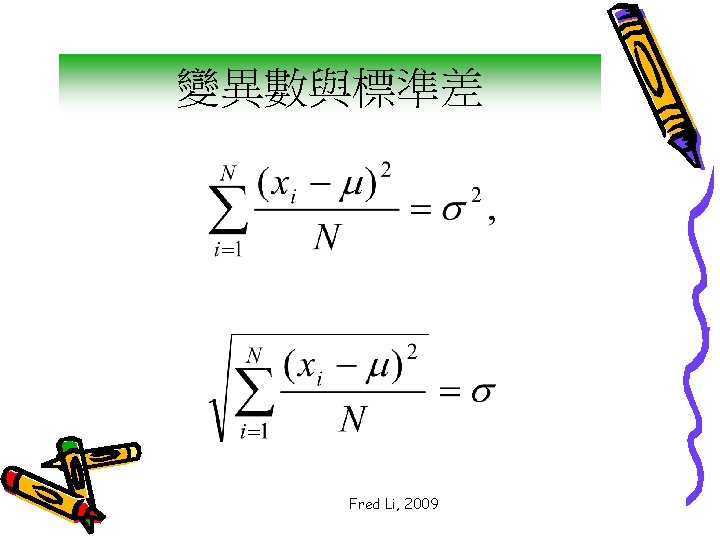
Standard Deviation Fred Li, 2009
標準差的特性 • Theoretical normal curve is divided into equal standards • The more normal a distribution of scores, the more this theoretical property applies • 68. 26% of scores fall within +1 to – 1 standards Fred Li, 2009
變項種類 Fred Li, 2009
不同資料的描述 Moment Center Spread Mean Variance (standard deviation) Skewness Non-mean based measure Mode, median Range, Interquartile range -- Peaked Kurtosis -- Fred Li, 2009
平均數 Fred Li, 2009
變異數係數 Fred Li, 2009
偏態: Skewness Fred Li, 2009
Skewness Fred Li, 2009
峰度: Kurtosis Fred Li, 2009
常態屬性 • Skewness = 0 • Kurtosis = 3 Fred Li, 2009
常態屬性 Fred Li, 2009
教 學評鑑 Mean s. d. Skew Kurt Gives well-prepared, relevant presentations 6. 0 0. 6 9 -1. 7 8. 5 Explains clearly and answers questions well 5. 9 0. 6 8 -1. 0 4. 8 Uses visual aids well 5. 6 0. 8 5 -1. 8 8. 9 Uses information technology effectively 5. 5 0. 9 1 -1. 1 5. 0 Speaks well 6. 1 0. 6 9 -1. 5 6. 8 Encourages questions & class participation 6. 1 0. 6 6 -0. 88 3. 7 Stimulates interest in the subject 5. 9 0. 7 6 -1. 1 4. 7 Is available outside of class for 5. 9 questions 0. 6 8 -1. 3 6. 3 Fred Li, 2009
圖例 教學評建立提示意圖 Mea n s. d. Skew Ku rt Uses visual aids well 5. 6 0. 85 -1. 8 Encourages questions & class participation 6. 1 0. 66 3. 7 0. 88 8. 9 Fred Li, 2009 Graph
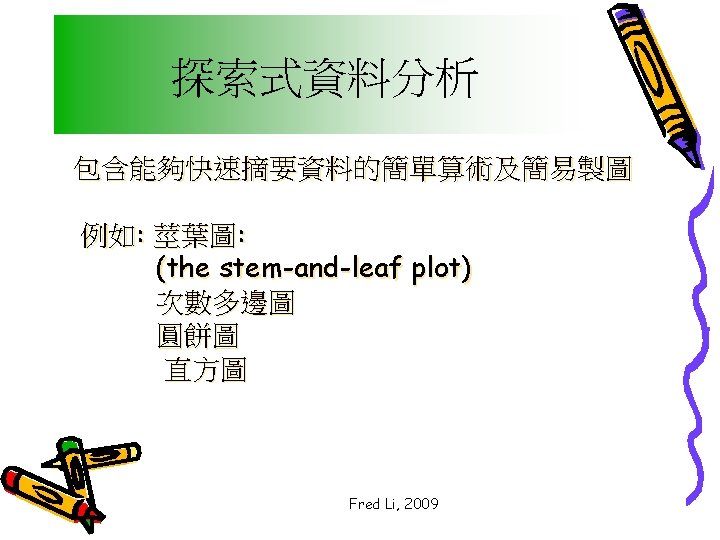
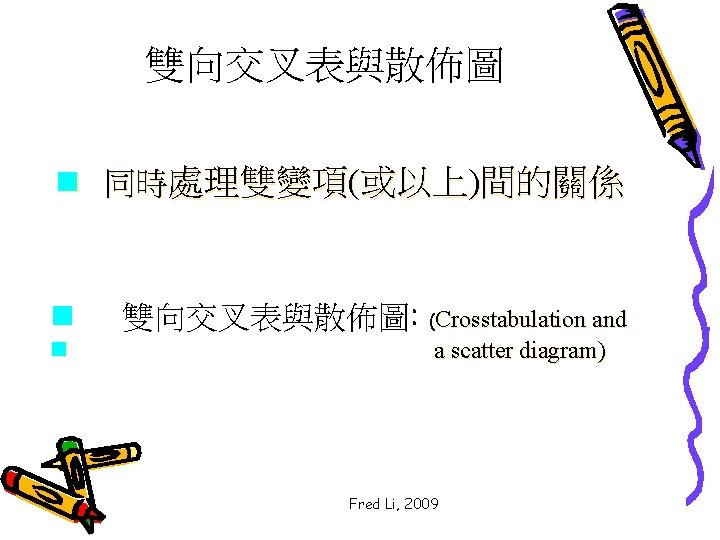
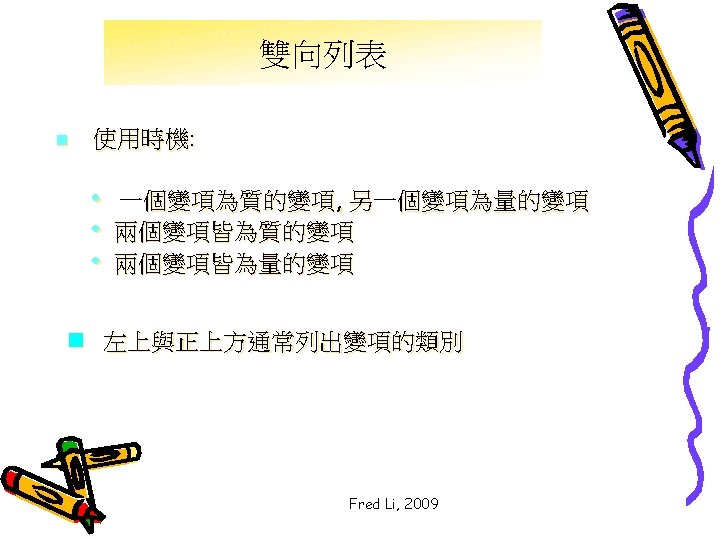
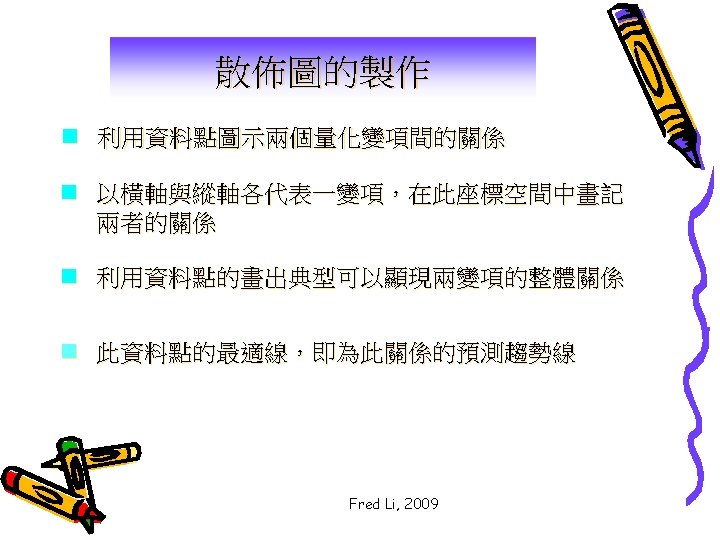
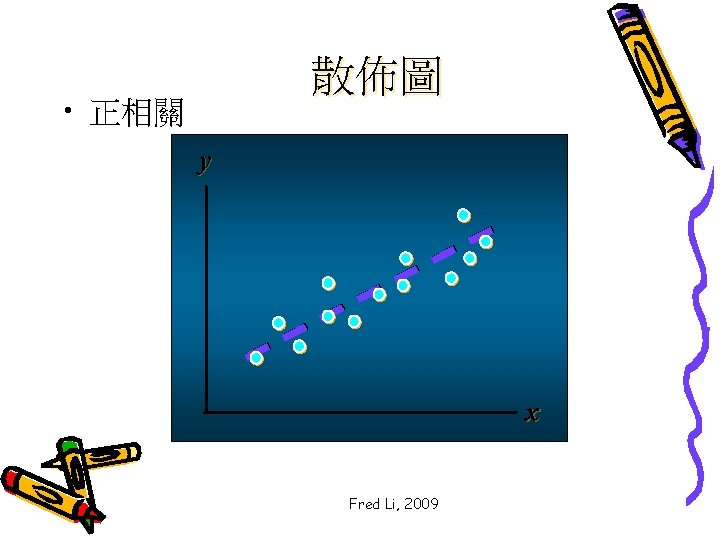
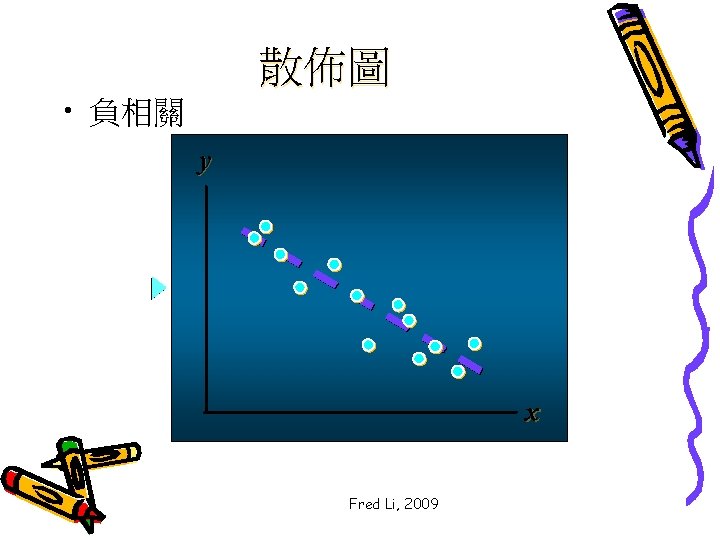
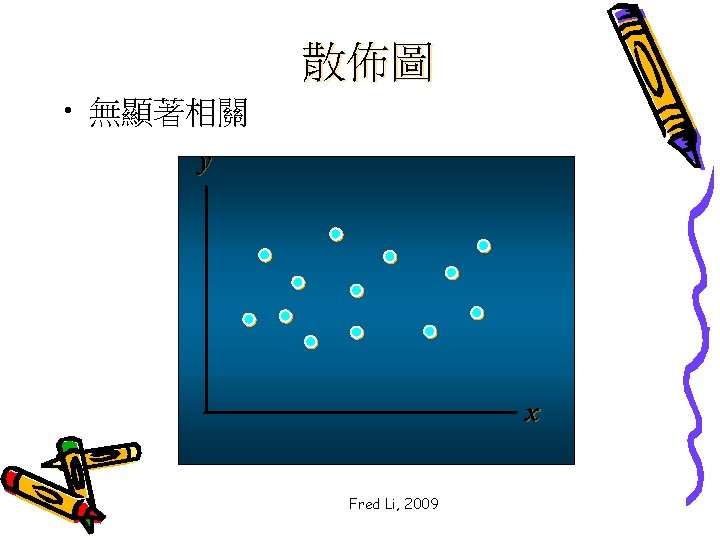
圖表法: Tabular and Graphical Methods. n n 探索式資料分析 交叉表與散佈圖 y x Fred Li, 2009
Data Qualitative Data Quantitative Data Tabular Methods Graphical Methods Tabular Methods • Frequency Distribution • Rel. Freq. Dist. • Percent Freq. Distribution • Crosstabulation • Bar Graph • Pie Chart • Frequency Distribution • Rel. Freq. Dist. • Cum. Rel. Freq. Distribution • Stem-and-Leaf Display • Crosstabulation Fred Li, 2009 Graphical Methods • Histogram • Ogive • Scatter Diagram
莖葉圖的製作 n 莖葉圖可以顯示資料的次序關係與分配型態 n 可保留原始資料值 n The first digits of each data item are arranged to the left of a vertical line. n To the right of the vertical line we record the last digit for each item in rank order. n Each line in the display is referred to as a stem. n Each digit on a stem is a leaf. Fred Li, 2009
莖葉圖 5 6 7 8 9 10 2 2 1 0 1 1 a stem 7 2 1 0 3 4 2 2 2 7 5 2 2 3 7 5 5 3 5 7 9 6 4 8 8 7 8 8 8 9 9 9 4 5 5 5 6 7 8 9 9 9 a leaf Fred Li, 2009
Stretched 莖葉圖 n If we believe the original stem-and-leaf display has condensed the data too much, we can stretch the display by using two stems for each leading digit(s). n Whenever a stem value is stated twice, the first value corresponds to leaf values of 0 - 4, and the second value corresponds to leaf values of 5 - 9. Fred Li, 2009
Stretched 莖葉圖 5 5 6 6 7 7 8 8 9 9 10 10 2 7 2 5 1 5 0 5 1 7 1 5 2 6 1 5 0 8 3 7 4 5 2 7 2 5 2 9 2 8 2 6 3 8 3 7 8 4 8 9 9 9 4 9 9 9 7 8 9 9 Fred Li, 2009
Stretched 莖葉圖 n Leaf Units • A single digit is used to define each leaf. • In the preceding example, the leaf unit was 1. • Leaf units may be 100, 1, 0. 1, and so on. • Where the leaf unit is not shown, it is assumed to equal 1. Fred Li, 2009
Leaf Unit = 0. 1 8. 6 11. 7 9. 4 9. 1 10. 2 Leaf Unit = 0. 1 8 6 8 9 1 4 10 2 11 0 7 Fred Li, 2009 11. 0 8. 8
Leaf Unit = 10 1806 1717 1974 1791 1682 1910 1838 Leaf Unit = 10 16 8 17 1 9 18 0 3 19 1 7 Fred Li, 2009 The 82 in 1682 is rounded down to 80 and is represented as an 8.
實例: 國中生每學期的學費 quantitative variable 學費 < $9, 000 > $9, 000 Total 市立 qualitative variable 學校類別 私立 綜合 縣立 Total 18 12 1 19 19 16 12 3 50 30 20 35 15 100 Fred Li, 2009 50
實例: 國中生每學期的學費: 列百分比(%) quantitative variable 學費 < $9, 000 > $9, 000 市立 36 24 qualitative variable 學校類別 私立 綜合 2 38 38 32 Fred Li, 2009 縣立 24 6 Total 100
實例: 國中生每學期的學費: 行百分比(%) quantitative variable 學費 < $9, 000 > $9, 000 Total qualitative variable 市立 學校類別 私立 綜合 60 40 5 95 54. 29 45. 71 80 20 100 100 Fred Li, 2009 縣立
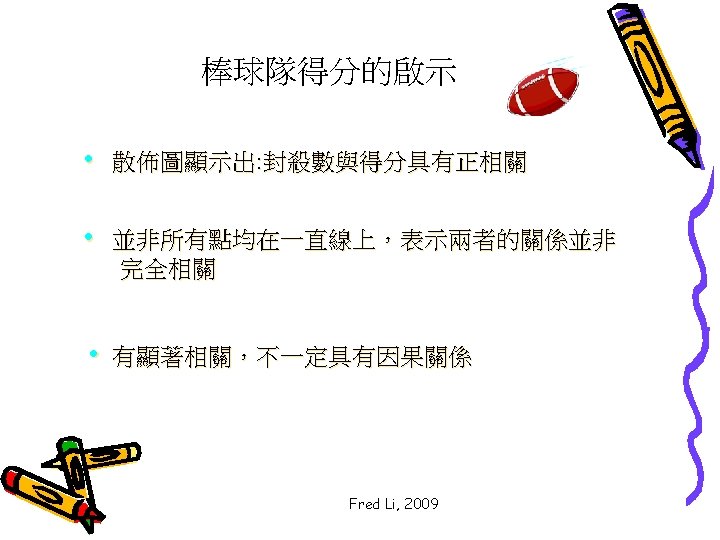
散佈圖 y 得分數 35 30 25 20 15 10 5 0 x 0 1 2 封殺數 Fred Li, 2009 3 4