FRAILTY you said FRAILTY What is it Donata


 Donata Kurpas, Maria Magdalena")
 -")


 Comprehensive therapy")


 post-secondary) High (higher)")
 26")

 Group G 1 diet G 2 physical activity G")
 Group G 1 diet G 2 physical activity G")


 Group G 1 diet G 2")
 Group G 1 diet G 3 (G 1+G 2) G 4")
 Group G 1 diet G 2 physical activity G 3 (G")


 T 2 G 1 diet")


")


 • three parts: 1. balance (three positions) 2.")
 1. 2. 3. 4. 5. Weight loss Weakness")


 Gait speed")

- Slides: 59
FRAILTY, you said FRAILTY ? What is it ? • Donata Kurpas • Jose Augusto Simoes • Jean-Baptiste Kern • Jean-Pierre Jacquet
• Frailty, is a disturbing term for GPs, because it doesn't cover a disease or an illness even a syndrome, but this term try to define patients with clinical , social and environmental situation at risk of dependency but not only. • It's probably why different ways exists. • and it is what we will explore during this workshop.
• For this purpose we will present to you a short description of a research project in progress "My. Little. Spa" and the huge experience of Pr Donata Kurpas. • Thus we will share our experiences and informatin to take home to help ourselves, our patients and the community
MLSPA is a co-designed system focusing on the rural European elderly and frailty population. The project aims to develop a remote connected device with an interactive vocal personal assistant that provides a panel of social/medical services for frailty population in Portugal and in France. The global objective is to create a new solution improving their life quality, their self-autonomy and their integration with the surrounding community.
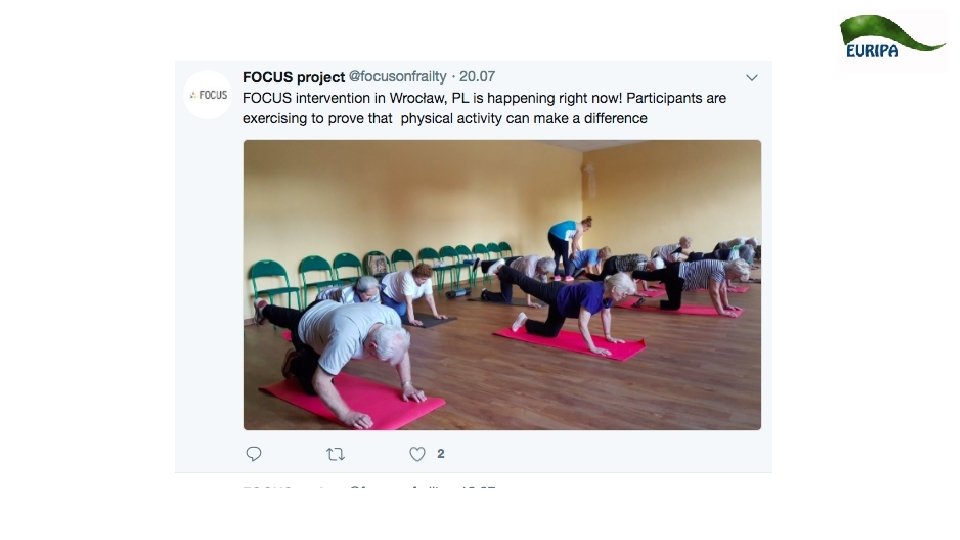
Interventions in Frailty – WMU, Poland (Clinical. Trials NCT 03194412) Donata Kurpas, Maria Magdalena Bujnowska. Fedak, Aneta Soll, Katarzyna Szwamel Wroclaw Medical University, Poland
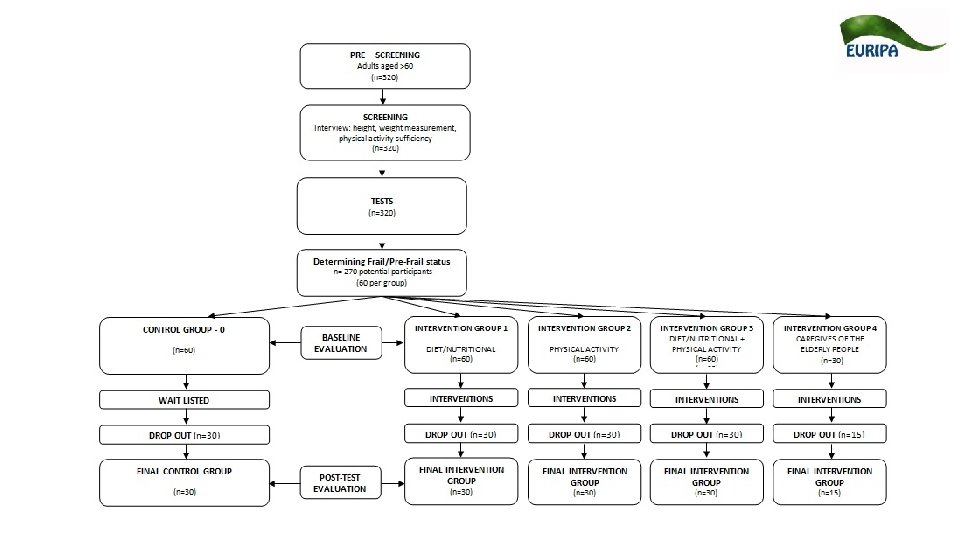
Interventions WMU Study Starts: May 19, 2017 - SYMPOSIUM Screening Evaluation (stage 1) - investigated within 0 Primary Completion: September 2017 Baseline Evaluation (stage 2) - after 3 months from 0 Study Completion: December 2017 Final Evaluation (stage 3) - after 6 months from 0
Inclusion criteria q Patient: • age ≥ 60 years old • recognition of the pre-frail and frail (based on the scale of the Cardiovascular Health Study) • consent to participate in the study • patients who can speak the Polish language q Caregivers: • formal or informal caregivers of person aged ≥ 60 years old • consent to participate in the study • caregivers who can speak the Polish language
Methods • Method: – diagnostic survey • Technique: – the 'surveys combined with direct measurements of patients investigated within 0, after 3 and 6 months
Methods - Tools • Standardized questionnaires: – Center for Epidemiologic Studies Depression Scale – Minnesota Leisure Time Physical Activity Questionnaire – Vulnerable Elders — 13 Survey – Mini Nutritional Assessment – Health Behaviour Inventory – Montreal Cognitive Assessment – Geriatric Depression Scale – World Health Organization Quality of Life (short version) questionnaire – Camberwell Assessment of Need Short Appraisal Schedule – Barthel Scale – Activities of Daily Living – Instrumental Activities of Daily Living – Timed up and go test – Beck Depression Inventory
Methods - Tools • The questionnaire on: socio-demographic data - age, gender, marital status, living in relationship/ without relationship, level of education, place of residence, economic status; the number of hospitalizations in the last 3 years (including kind of ward); the number and kind of chronic diseases (ICD-10); the number of permanent medications; employment situation; number of traveling in the last year; having pets; number of languages the participants can speak; number of falls • Rating of patients' difficulties in the implementation of the intervention (Did the patients perform the interventions? How often? Was it difficult to the patients? ) • Observations sheet: height, weight, BMI, hand grip strength, circumference of arm muscle, circumference of calf • The available results of laboratory tests: sodium , albumins, lymphocytes, LDL cholesterol, C reactive proteins, glomerular filtration rate, fasting glucose, thyroid hormones, etc.
Group 1. Diet /nutritional 1. Each patient collect a detailed menu of the last two days before making the description. 2. Menu is analyzed by a nutrition consultant. The role of nutrition consultant is: ü to make a diet modification and include the products recommended in frailty ü focus on eating habits 3. The diet modification is mainly focused on adequate supply: ü protein according to European Society for Clinical Nutrition and Metabolism (ESPEN recommendations) ü vitamin D (according to Central Europe guidelines -2013 for seniors)
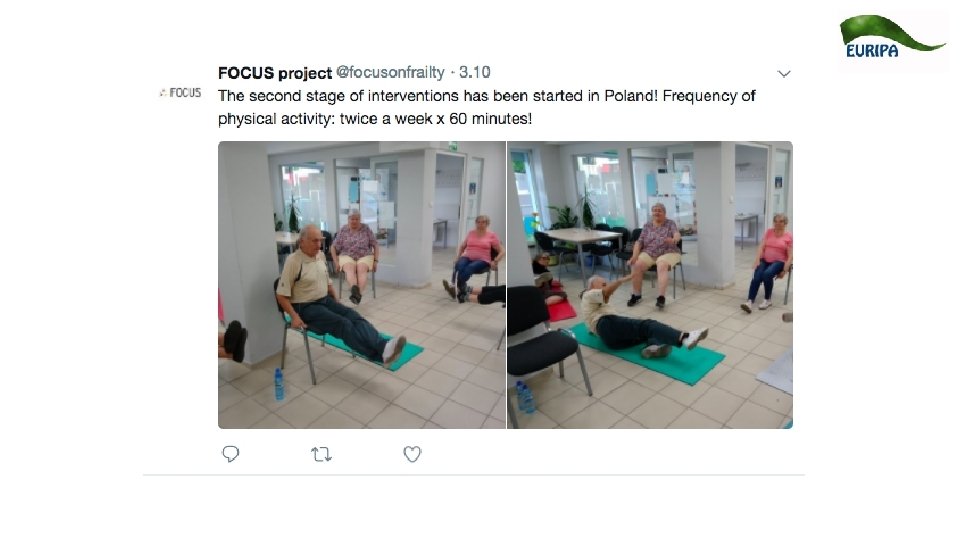
Group 2. Physical activity 1. Frequency: twice a week x 60 minutes 2. Worksheets for the elderly with frailty syndrome have been developed: q resistance exercises and strength training, with the purpose to improve muscle strength in the limbs q exercises designed to improve motor coordination, flexibility and speed q stretching exercises 3. The program has been developed by a physiotherapist q workouts are held twice a week for 60 minutes and are conducted by volunteers trained by the author of the exercises q patients receive a set of exercises and should practice at home: v written exercises were prepared for patients (type of exercise, detailed description of performance, number of repetitions) v instructional video on DVD and available online
Group 3. Comprehensive therapy Special diet for elderly (as in group 1) Comprehensive therapy Regular physical activity in everyday life of the elderly (as in group 2) 1. Duration: ü the first stage - 3 months: 12 weeks ü the second stage - 3 months: 12 weeks 2. Frequency of physical activity: twice a week x 60 minutes
Group 4. Caregivers of elderly 1. Group: formal and informal caregivers of elderly with frailty syndrome 2. Education about frailty: prevention and treatment (nutrition, physical activity, dietary supplement diet) 2. Materials and Tools: multimedia presentation about frailty prevention and treatment (nutrition, physical activity, dietary supplement diet) 3. Duration: ü the first stage - 3 months: 12 weeks ü the second stage - 3 months: 12 weeks 4. Frequency: 1 (at the beginning of stage 0, 1 and 2) x 60 minutes
Group 5. Control group any intervention without group
Our groups - currently Group Description n 1 Diet /nutritional 40 2 Physical activity 42 D&A 34 M 3 Comprehensive therapy 45 4 Caregivers of elderly 23 5 Control group 63 Total 247
Guidelines
Guidelines
Guidelines
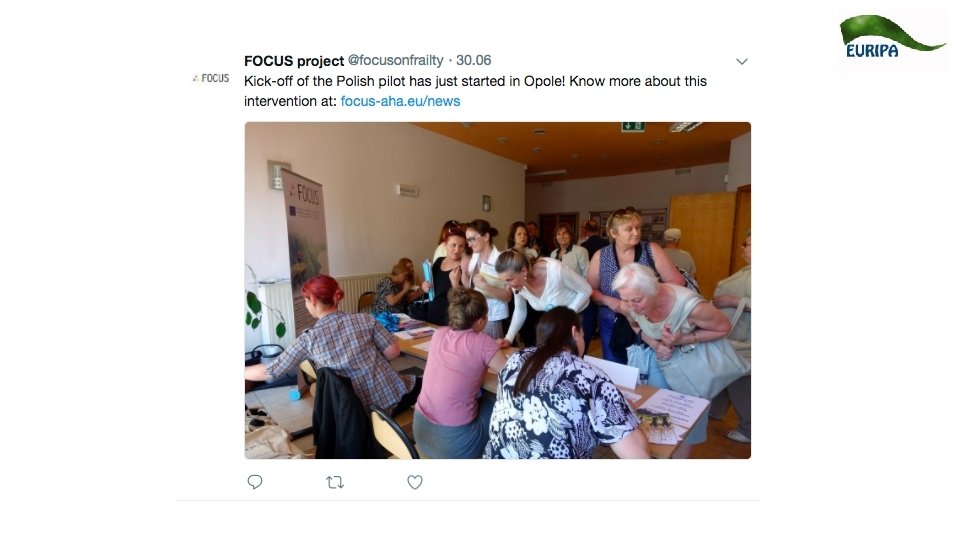
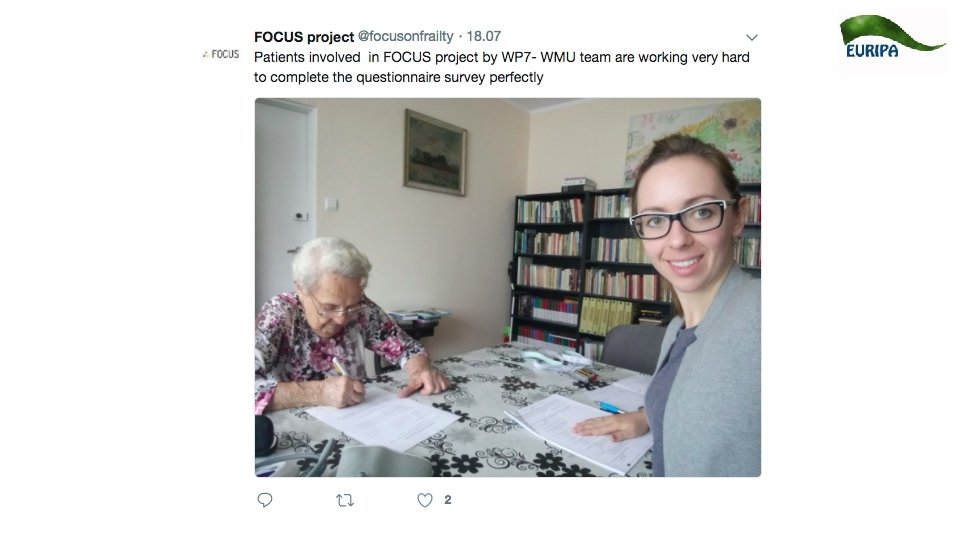
Patients – WMU pilot
Gender and Age GENDER GROUP G 1 diet G 2 physical activity G 3 (G 1+G 2) G 4 caregivers G 5 control Women (n=157) 30 (75. 0%) 26 (61. 9%) 36 (80. 0%) 19 (82. 6%) Men (n=54) 10 (25. 0%) 16 (38. 1%) 9 (20. 0%) 4 (17. 4%) 46 (75. 4%) 15 (24. 6%) AGE mean SD 69. 87 6. 17 69. 38 6. 66 70. 80 6. 09 57. 74 14. 02 79. 13 9. 04
Level of education Low Medium (primary, junior (secondary or high school) post-secondary) High (higher) G 1 diet 12 (30. 0%) 21 (52. 5%) 7 (17. 5%) G 2 physical activity 18 (42. 9%) 16 (38. 1%) 8 (19. 0%) G 3 (G 1+G 2) 16 (35. 6%) 18 (40. 0%) 11 (24. 4%) G 4 caregivers - 13 (59. 1%) 9 (40. 9%) G 5 control 32 (53. 3%) 23 (38. 3%) 5 (8. 3%)
Martial status single married widow /widower divorced G 1 diet 3 (7. 5%) 26 (65. 0%) 11 (27. 5%) - G 2 physical activity 3 (7. 1%) 29 (69. 0%) 9 (21. 4%) 1 (2. 4%) G 3 (G 1+G 2) 3 (6. 7%) 27 (60. 0%) 14 (31. 1) 1 (2. 2%) G 4 caregivers 3 (13. 0%) 16 (69. 6%) 2 (8. 7%) G 5 control 6 (9. 8%) 16 (26. 2%) 36 (59. 0%) 3 (4. 9%)
Place of residence big city average city small city village G 1 diet 4 (10. 3%) 15 (38. 5%) 1 (2. 6%) 19 (48. 7%) G 2 physical activity 4 (9. 5%) 12 (28. 6%) 6 (14. 3%) 20 (47. 6%) G 3 (G 1+G 2) 13 (30. 2%) 7 (16. 3%) 3 (7. 0%) 20 (46. 5%) G 4 caregivers - 16 (69. 6%) 6 (26. 1%) 1 (4. 3%) G 5 control 10 (17. 2%) 13 (22. 4%) - 35 (60. 3%)
Right hand grip strenght (kg) Group G 1 diet G 2 physical activity G 3 (G 1+G 2) G 5 control T 0 T 1 T 2 Mean/SD (N) 19. 51/8. 62 19. 71/7. 9 21. 05/6. 54 (40) (34) (23) 17. 80/6. 15 17. 94/5. 86 20. 08/4. 70 (42) (35) (26) 16. 45/6. 26 17. 02/4. 33 16. 95/3. 57 (45) (33) (31) 14. 53/7. 56 12. 45/6. 08 14. 07/5. 64 (61) (38) p 0. 271 0. 216 0. 188 0. 238
Left hand grip strenght (kg) Group G 1 diet G 2 physical activity G 3 (G 1+G 2) G 5 control T 0 T 1 T 2 Mean/SD (N) 18. 53/7. 89 17. 53/6. 07 18. 56/6. 07 (40) (35) (23) 17. 99/6. 05 16. 67/4. 26 17. 82/3. 94 (6. 15) (35) (26) 14. 66/5. 88 14. 52/3. 70 14. 77/3. 56 (45) (33) (31) 14. 45/7. 58 10. 94/5. 69 12. 71/4. 40 (61) (38) p 0. 632 0. 445 0. 941 0. 029
CES-D Center for Epidemiologic Studies Depression Scale Group G 1 diet G 2 physical activity G 3 (G 1+G 2) G 5 control T 0 T 1 T 2 p Mean/SD (N) 17. 29/8. 20 18. 26/8. 07 18. 79/7. 06 0. 528 (28) (27) (19) 17. 53/7. 93 17. 27/6. 88 16. 83/4. 67 0. 938 (38) (33) (24) 20. 11/6. 94 17. 19/6. 65 20. 07/5. 84 0. 215 (35) (27) (28) 20. 88/8. 42 23. 35/9. 27 19. 90/5. 42 0. 192 (52) (51) (30)
MOCA - Montreal Cognitive Assessment Group G 1 diet G 2 physical activity G 3 (G 1+G 2) G 5 control T 0 T 1 T 2 p Mean/SD (N) 23. 34/3. 81 24. 28/4. 02 24. 68/2. 42 0. 254 (38) (32) (22) 23. 67/3. 48 23. 88/4. 30 26. 23/2. 75 0. 005 (42) (35) (26) 22. 20/4. 35 23. 64/3. 64 24. 09/2. 67 0. 167 (45) (33) (32) 16. 25/5. 97 17. 36/6. 89 20. 54/5. 91 0. 006 (61) (37)
GDS - Geriatric Depression Scale Group G 1 diet G 2 physical activity G 3 (G 1+G 2) G 5 control T 0 T 1 T 2 Mean/SD (N) 7. 88/6. 03 7. 81/6. 63 7. 65/5. 37 (40) (36) (23) 9. 19/6. 39 6. 83/5. 12 5. 96/5. 70 (42) (35) (26) 12. 42/7. 02 9. 79/7. 30 9. 44/5. 72 (45) (33) (32) p 0. 965 0. 041 0. 120 14. 52/7. 25 13. 77/6. 76 11. 20/6. 05 0. 061 (61) (62) (40)
TUG - Timed up and go test (seconds) Group G 1 diet G 2 physical activity G 3 (G 1+G 2) G 5 control T 0 T 1 T 2 p Mean/SD (N) 8. 51/2. 60 10. 75/5. 25 9. 84/2. 59 0. 223 (9) (35) (23) 11. 90/3. 07 10. 55/4. 17 10. 84/3. 16 0. 283 (13) (34) (26) 11. 52/3. 63 10. 69/3. 71 9. 38/3. 67 0. 001 (20) (32) 15. 60/9. 44 16. 31/11. 52 16. 79/9. 40 0. 728 (25) (50) (32)
Pro-healthy behaviours (sum) Group G 1 diet G 3 (G 1+G 2) G 4 G 5 control T 0 T 1 T 2 p Mean/SD (N) 91. 34/12. 8 92. 33/7. 6 91. 73/5. 96 0. 970 (35) (27) (15) 86. 78/9. 99( 95. 30/5. 65 95. 72/7. 93( 0. 001 41) (20) 18) 86. 14/13. 4( 87. 27/15. 3 97. 0/NA (1) 0. 642 22) (15) 87. 29/14. 5 88. 84/12. 9( 90. 10/13. 5( 0. 743 (52) 49) 21)
CANSAS (Camberwell index) Group G 1 diet G 2 physical activity G 3 (G 1+G 2) G 4 G 5 control T 0 0. 86/0. 14 (40) 0. 84/0. 13 (42) 0. 80/0. 15 (45) 0. 85/0. 10 (23) T 1 Mean/SD (N) 0. 85/0. 14 (36) 0. 89/0. 10 (34) 0. 87/0. 11 (32) 0. 87/0. 10 (18) T 2 0. 90/0. 09 (23) 0. 90/0. 09 (26) 0. 85/0. 14 (32) 0. 97/0. 04 (2) 0. 67/0. 19 (60) 0. 70/0. 19 (60) 0. 78/0. 17 (38) p 0. 525 0. 138 0. 143 0. 063 0. 020
Qo. L Physical domain Group G 1 diet G 2 physical activity G 3 (G 1+G 2) G 4 G 5 control T 0 13. 19/3. 15 (40) 13. 58/2. 63 (42) 12. 84/2. 60 (45) 14. 41/2. 86 (23) T 1 Mean/SD (N) 13. 24/2. 59 (36) 13. 99/1. 77 (35) 13. 59/2. 32 (33) 15. 02/2. 27 (18) 10. 64/3. 48 (61) 11. 69/2. 83 (62) T 2 13. 86/1. 63 (23) 14. 53/1. 78 (26) 13. 66/2. 76 (32) 15. 71/2. 83 (2) p 0. 616 0. 201 0. 101 0. 725 12. 01/2. 62 0. 046 (40)
Qo. L Psychological domain Group G 1 diet G 2 physical activity G 3 (G 1+G 2) G 4 G 5 control T 0 14. 52/2. 25 (40) 14. 44/2. 53 (42) 13. 57/2. 37 (45) 14. 96/2. 78 (23) T 1 Mean/SD (N) 14. 94/1. 68 (36) 14. 99/1. 73 (35) 14. 24/2. 65 (33) 15. 48/1. 76 (18) 11. 91/3. 21 (61) 12. 73/2. 92 (62) T 2 15. 04/1. 38 (23) 15. 56/1. 15 (26) 14. 44/1. 93 (32) 14. 33/1. 41 (2) p 0. 339 0. 116 0. 097 0. 640 13. 78/2. 86 0. 001 (40)
Qo. L Sociological domain Group G 1 diet G 2 physical activity G 3 (G 1+G 2) G 4 G 5 control T 0 13. 13/3. 48 (40) 13. 90/2. 62 (42) 12. 98/2. 61 (45) 14. 20/2. 77 (23) T 1 Mean/SD (N) 13. 78/3. 31 (36) 14. 59/2. 38 (35) 13. 37/3. 54 (33) 14. 37/2. 61 (18) 12. 37/3. 51 (61) 11. 91/4. 10 (62) T 2 13. 97/3. 64 (23) 14. 21/3. 37 (26) 13. 88/4. 01 (32) 14. 00/4. 71 (2) p 0. 215 0. 449 0. 143 0. 985 11. 50/3. 43 0. 582 (40)
Qo. L Environmental domain Group G 1 diet G 2 physical activity G 3 (G 1+G 2) G 4 G 5 control T 0 14. 01/2. 86 (40) 14. 83/2. 47 (42) 14. 50/2. 25 (45) 14. 46/2. 39 (23) T 1 Mean/SD (N) 14. 35/2. 31 (36) 15. 16/1. 88 (35) 14. 02/3. 23 (33) 15. 08/1. 67 (18) 12. 90/3. 17 (61) 12. 78/3. 60 (62) T 2 15. 74/0. 81 (23) 15. 38/1. 82 (26) 14. 88/2. 75 (32) 13. 50/0. 71 (2) p 0. 005 0. 425 0. 207 0. 344 13. 50/3. 82 0. 036 (40)
ADL - Activities of Daily Living Group G 1 diet G 2 physical activity G 3 (G 1+G 2) T 0 T 1 T 2 Mean/SD (N) 5. 70/0. 72 5. 42/1. 68 5. 87/0. 46 (40) (36) (23) 5. 74/0. 86 5. 60/1. 42 5. 54/1. 63 (42) (35) (26) 5. 76/1. 00 5. 33/1. 74 5. 69/1. 12 (45) (33) (32) p 0. 524 0. 790 0. 287 G 4 - - G 5 control 4. 74/1. 74 (61) 4. 45/2. 00 (62) 4. 45/2. 16 (4) 0. 893
IADL - Instrumental Activities of Daily Living Group G 1 diet G 2 physical activity G 3 (G 1+G 2) T 0 T 1 T 2 p Mean/SD (N) 24. 77/4. 02 25. 29/3. 10 25. 48/2. 02 0. 798 (39) (35) (23) 25. 27/2. 03 25. 38/3. 18 25. 96/1. 07 0. 497 (40) (34) (23) 25. 14/2. 54 25. 52/1. 43 26. 00/2. 76 0. 013 (43) (29) (31) G 4 - - G 5 control 19. 24/6. 49 (59) 20. 19/6. 57 (57) - - 21. 37/5. 46 0. 256 (35)
Beck Depression Inventory T 0 T 1 Mean/SD (N) T 2 G 1 diet - - G 2 physical activity - - G 3 (G 1+G 2) - - G 4 9. 05/11. 19 (19) 8. 67/9. 04 (15) 6. 00/7. 07 (2) 0. 979 G 5 control - - Group p
Seniors about the interventions
Seniors about the PKE
The biggest difficulties for patients: • a lack of motivation for exercises • regularity of exercises • preparing meals according to recommendations • choosing and buying the right nutritional products
Reasons for reducing groups: • large volume of questionnaires • getting sick (autumn-winter period) • control group - a lack of motivation to meet - no intervention • shortage of personnel carrying out the interventions
The Info Movie for the Patients
Frailty scale M o r
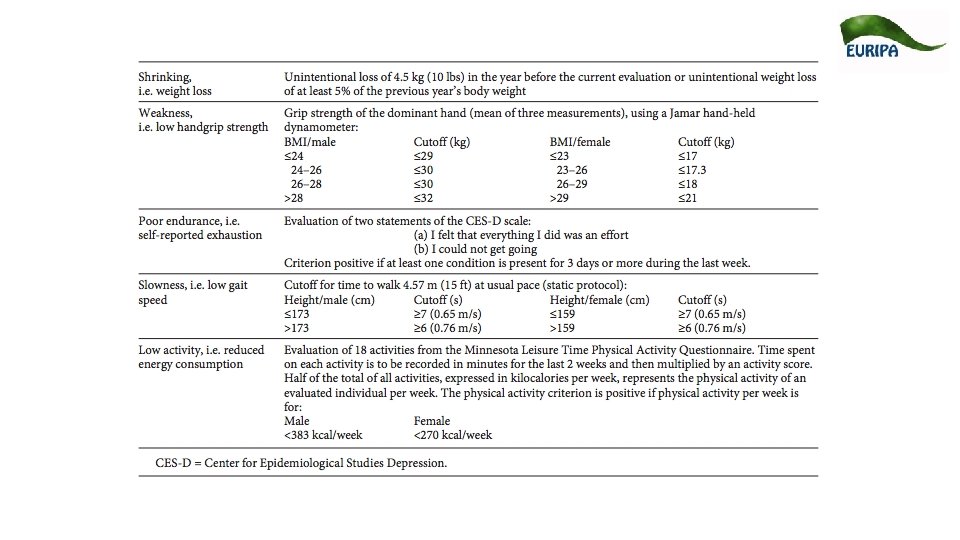
The Short Physical Performance Battery (SPPB) • three parts: 1. balance (three positions) 2. slowness 3. stand up and sit down in a chair five times • The final score results from the sum of the three sub-test, and ranges from 0 (worst) to 12. A total score below 10 indicates frailty, high risk of disability and falls
Linda Fried Criteria (Frailty Phenotype model) 1. 2. 3. 4. 5. Weight loss Weakness Poor endurance and energy Slowness Low physical activity level Fried’s Model scores range from 0– 5 (i. e. , 1 point for each component; 0=best to 5=worst) and represent frail (3– 5), pre -frail (1– 2), and robust (0) health status
The Frailty Trait scale 1. 2. 3. 4. 5. 6. 7. Energy balance and nutrition Activity The nervous system. The vascular system Weakness. Low energy Slowness
Gerontopole frailty screening tool 1. 2. 3. 4. 5. 6. 7. 8. living alone, involuntary weight loss, fatigue, mobility difficulties, memory problems and gait speed the general practitioner’s personalview about the frailty status patient’s willingness to be referred to the Frailty center
What is used? • • • • Tool used Number Frequency (%) Gait speed 170 43. 8 Clinical frailty scale 133 34. 3 SPPB 117 30. 2 Frailty phenotype (i. e. Fried criteria) 104 26. 8 Frailty index 65 16. 8 Frail scale status 47 12. 1 Edmonton frail scale 36 9. 28 Gerontopole frailty screening tool 28 7. 22 SHARE frailty instrument 16 4. 12 SEGA grid 15 3. 87 Groningen frailty indicator 10 2. 55 Strawbridge questionnaire 8 2. 06 Tilburg frailty indicator 5 1. 29 Other 160 41. 2
In your Daily practice 1. Which tool is the more relevant ? 2. Which tool is the more feaseable ? 3. Which tool will you use ?