Fracture risk prediction F Hosseinpanah M D Obesity

Fracture risk prediction F. Hosseinpanah, M. D. Obesity Research Center Research Institute for Endocrine sciences Shahid Beheshti University of Medical Sciences janurary 11, 2018

Agenda • • • RFs for Fracture Ways to express fracture risk FRAX BMD changes TBS Conclusions

Bone Mass Bone Strength Geometry Microarchitecture Bone turnover

Bone Strength FRACTURE Falls Padding Postural Reflexes

Risk factors for fracture • Age • BMD • Clinical risk factors

Risk factors for fracture • Age • BMD • Clinical risk factors

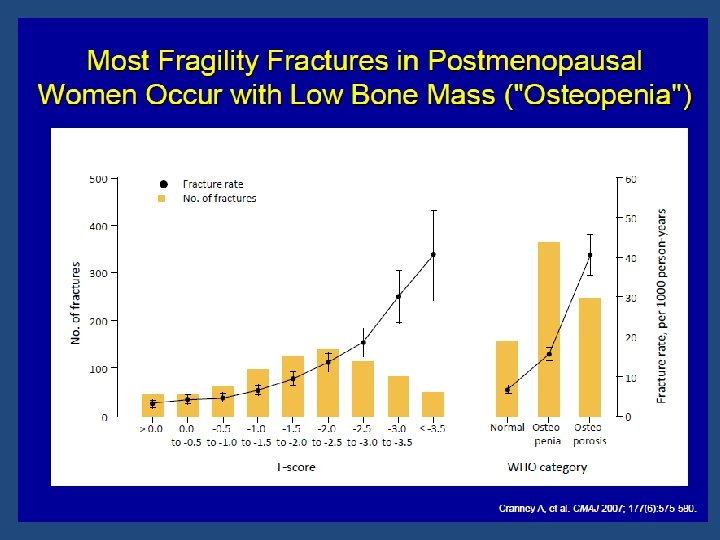
Fracture Risk • BMD is well correlated with bone strength by biomechanical testing • Relationship between BMD and fracture risk is exponential • BMD overlaps in patients with and without fracture

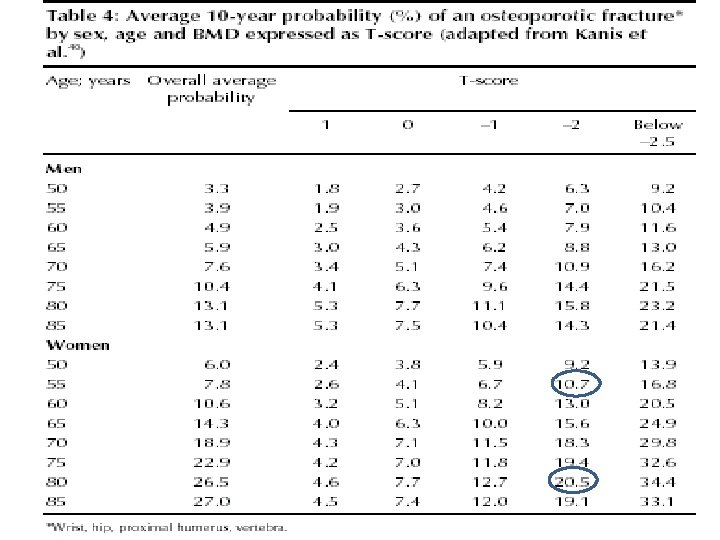
There is not a fracture threshold below which all osteoporotic fractures occur, rather , there is a continuum of risk proportional to the decrease in fracture risk

Bone Density & Age vs. Fracture Risk Age 80 70 60 Ten Year Fracture Probability (%) 50 Probability of first fracture of hip, distal forearm, proximal humerus, and symptomatic vertebral fracture in women of Malmö, Sweden. Adapted from Kanis JA et al. Osteoporosis Int. 2001; 12: 989 -995.
 Site Hip Fx vertebral")
RR of Fx for 1 SD decrease in BMD (age-matched) Site Hip Fx vertebral Fx Distal radius 1. 8 1. 7 Proximal radius 2. 1 2. 2 2. 0 2. 4 1. 6 2. 3 2. 6 1. 8 Calcaneous Spine Femoral neck (marshall D, et al, BMJ. 1996: , 312: 1254)

Risk factors for fracture • Age • BMD • Clinical risk factors

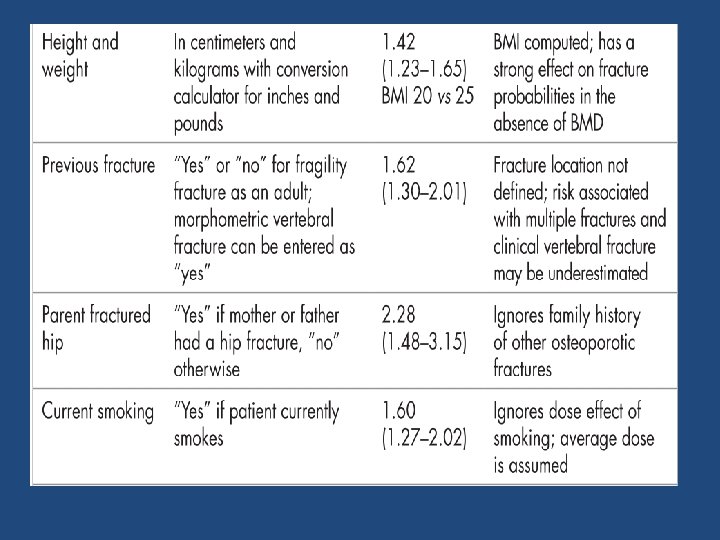
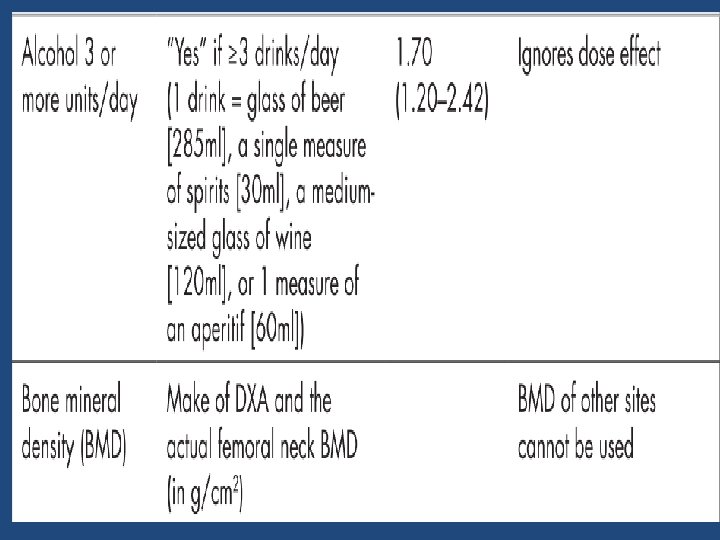
Validated Risk Factors • • Advanced age Previous fracture Long‐term glucocorticoid therapy Low body weight (less than 58 kg [127 lb]) Family history of hip fracture Cigarette smoking Excess alcohol intake

Strongest non‐BMD predictors • Age • Prior fragility fracture Kanis JA; Borgstrom F; De Laet C; Johansson H; Johnell O; Jonsson B; Oden A; Zethraeus N; Pfleger B; Khaltaev N SO - Osteoporos Int 2005 Jun; 16(6): 581 -9

Previous Fx and relative risk for future Fx Wrist Vertebra Hip Wrist Fx 3. 3 1. 7 1. 9 Vertebral Fx 1. 4 4. 4 2. 3 Hip Fx NA 2. 5 2. 3

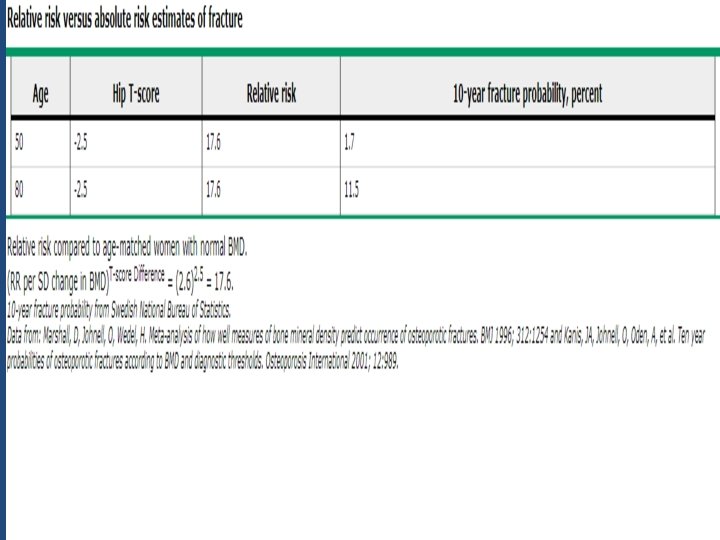
Way to express fracture risk • Relative risk (RR of Fx for every SD difference in BMD compared to a young normal or age matched population with normal BMD ) • Absolute Risk ( fracture risk per 1000 person years , 50% of women over 80 have osteoporosis)
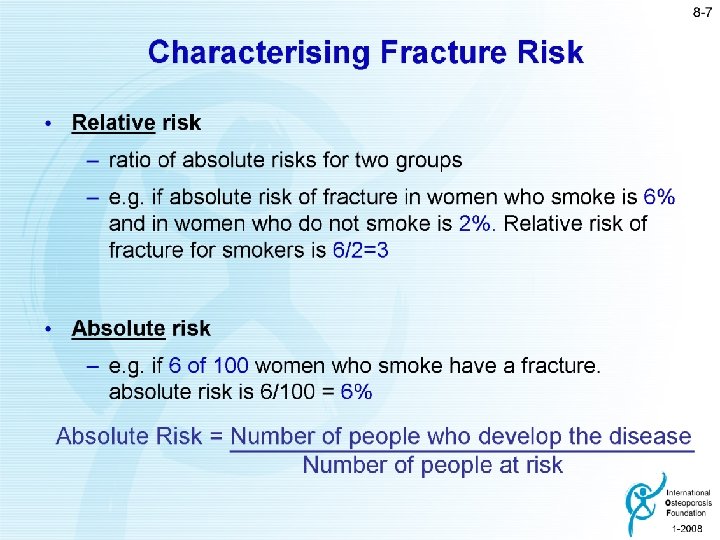

Limitations of RR • If the absolute risk for fracture in group A is 50% compared to the absolute risk for fracture of 25% in group B, the relative risk of group A compared to group B is 2 (50% ÷ 25% = 2) • The relative risk would also be 2, however, if the absolute risk in group A was 2% and the absolute risk in group B was 1% (2% ÷ 1% = 2)

Baseline DXA Report: Minimum Requirements • A statement about fracture risk. Any use of relative fracture risk must specify the population of comparison (e. g. , young‐ adult or age‐ matched) • The ISCD favors the use of absolute fracture risk prediction when such methodologies are established 2015 ISCD Official Positions – Adult

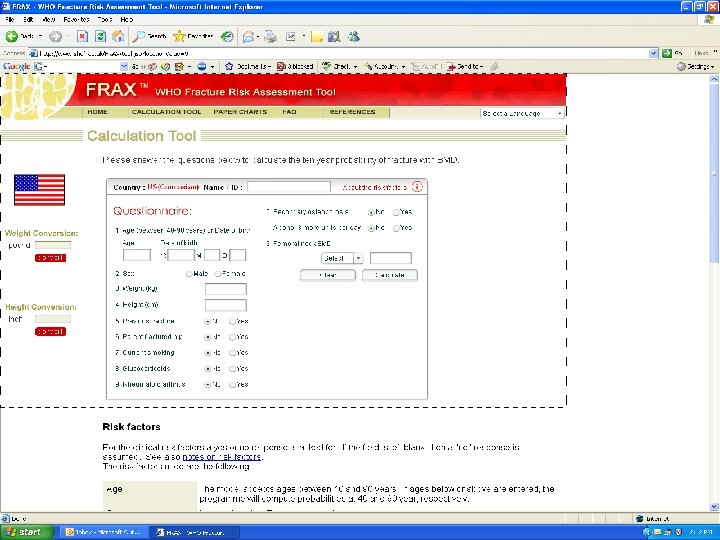
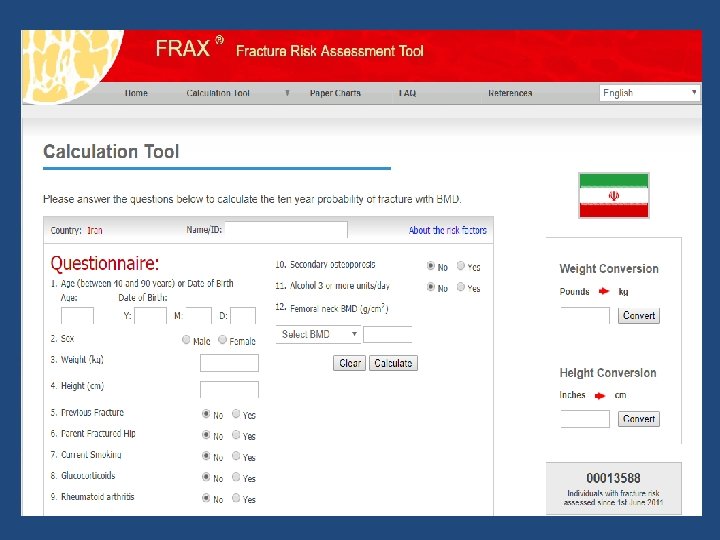
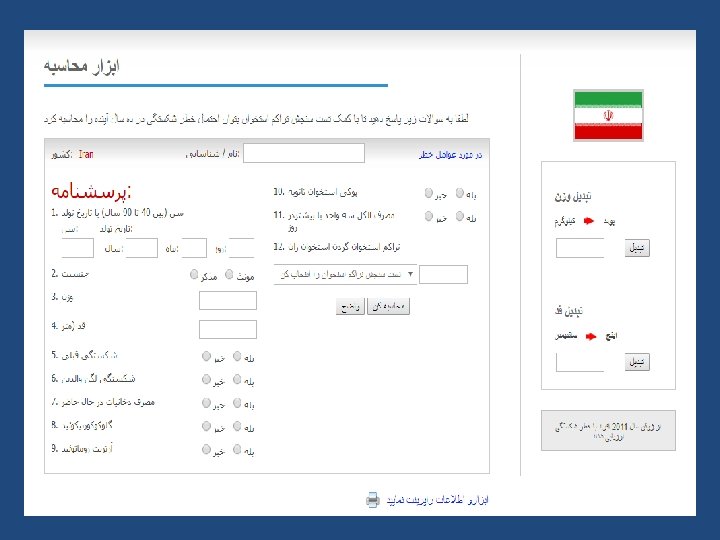
FRAX WHO Absolute Fracture Risk Model

Toward a risk calculator • • • LDL AGE FH HDL DM SMOKING HTN SEX, … RISK OF CVD>10% • • • BMD PRE OR POSTMENOPAUSAL SURVIVAL Obesity INDEPENDENT RF PROTECTIVE FACTORS BONE LOSS SITE TREATMENT RISK OF FRACTURE>10%

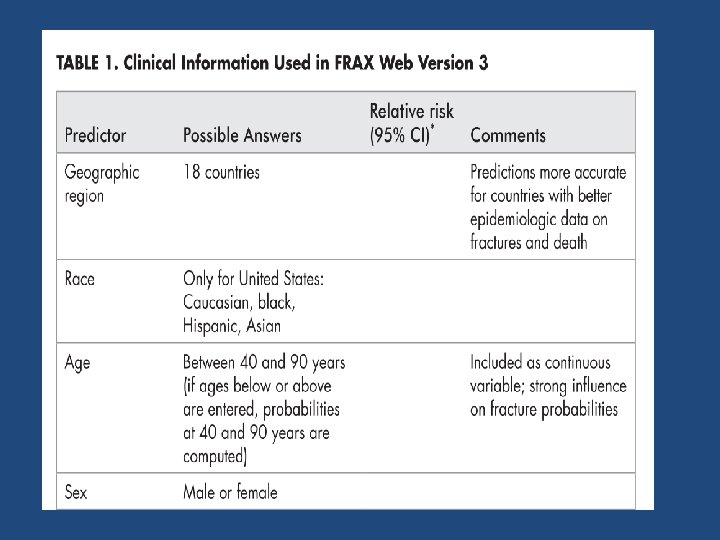
FRAX • FRAX involved extensive analysis of data from 12 large prospective epidemiological studies involving about 60, 000 men and women in different world regions, with over 250, 000 person‐years of observation and >5000 fractures • The models have been validated in an additional 11 cohort studies with 230, 000 men and women and more than 1. 2 million person‐years of observation

https: //www. sheffield. ac. uk/FRAX

Limitations of FRAX

1 • While there is evidence that duration and dose of tobacco smoking may impact on fracture risk, quantification of this risk is not possible • Falls are a risk factor fractures but are not accommodated as an entry variable in the current FRAX model. • Fracture probability may be underestimated in individuals with a history of frequent falls, but quantification of this risk is not currently possible

2 • There is a relationship between number of prior fractures and subsequent fracture risk. FRAX underestimates fracture probability in persons with a history of multiple fractures • There is a relationship between severity of prior vertebral fractures and subsequent fracture risk. FRAX may underestimate fracture probability in individuals with prevalent severe vertebral fractures

3 • While there is evidence that hip, vertebral, and humeral fractures appear to confer greater risk of subsequent fracture than fractures at other sites, quantification of this incremental risk in FRAX is not possible

4 • A parental history of non‐hip fragility fracture may be a risk factor fracture. FRAX may underestimate fracture probability in individuals with a parental history of non‐hip fragility fracture • Evidence that bone turnover markers predict fracture risk independent of Bone Mineral Density (BMD) is inconclusive. Therefore, bone turnover markers are not included as risk factors in FRAX

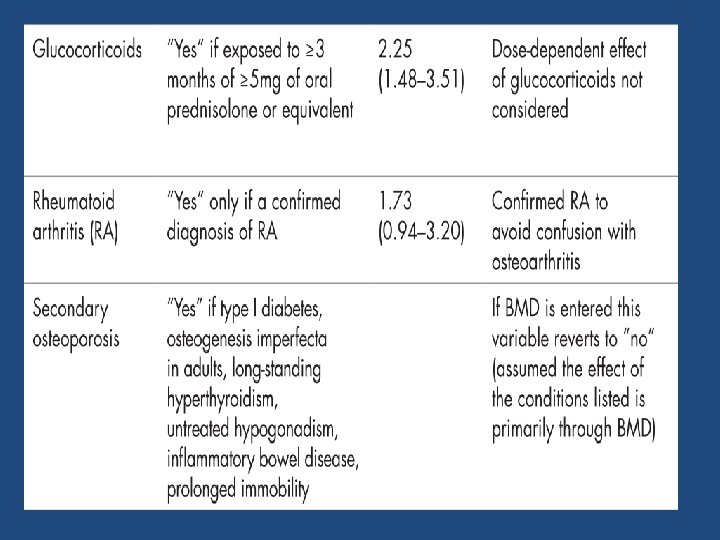
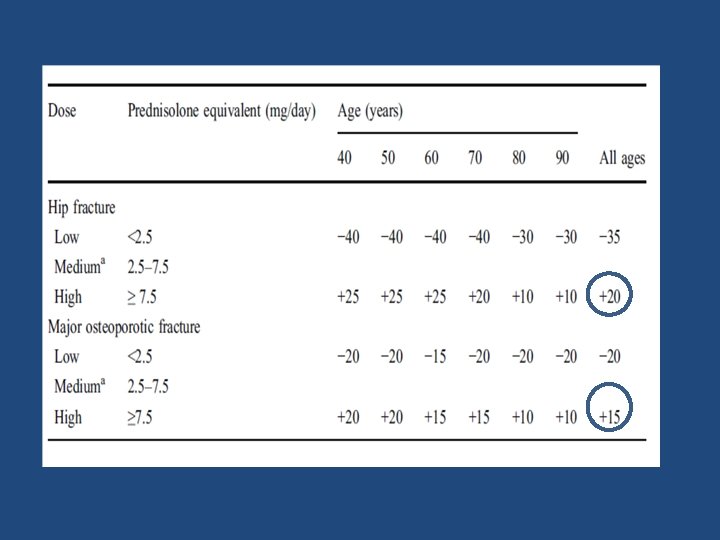
5 • There is a dose relationship between glucocorticoid use of greater than 3 months and fracture risk. The average dose exposure captured within FRAX is likely to be a prednisone dose of 2. 5‐ 7. 5 mg/day or its equivalent. • Fracture probability is under‐estimated when prednisone dose is greater than 7. 5 mg/day and is over‐estimated when prednisone dose is less than 2. 5 mg/day.

6 • Frequent intermittent use of higher doses of glucocorticoids increases fracture risk. Because of variability in the dose and dosing schedule, quantification of this risk is not possible. • High dose inhaled glucocorticoids may be a risk factor fracture. FRAX may underestimate fracture probability in users of high dose inhaled glucocorticoids.

7 • Appropriate glucocorticoid replacement in individuals with adrenal insufficiency has not been shown to increase fracture risk • In such patients , use of glucocorticoids should not be included in FRAX calculations

• Aim : To estimate the adjustment for fracture probability based upon the dose of glucocorticoids • Methods: Dose responses for fracture risk during exposure to glucocorticoids were taken from the General Practice Research Database and used to adjust the relative risks for glucocorticoids in FRAX Osteoporos Int (2011) 22: 809– 816

8 • FRAX may underestimate or overestimate major osteoporotic fracture risk when lumbar spine T‐ score is much lower or higher (>1 Standard Deviation discrepancy) than femoral neck T‐score

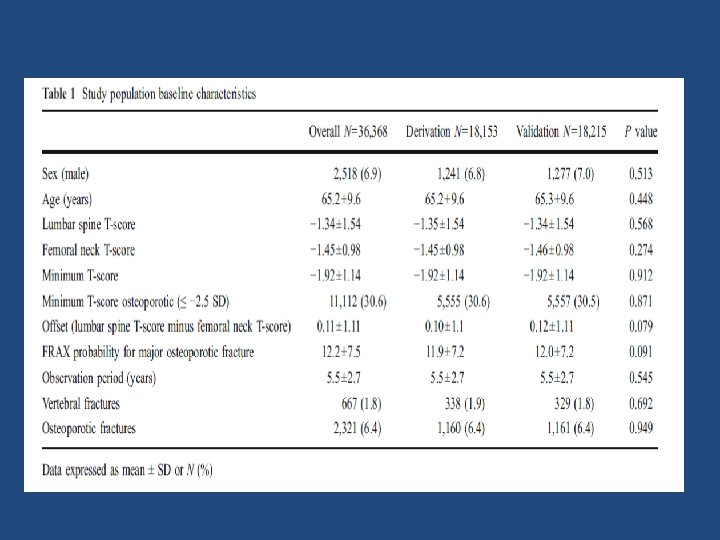
• Aim: To describe a simple procedure for using lumbar spine BMD to enhance fracture risk assessment under the FRAX system. • The Manitoba BMD database was used to identify baseline LS and FN DEXA examinations (33, 850 women and 2, 518 men age 50 and older) with FRAX estimates for a major osteoporotic fracture categorized as low (<10%), moderate (10– 20%), and high (>20%). • Fracture outcomes were assessed from population‐based administrative data • An approach was developed and internally validated using a split‐cohort design Osteoporos Int (2011) 22: 839– 847

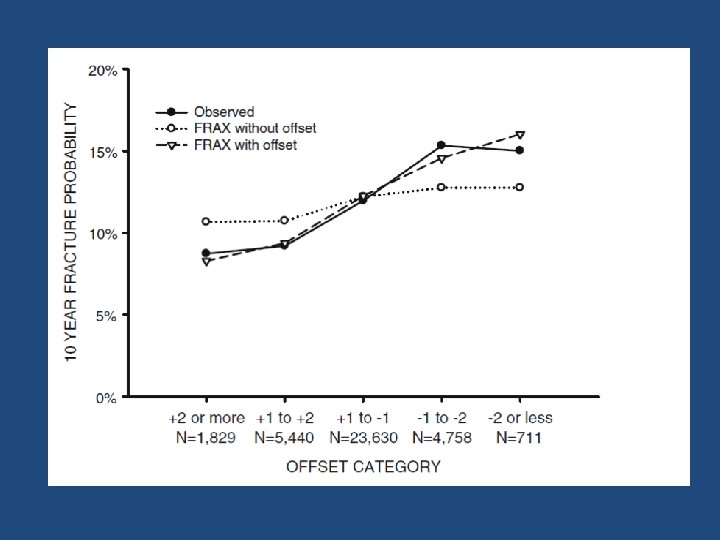
lumbar spine–femoral neck “offset” • The lumbar spine–femoral neck “offset” was calculated as the numeric difference in the respective T‐scores (lumbar spine T‐score minus femoral neck T‐score) • A negative offset indicated that the T‐score of the lumbar spine was lower than that of the femoral neck • A positive offset indicated the T‐score of the lumbar spine was higher than that of the femoral neck

Results • Using the derivation subgroup, the FRAX probability for major osteoporotic fractures was strongly predictive of major osteoporotic fractures (P<0. 001). • When adjusted for FRAX probability, the offset variable was also independently predictive of major osteoporotic fractures [HR 1. 12 (95% CI, 1. 06– 1. 18, P<. 001) for every SD lumbar spine below femoral neck].

Simple procedures • “Increase/decrease osteoporotic FRAX estimate by one tenth for each rounded T‐score difference between the lumbar spine and femoral neck. ”

Practical example • Consider an individual with a femoral neck T‐score of − 1. 7 and a major osteoporotic FRAX probability of 18%. • If the lumbar spine T‐score is − 3. 5 then this indicates an offset of − 1. 8 (− 3. 5 minus − 1. 7). This is rounded to the nearest whole number(− 2) • One tenth of the FRAX estimate based upon the femoral neck is 1. 8%, which is multiplied by the rounded offset value (giving 3. 6%). • This is then added (because lumbar spine T‐score is worse than femoral neck T‐score) to the original FRAX estimate (18%) giving a final (rounded) probability of 22% (18%+3. 6%)

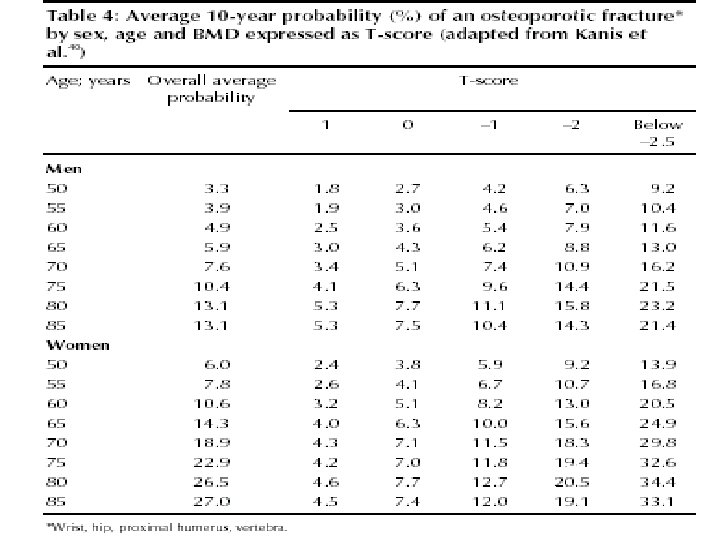
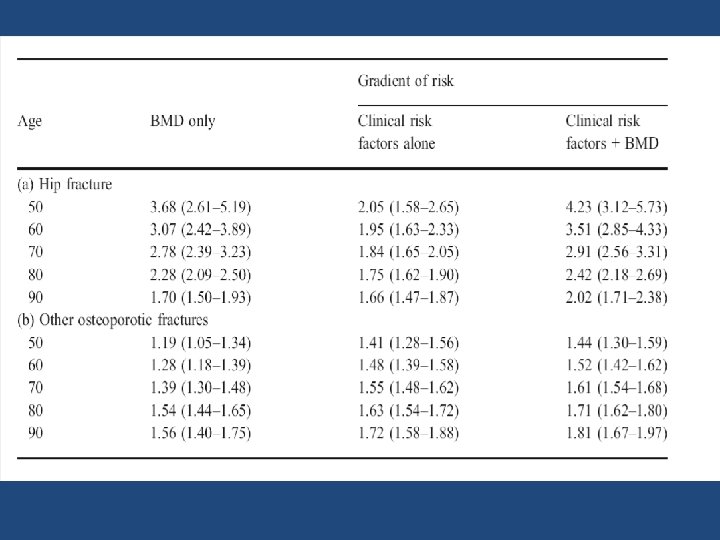
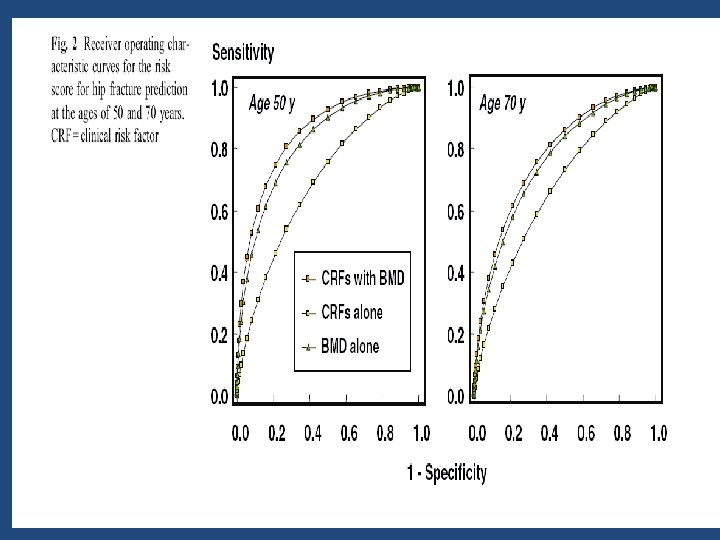
9 • FRAX with BMD predicts fracture risk better than clinical risk factors or BMD alone • Use of FRAX without BMD is appropriate when BMD is not readily available or to identify individuals who may benefit from a BMD measurement

10 • It is not appropriate to use FRAX to monitor treatment response • Evidence that rate of bone loss may be an independent risk factor fracture is conflicting. Therefore, rate of bone loss is not included as a FRAX risk factor

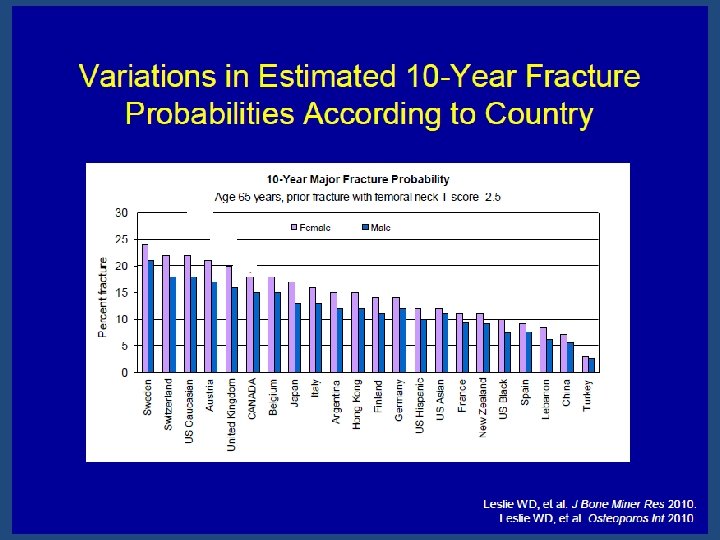
11 • There is significant variability in hip fracture rates throughout the world • The minimum requirement for construction of a country‐specific FRAX model is hip fracture incidence data that are of high quality and representative of that country

12 • The accuracy of FRAX models is improved by the inclusion of country‐, age‐ and sex‐specific rates of other major osteoporotic fractures (clinical vertebral, humerus, distal forearm) • In the absence of high quality, national hip fracture data, a country‐specific FRAX model can be built using hip fracture incidence rates from a surrogate country, but with incorporation of country‐specific mortality rates

• To provide an overview of existing valid and reliable risk assessment tools for prediction of osteoporotic fractures. • Additionally, we aimed to determine if the performance of each tool was sufficient for practical use, and last, to examine whether the complexity of the tools influenced their discriminative pwer J Bone Miner Res 2013 Aug; 28(8): 1701 -17

Risk assessment tools • Risk assessment tools predicting low BMD • Risk assessment tools predicting fractures

Sensitivity ranged from 50% to 100%, with most between 80% and 90% Specificity ranged from 10% to 88%, with most around 50%

• 12 tools were developed to identify individuals with an increased risk of fractures • Only six tools (OST, ORAI, SCORE, Garvan, FRAX, and Qfracture) were externally validated in a population‐based setting with proper methodological quality • None of the tools performed consistently better than others when tested in external validation studies • Simple tools with fewer risk factors often did as well or better (i. e. , OST, ORAI, Garvan) than more complex tools with more risk factors (i. e. , SCORE, FRAX, Qfracture)

• To determine whether changes in BMD after 4 years provide additional information on fracture risk beyond baseline BMD • 310 men and 492 women from the Framingham Osteoporosis Study with 2 measures of femoral neck BMD taken from 1987 through 1999 • Risk of hip or major osteoporotic fracture through 2009 or 12 years following the second BMD measure JAMA. 2013; 310(12): 1256‐ 1262

In ROC curve analyses, the addition of BMD change to a model with baseline BMD did not meaningfully improve performance

Key message • In untreated men and women of mean age 75 years, a second BMD measure after 4 years did not meaningfully improve the prediction of hip or major osteoporotic fracture
 • This novel method is entirely noninvasive and, in fact,")
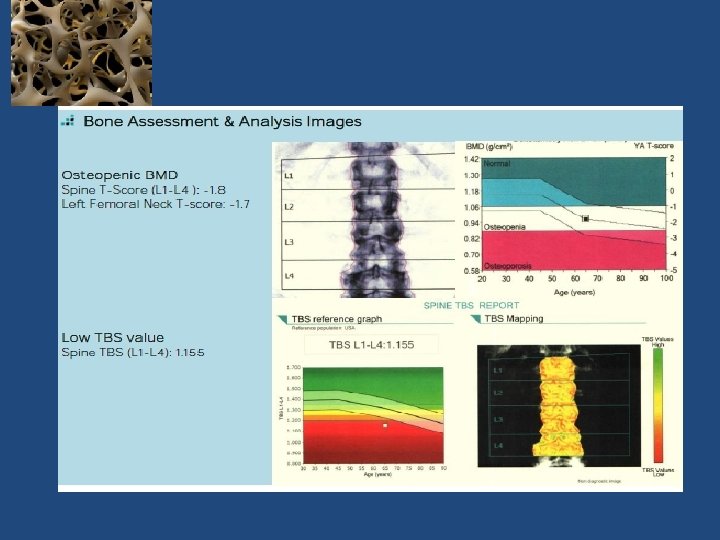
Trabecular bone score (TBS) • This novel method is entirely noninvasive and, in fact, requires no further patient testing • It consists of gray‐scale textural analysis of anteroposterior LS‐DXA images previously obtained for BMD assessments. It also, by assessing the micro‐architectural texture of trabecular bone, contributes to the evaluation of bone strength, thereby aiding in the diagnosis of osteoporosis and the prediction of future osteoporotic fractures Silva BC, et al. Trabecular bone score: a noninvasive analytical method based upon the DXA image. J Bone Miner Res. 2014

TBS: 1. 512 TBS: 1. 196 TBS greater than or equal to 1. 350 is considered normal

65 -year Old Woman Osteopenic BMD Low TBS Jane Doe is a 65‐year old white female who is concerned about fracture risk, as her mother recently fell and sustained a hip fracture. Her mother had previously sustained three vertebral fractures, the first of which occurred at age 68. Ms. Doe is generally healthy, taking only a statin for hyperlipidemia. Her diet provides ~1, 000 mg of calcium and she takes 1, 000 IU of supplemental vitamin D 3 daily. She does not smoke, drinks one glass of wine daily and walks for ~30 minutes three to five times a week. Her menopause was at age 48, and she never received estrogen therapy. She has no personal history of fragility fracture, rheumatoid arthritis or glucocorticoid use. Laboratory evaluation included serum calcium, creatinine, phosphorous, PTH, and 25 (OH)D, all of which were normal. Dr Neil Binkley, Geriatrics University of Wisconsin Hospital and Clinics, Madison, WI, USA

18% 1. 2

Journal of Bone and Mineral Research, 2016
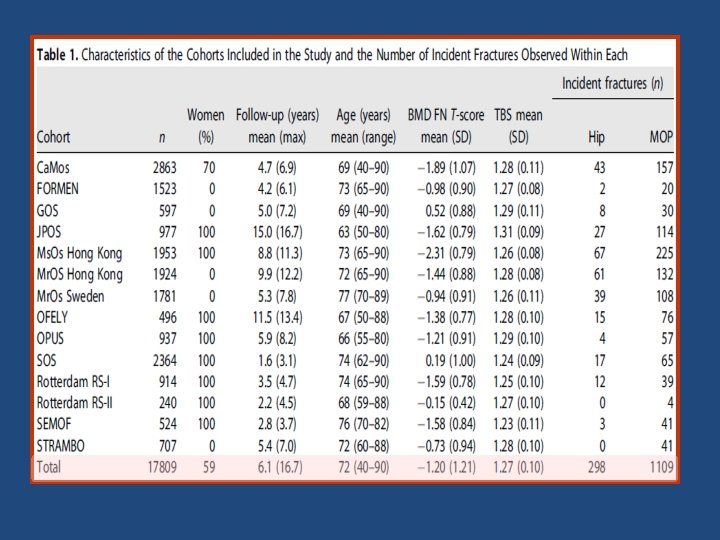
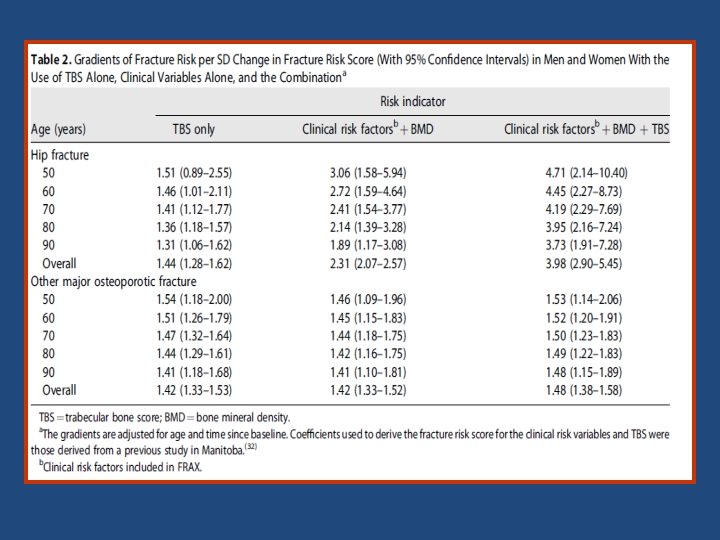
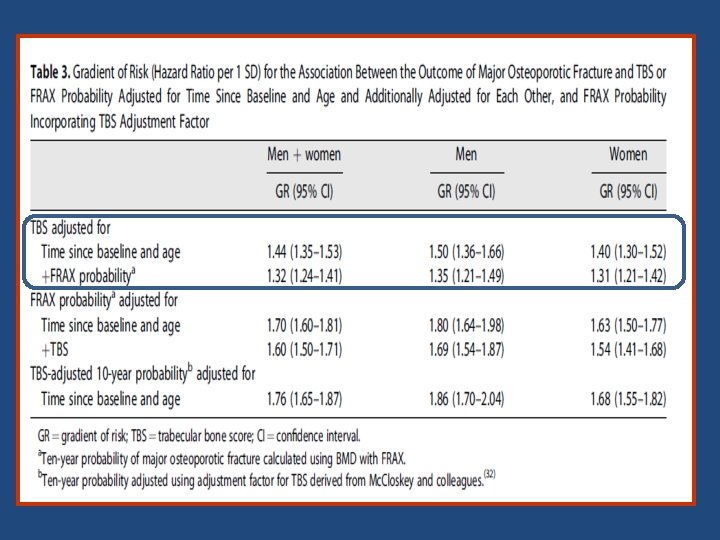
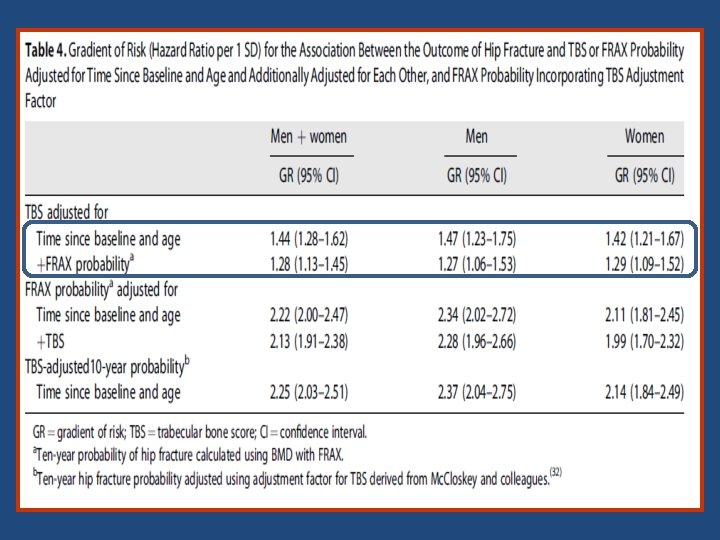

Key messages • The findings of the study support the use of TBS, not only as a standalone assessment of fracture risk but also, more importantly, as an independent contributor to a more global risk assessment that could permit its use along side established risk assessment tools such as FRAX. • This was reflected in the higher GRs and AUCs when TBS was combined with the FRAX clinical risk factors and BMD, particularly for hip fracture outcomes

ISCD Official Position • TBS is associated with vertebral, hip, and major osteoporotic fracture risk in postmenopausal women • TBS should not be used alone to determine treatment recommendations in clinical practice. • TBS can be used in association with FRAX and BMD to adjust FRAX‐ probability of fracture in postmenopausal women and older men. • TBS is not useful for monitoring bisphonate treatment in postmenopausal women with osteoporosis. • TBS is associated with major osteoporotic fracture risk in postmenopausal women with type 2 diabetes. Adult Official Positions of the ISCD as updated in 2015

Conclusion • Bone density is important determinate of fracture risk • Relationship between BMD and fracture risk is exponential • There are many non BMD risk factors that contribute to fracture risk • Age and prior fragility fracture are strongest non BMD risk factors • Combination of BMD and clinical risk factors improves the risk assessment • TBS seems to be an useful tool when decision to treat is equivocal

Thank You 88
- Slides: 81