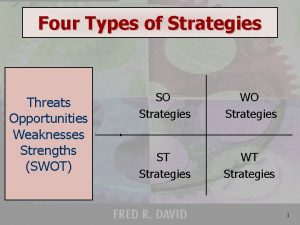
Four Types of Strategies Threats Opportunities Weaknesses Strengths


- Slides: 22

Four Types of Strategies Threats Opportunities Weaknesses Strengths (SWOT) SO Strategies WO Strategies ST Strategies WT Strategies 1

SO Strategies Threats Opportunities Weaknesses Strengths (SWOT) SO Strategies Use a firm’s internal strengths to take advantage of external opportunities 2

WO Strategies Threats Opportunities Weaknesses Strengths (SWOT) WO Strategies Improving internal weaknesses by taking advantage of external opportunities 3

ST Strategies Threats Opportunities Weaknesses Strengths (SWOT) ST Strategies Using firm’s strengths to avoid or reduce the impact of external threats. 4

WT Strategies Threats Opportunities Weaknesses Strengths (SWOT) WT Strategies Defensive tactics aimed at reducing internal weaknesses and avoiding environmental threats. 5

Strategy Analysis & Choice The SWOT Matrix • • List the the firm’s key key external opportunities external threats internal strengths internal weaknesses 6

Strategy Analysis & Choice The SWOT Matrix • • Match internal strengths with external opportunities and record the resultant SO Strategies Match internal weaknesses with external opportunities and record the resultant WO Strategies Match internal strengths with external threats and record the resultant ST Strategies Match internal weaknesses with external threats and record the resultant WT Strategies 7

SWOT Matrix Leave Blank Strengths-S Weaknesses-W List Strengths List Weaknesses Opportunities-O SO Strategies WO Strategies List Opportunities Use strengths to take advantage of opportunities Overcome weaknesses by taking advantage of opportunities Threats-T ST Strategies WT Strategies List Threats Use strengths to avoid threats Minimize weaknesses and avoid threats 8

Strategy Analysis & Choice Boston Consulting Group Matrix (BCG) • • • Enhances multidivisional firms’ efforts to formulate strategies Autonomous divisions (or profit centers) constitute the business portfolio Firm’s divisions may compete in different industries requiring separate strategy 9

Strategy Analysis & Choice Boston Consulting Group Matrix (BCG) • • • Graphically portrays differences among divisions Focuses on market share position and industry growth rate Manage business portfolio through relative market share position and industry growth rate 10

Strategy Analysis & Choice Boston Consulting Group Matrix (BCG) • Relative market share position defined: Ø Ratio of a division’s own market share in a particular industry to the market share held by the largest rival firm in that industry. 11

BCG Matrix Relative Market Share Position Industry Sales Growth Rate High 1. 0 Medium. 50 Low 0. 0 High +20 Stars II Question Marks I Cash Cows III Dogs IV Medium 0 Low -20 12

Strategy Analysis & Choice BCG Matrix • Question Marks Ø Low relative market share position yet compete in high-growth industry. Cash needs are high § Case generation is low § Ø Decision to strengthen (intensive strategies) or divest 13

Strategy Analysis & Choice BCG Matrix • Stars Ø High relative market share and high industry growth rate. § Best long-run opportunities for growth and profitability Ø Substantial investment to maintain or strengthen dominant position § Integration strategies, intensive strategies, joint ventures 14

Strategy Analysis & Choice BCG Matrix • Cash Cows Ø High relative market share position, but compete in low-growth industry Generate cash in excess of their needs § Milked for other purposes § Ø Maintain strong position as long as possible Product development, concentric diversification § If becomes weak—retrenchment or divestiture § 15

Strategy Analysis & Choice BCG Matrix • Dogs Ø Low relative market share position and compete in slow or no market growth § Weak internal and external position Ø Decision to liquidate, divest, retrenchment 16

Strategy Analysis & Choice Grand Strategy Matrix • • Popular tool formulating alternative strategies Based on two evaluative dimensions Ø Competitive position Ø Market growth 17

Grand Strategy Matrix RAPID MARKET GROWTH Quadrant II Quadrant I • • • WEAK COMPETITIVE POSITION • • • Market development Market penetration Product development Horizontal integration Divestiture Liquidation • • Quadrant III Retrenchment Concentric diversification Horizontal diversification Conglomerate diversification Liquidation Market development Market penetration Product development Forward integration Backward integration Horizontal integration Concentric diversification Quadrant IV • • Concentric diversification Horizontal diversification Conglomerate diversification Joint ventures SLOW MARKET GROWTH STRONG COMPETITIVE POSITION 18

Strategy Analysis & Choice Grand Strategy Matrix • Quadrant I Ø Excellent strategic position Ø Concentration on current markets and products Ø Take risks aggressively when necessary 19

Strategy Analysis & Choice Grand Strategy Matrix • Quadrant II Ø Evaluate present approach seriously Ø How to change to improve competitiveness Ø Rapid market growth requires intensive strategy 20

Strategy Analysis & Choice Grand Strategy Matrix • Quadrant III Ø Compete in slow-growth industries Ø Weak competitive position Ø Drastic changes quickly Ø Cost and asset reduction indicated (retrenchment) 21

Strategy Analysis & Choice Grand Strategy Matrix • Quadrant IV Ø Strong competitive position Ø Slow-growth industry Ø Diversification indicated to more promising growth areas 22
 Strengths opportunities threats weaknesses
 Strengths opportunities threats weaknesses
 Explain four types of strategies in “swot matrix”
 Opportunities and threats of a bakery
 Opportunities and threats of a teacher
 Opportunities and threats of a teacher
 List of opportunities and threats
 Fast direct peace with christ
 Myers briggs strengths and weaknesses
 Strength of taba model
 Pattern of strengths and weaknesses worksheet
 Token economy strengths and weaknesses
 Articles of confederation strengths and weaknesses
 Teacher input examples
 Cos swot analysis
 3 strengths and weaknesses
 Consumer report capsim
 Strengths and weaknesses of a business examples
 Weakness of poseidon
 Georgia constitution of 1777
 Articles of confederation weaknesses
 Plaafp strengths and weaknesses examples
 Evaluation schema


