Foundations of Economic Thinking The Economizing Problem Production

Foundations of Economic Thinking: The Economizing Problem
")
Production Possibilities Curve GUNS (millions Possibility a b c d e f per month) 0 1 2 3 4 5 BUTTER (millions of pounds per month) and and and 15 14 12 9 5 0
 Production Possibilities Frontier 15 a b c 10")
Butter (millions of units per month) Production Possibilities Frontier 15 a b c 10 d g e 5 Unemployment f 0 1 2 3 4 5 GUNS (millions per month)

Unemployment is inefficient because: • We can increase the benefits generated by satisfying additional wants without giving up any other goods produced. • Benefits can be gained simply by putting idle resources to work.
 Production Possibilities Frontier a 15 b c 10")
Butter (millions of units per month) Production Possibilities Frontier a 15 b c 10 d g e 5 Unemployment f 0 1 2 3 4 5 GUNS (millions per month)

B u tte r (m i l l i o n s o f u n i ts p e r m o n th ) Production Possibilities Frontier a 15 Unattainable with present resources b c 10 d Efficient Resource Use Attainable but not efficient 5 e f 0 1 2 3 4 5 GUNS (millions per month)

Productive Efficiency In order to be productively efficient, our economy must not be able to produce more of one good without producing less of another. In other words, we must be on the PPF. If we are inside of the PPF, we would not be getting the most benefit from our available resources.

Point A cannot be productively efficient since we can increase production of Guns without reducing Butter 120 90 60 A 30 0 7 14 21 28 Guns

Point B is efficient since if we want to increase production of Guns we must reduce the production of Butter 120 90 60 B 30 0 7 14 21 28 Guns

Point C is unattainable, since no matter how we juggle our resources, we cannot produce that much. It is outside of our PPF. Butter 120 90 C 60 30 0 7 14 21 28 Guns

Economic Growth Economic growth is illustrated by an economy’s expansion in production over time. It may result from: • The growth of capital resources, or (capital accumulation). • The growth of other resources. • Technological Advancement.

Economic Growth Butter 120 New PPF 90 60 30 0 7 14 21 28 Guns

Economic Growth Alternative Choices and Economic Growth CURRENT CURVE FUTURE CURVE CONSUMPTION Consumer Goods FAVORING FUTURE GOODS Capital Goods FAVORING PRESENT GOODS CONSUMPTION FUTURE CURVE CURRENT CURVE Consumer Goods

Technology Change Butter 120 New PPF 90 60 30 0 7 14 21 28 Guns

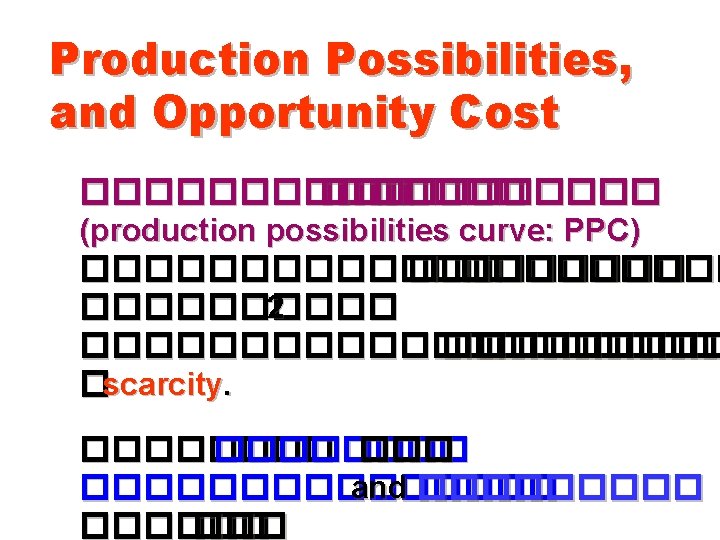
Opportunity Costs An opportunity cost is the highest valued alternative foregone. Opportunity costs increase as we desire to produce more Guns. This increasing opportunity cost is called the Law of Increasing Cost. This explains the shape of the PPC: it is bowed outward.

Law of Increasing Cost Marginal cost The opportunity cost of producing one more unit of a good or service. The marginal cost of additional Guns is the quantity of Butter that must be given up to get one more unit Guns -- the opportunity cost.

Law of Increasing Cost • As a society moves more and more resources from one alternative on the production possibilities curve into the production of the other alternative, The opportunity cost of production of that alternative will increase.
 Opportunity Cost and Marginal Cost 15 a Increasing")
Butter (millions of pounds per month) Opportunity Cost and Marginal Cost 15 a Increasing opportunity cost of Guns. . . b c 10 d e 5 f 0 1 2 3 4 5 Guns (millions per month)
 5 4 …")
Opportunity Cost and Marginal Cost Butter (millions of pounds per month) 5 4 … increasing marginal cost of Guns. 3 2 MC 1 0 1 2 3 4 5 Guns (millions per month)

Increasing Opportunity Cost In general, resources are specialized. Opportunity Cost increased because we used resources which were best at producing domestic goods (butter) at first. Then we were forced to move more resources which were best suited for domestic activity into the production of guns, and opportunity cost of guns increases.
")
Increasing Opportunity Cost If resources were homogenous (equally well suited for any production activity) the production possibilities curve would be a straight line and have constant opportunity cost.
 Computers (thousands per year) 50 40 30 20")
Production Possibilities Frontier (Constant Opportunity Costs) Computers (thousands per year) 50 40 30 20 10 A A straight-line PPF illustrates constant opportunity costs. B C D E F 0 10 30 20 40 50 Television Sets (thousands per year)

Allocation Efficiency For Allocation Efficiency, the economy must be: • On the PPF (productive efficiency) • Must be making choices which maximize the benefits to society.

Allocation Efficiency How do economists define the process the society should use to make the decisions on how to allocate scarce resources? If we are on the production possibilities curve, produce where MB = MC

Marginal Analysis Marginal benefit: Is the increased satisfaction gained from having one more unit of some good. Decreasing Marginal Benefit The more we have of any one good or service, the smaller is our marginal benefit.

Marginal Analysis Law of Diminishing Marginal Utility: • As a consumer consumes of a commodity (in a given time period), He or she will eventually get less satisfaction from additional units consumed.

Marginal Analysis Marginal Cost: • Is measured by the opportunity cost to society of getting additional units of a good produced. • Marginal Cost increases at we produce more of any product.

Marginal Benefit $ 5 Marginal Benefit reflects consumer satisfaction or Marginal Utility. 4 3 2 1 MB 0 1 2 3 4 5 Shoes (millions per month)

Opportunity Cost and Marginal Cost $ 5 MC 4 Increasing Marginal Cost of Shoes. 3 2 1 0 1 2 3 4 5 Shoes (millions per month)

Efficient Allocation of Resources Requires that resources be moved until the last unit results in MB = MC. If the marginal benefit of the last unit of a good exceeds its marginal cost, we increase production of that good. If the marginal cost of the last unit of a good exceeds its marginal benefit, we decrease production of that good.
 Allocation Efficiency 15 Decision Rule: a Move resources")
Butter (millions of units per month) Allocation Efficiency 15 Decision Rule: a Move resources from domestic goods to military goods If the Marginal Benefit of military goods is greater than the Marginal Cost of giving up the domestic e goods. b c 10 d 5 f 0 1 2 3 4 5 Guns Millions of Tons per Month

Efficient Use of Resources $ AT A MB = MC 5 B 4 AT B 3 > MC MB MC C AT C MB < MC A 2 MB 1 0 1 2 3 4 5 Guns Millions of Tons per Month

Allocation Efficiency and the Market • Market Demand reflects consumer’s evaluated benefits • Market Supply reflects producers evaluation of cost. MB = MC where supply = demand

Market Equilibrium and Allocation Efficiency P S E P* Supply measures MC Demand measures MB D 0 Q* Q

Allocation Efficiency • This is why economists find the outcome of competitive market equilibrium (S = D) consistent with • Optimum Resource Allocation.

Key Concepts: z The Production Possibilities Frontier z Unemployment and full resource use. z The Law of Increasing Opportunity Costs and the PPF z Economic Growth and the PPF z Productive Efficiency and Inefficiency z The Allocation Efficiency z Marginal Analysis z MB = MC
- Slides: 38