Foundations of Comparative Analytics for Uncertainty in Graphs

 § Comparative Operators - Structural")


 Language Structure Weights Relations,")


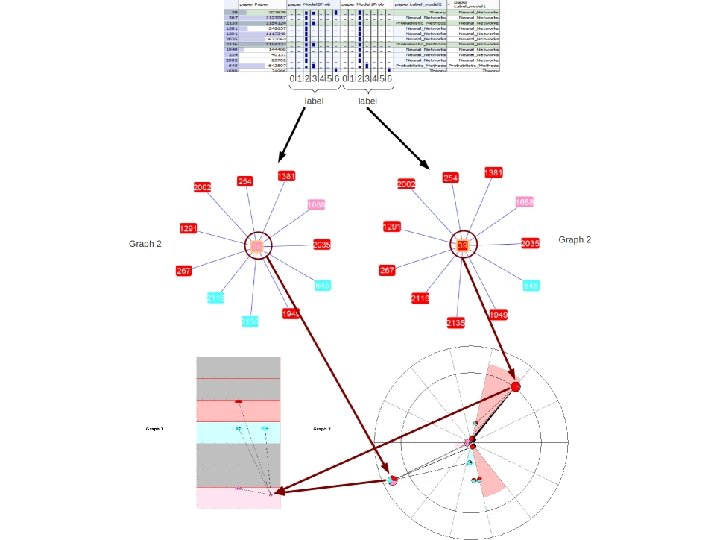
 § Table View : Compare feature values from both")


![References [1] Visualizing Node Attribute Uncertainty in Graphs, Nathaniel Cesario, Alex Pang, and Lisa](https://slidetodoc.com/presentation_image_h/21dbf41600a2159c6a3ca67dd736a5cf/image-21.jpg "References [1] Visualizing Node Attribute Uncertainty in Graphs, Nathaniel Cesario, Alex Pang, and Lisa")
![References [7] Efficient visual dynamic clustering of time varying social networks, Paul Caravelli. A](https://slidetodoc.com/presentation_image_h/21dbf41600a2159c6a3ca67dd736a5cf/image-22.jpg "References [7] Efficient visual dynamic clustering of time varying social networks, Paul Caravelli. A")


- Slides: 24
Foundations of Comparative Analytics for Uncertainty in Graphs Lise Getoor, University of Maryland Alex Pang, UC Santa Cruz Lisa Singh, Georgetown University
Overview § Mathematical Foundations - Probabilistic Soft Logic (PSL) § Comparative Operators - Structural and semantic operators § Comparative Visual Analytics of Uncertain Graphs - Novel, linked views 2
Applications § Personalized medicine § Dog kennel data § Dolphin social networking § Ontology alignment § Diffusion modeling §… 3
PSL Overview
What is PSL? Declarative language based on logic to express collective probabilistic inference problems - Predicate = relationship or property - (Ground) Atom = (continuous) random variable - Rule = capture dependency or constraint - Set = define aggregates PSL Program = Rules, Sets, Constraints, Atoms 5
Collective Similarity Reasoning Data Space Soft Space Model Formal (Logic) Language Structure Weights Relations, Text, Factoids, Images, etc 6 Inference MAP / Marginal Weight / Structure Learning
PSL Implementation § Implemented in Java / Groovy § ~40 k lines of code, but still alpha § Performance oriented - Database backend - Memory efficient data structures - High performance solver integration
Comparative Operators
Comparing Models § Output of PSL and other SRL systems can be viewed as an uncertain graph - Uncertainty attribute values - Uncertainty over edges - Uncertainty over node labels and existence § Want methods for comparing, constrasting and understanding the output of two different models.
Operators for Comparing Uncertain Graphs § Compare two graphs at different levels: attribute level, element level, ego network level, and graph level. § Output of operators used as input to comparative visualizations. § Example operators - Structural similarity • Similarity between the general shape of two distributions. Calculated using a ratio of entropy values and ratio of absolute distances. - Semantic similarity • Similarity between the probability of different values of two distributions. Calculated using KL-divergence, histogram intersection, and Minkowski. Form distance. Investigating extensions for ego network and graph level comparisons. - About 25 operators identified and being developed 10
Comparative Visual Analytics
Coordinated Views (work in progress) § Table View : Compare feature values from both models. § Ego View : Node-link diagram of ego networks of selected node(s). § Over. View: Comparative column and bullseye views of both models § others
Table View
Filtering in Table View
Ego View: Side-by-Side Model 1 Model 2 Nodes: Paper, Edges: Citation Node Labels: Red=Neural Network , Blue=Probabilistic Learning, Pink=Theory
Ego View: Overlaid Model 1 and Model 2 in the same diagram
Over. View 18
System Overview Data & Programs PSL … PSL Comparative Analysis Visual Analytics of Uncertain Graphs Other Statistical Relational Learning Software
References
References [1] Visualizing Node Attribute Uncertainty in Graphs, Nathaniel Cesario, Alex Pang, and Lisa Singh, SPIE Conference on Visualization and Data Analysis (VDA) 2011 [2] Comparative Visual Analytics for Network Data, Lise Getoor, Invited talk at NIPS Workshop on Challenges in Data Visualization, 2010 [3] Computing marginal distributions over continuous Markov networks for statistical relational learning, Matthias Broecheler, and Lise Getoor, Advances in Neural Information Processing Systems (NIPS) 2010 [4] A Scalable Framework for Modeling Competitive Diffusion in Social Networks, Matthias Broecheler, Paulo Shakarian, and V. S. Subrahmanian, International Conference on Social Computing (Social. Com) 2010, Symposium Section [5] Probabilistic Similarity Logic, Matthias Broecheler, Lilyana Mihalkova and Lise Getoor, Conference on Uncertainty in Artificial Intelligence 2010 [6] Decision-Driven Models with Probabilistic Soft Logic, Stephen H. Bach, Matthias Broecheler, Stanley Kok, Lise Getoor, NIPS Workshop on Predictive Models in Personalized Medicine 2010 21
References [7] Efficient visual dynamic clustering of time varying social networks, Paul Caravelli. A senior thesis. Technical Report CSTR-20100506 -6. 2010, Department of Computer Science, Georgetown University, Washington, DC 20057 [8] What are we missing? Perspectives on social network analysis for observational scientific data, L. Singh, E. J. Bienenstock and J. Mann, Handbook of Social Networks: Technologies and Applications. Ed. B. Furht. , Springer, 2010 [9] Probabilistic Similarity Logic, Matthias Broecheler, and Lise Getoor, International Workshop on Statistical Relational Learning 2009 [10] Visual Graph Comparisons with Bullseyes, Nathaniel Cesario, Alex Pang, Lisa Singh, and Lise Getoor, “, Poster at IEEE Vis. Week (2009) 22
Future Work § Uncertainty-centric layout algorithms § Limitations of linked-views § Animations as a learning tool § Comparative operators § Integration / Components § Dolphin data
? Questions? Comments?