Forward and Backward pass l During the Forward


Forward and Backward pass l During the Forward Pass of the network we estimate: l l l The earliest times that every activity can begin and finish (earliest start and finish) and The total project duration(total duration). During the Backward Pass we estimate: l l the latest time that every activity can begin and finish (latest start and finish). With this information we can draw conclusions in relation to which activities we can delay (slack >0) and which not. 4
 l Float (slack) of an activity is estimated by")
Float or Slack (βαθμός χαλαρότητας) l Float (slack) of an activity is estimated by Fi = LSi – ESi ή Fi = LFi – EFi l It indicates the amount of time we can increase the duration of a specific activity without changing the overall completion time of the project. 5

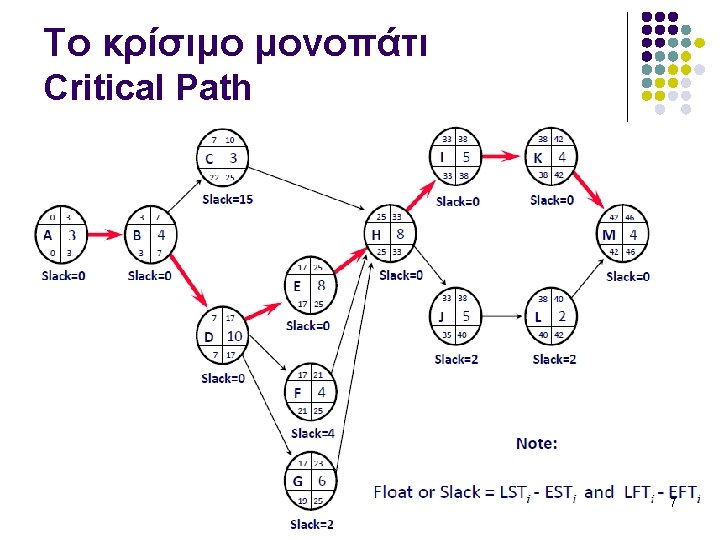
Estimation of the Critical Path l l Critical activities are those activities that have a zero Slack time. They can not, therefore, be delayed without delaying the overall completion of the whole project. Τhe slack of the non-critical activities represents the amount of time we can delay these activities without influencing the overall completion time of the project. Critical path is the path through the project network with connects the critical activities from start to finish. 6

CPM vs PERT CPM uses one time estimate Where as PERT uses three time estimates 8
 l l PERT is a method")
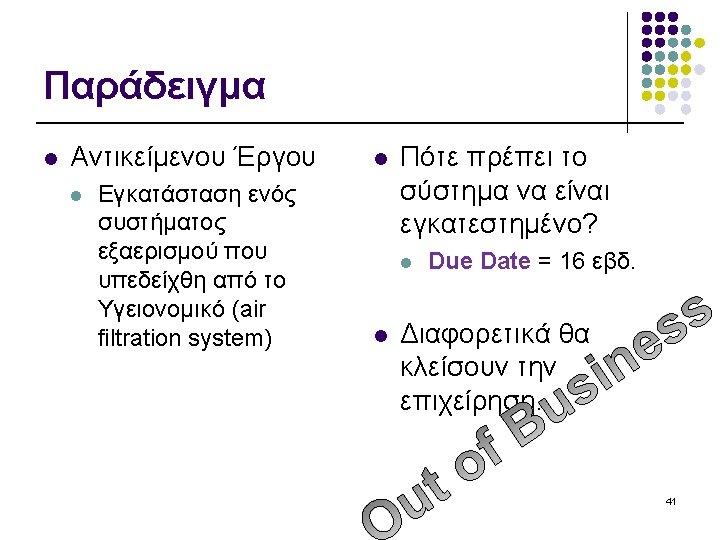
PERT l Program Evaluation and Review Technique (PERT) l l PERT is a method of analyzing the tasks involved in completing a given project, especially the time needed to complete each task, and to identify the minimum time needed to complete the total project. It incorporates uncertainty by making it possible to schedule a project while not knowing precisely the details and durations of all the activities. It is more of an event-oriented technique rather than start- and completion-oriented, and is used more in projects where time is the major factor rather than cost. It is applied to very large-scale, one-time, complex, non-routine infrastructure and Research and Development projects. 9
")
PERT scope l l l PERT processes data representing the major, finite accomplishments (events) essential to achieve endobjectives; and estimates of time and range of time necessary to complete each activity between two successive events. Such time expectations include estimates of "most likely time", "optimistic time", and "pessimistic time" for each activity. Sometimes, people categorize and put PERT and CPM together. Although CPM (Critical Path Method) shares some characteristics with PERT, PERT has a different focus. 10

PERT Basics l l At the core, PERT is all about management probabilities. Therefore, PERT involves simple statistical methods as well. Same as most of other estimation techniques, PERT also breaks down the tasks into detailed activities. l l l Then, a Gantt chart will be prepared illustrating the interdependencies among the activities. Then, a network of activities and their interdependencies are drawn. Next, the Earliest Time (TE) and the Latest Time (TL) are figured for each activity and identify the slack time for each activity. 11

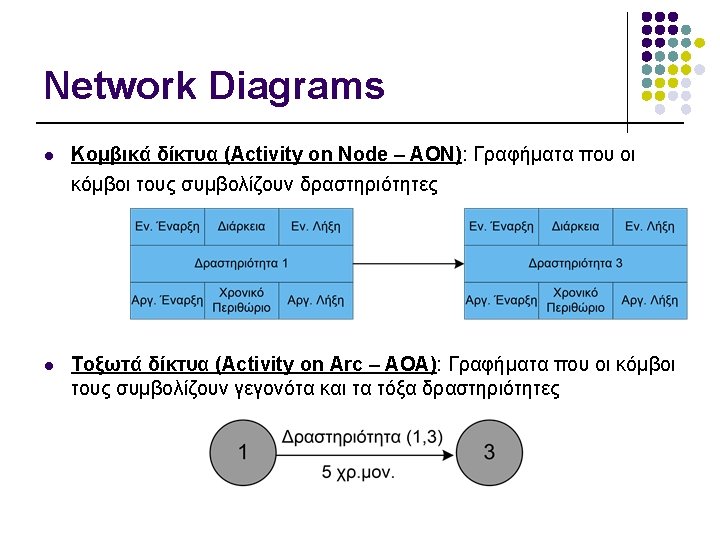
PERT Diagrams Both Ao. N and Ao. A notations may be used for drawing the network of activities. 12

Propabilities l There are three estimation times involved in PERT; l l l Optimistic Time Estimate (Topt), Most Likely Time Estimate (Tprob, and Pessimistic Time Estimate (Tpess). In PERT, these three estimate times are derived or estimated for each activity. This way, a range of time is given for each activity with the most probable value, Tprob. 13

PERT Mathematics l BETA probability distribution is what works behind PERT. l The expected completion time (E) is calculated as below: l E = (Topt + 4 x Tprob + Tpess) / 6 14
 of the estimate")
PERT Mathematics l At the same time, the possible variance (V) of the estimate is calculated as below: l l V = (Tpess - Topt)2 / 62 Now, following is the process we follow with the two values: l l For every activity in the critical path, E and V are calculated. Then, the total of all Es are taken. This is the overall expected completion time for the project. 15

PERT Mathematics l l Now, the corresponding Variance is added to each activity of the critical path. This is the variance for the entire project. This is done only for the activities in the critical path as only the critical path activities can accelerate or delay the project duration. Then, the standard deviation of the project is calculated. l l This equals to the square root of the variance (V). Subsequently, the normal probability distribution is used for calculating the project completion time with the desired probability. 16
 Εξαρτήσεις (Immediate Predecessor) Αισιόδοξη εκτίμηση (Optimistic) (Topt) Πλέον")
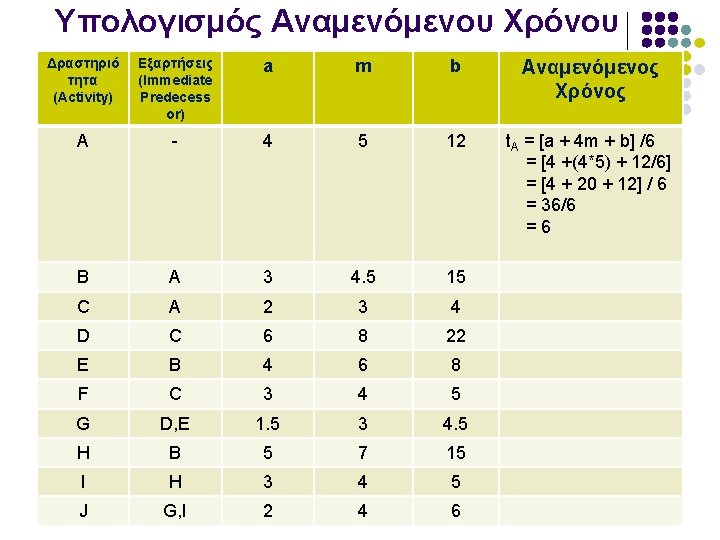
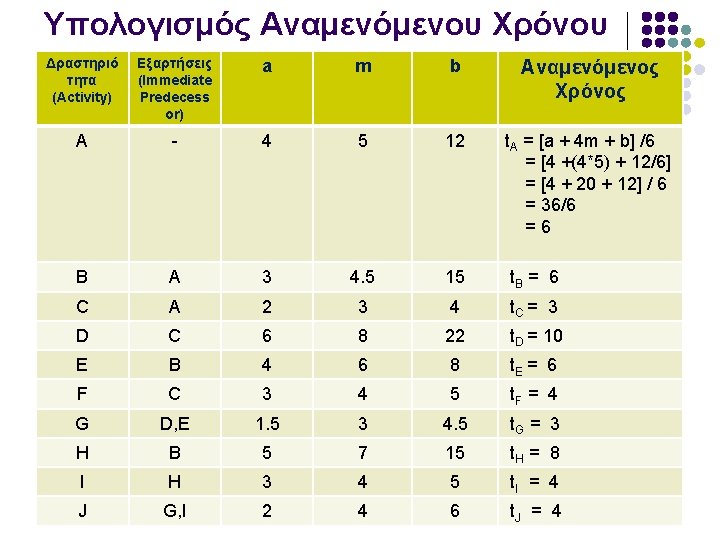
PERT - Example Δραστηρι ότητα (Activity) Εξαρτήσεις (Immediate Predecessor) Αισιόδοξη εκτίμηση (Optimistic) (Topt) Πλέον πιθανή εκτίμηση (Most Probable) (Tprob) Απαισιόδοξη εκτίμηση (Pessimistic) (Tpess) A - 4 5 12 B A 3 4. 5 15 C A 2 3 4 D C 6 8 22 E B 4 6 8 F C 3 4 5 G D, E 1. 5 3 4. 5 H B 5 7 15 I H 3 4 5 J G, I 2 4 6 17

Estimation of expected project duration l Expected time is given by: ti = Where l l a = optimistic estimate m = most likely estimate b = pessimistic estimate i = activity no 18

Άσκηση … l Estimate the expected time duration for activities D and G. l l 5 minutes Draw the network l 10 minutes 20

Διάγραμμα PERT H S T A R T B I E A G C E N D J D F 22

PERT – Network Diagram H S T A R T B A C E I G J E N D D F 23

Forward Pass 12 8 20 H 6 S t a r t 20 4 24 I 6 12 B 12 6 18 E 0 6 6 A 6 3 9 C 19 3 22 G Max 24 4 28 J E n d 9 10 19 D 9 4 13 F 24

Backward Pass 6 6 12 B 6 12 S t a r t 0 6 6 A 0 6 6 3 9 C 11 8 Min 12 8 20 H 12 20 12 6 18 E 21 15 20 4 24 I 24 20 19 3 22 G 24 21 24 4 28 J 24 28 E n d 9 10 19 D 21 11 9 4 13 F 24 28 25

Slack 6 6 12 B 6 0 12 S t a r t 0 6 6 A 0 0 6 6 3 9 C 8 2 11 12 8 20 H 12 0 20 12 6 18 E 21 15 20 4 24 I 20 0 24 19 3 22 G 21 2 24 24 4 28 J 24 0 28 E n d 9 10 19 D 11 2 21 9 4 13 F 24 15 28 26

Critical Path 6 6 12 B 6 0 12 S t a r t 0 6 6 A 0 0 6 6 3 9 C 8 2 11 12 8 20 H 12 0 20 12 6 18 E 21 15 20 4 24 I 20 0 24 19 3 22 G 21 2 24 24 4 28 J 24 0 28 E n d 9 10 19 D 11 2 21 9 4 13 F 24 15 28 27

")
Uncertainty Propabilities Optimistic Time Most Likely Time Estimate Pessimistic Time Estimate (Topt or a) (Tprob or m) (Tpess or b). 31
 a m b A 1 2 3 B 2 3 4")
PERT Δρασ/τα (Activity) a m b A 1 2 3 B 2 3 4 C 1 2 3 D 2 4 6 E 1 4 7 F 1 2 9 G 3 4 11 H 1 2 3 tαναμενόμενος (texpected) Variance 32

PERT – Time Estimate Activity a m b A 1 2 3 B 2 3 4 C 1 2 3 D 2 4 6 E 1 4 7 F 1 2 9 G 3 4 11 H 1 2 3 t expected Variance 33

PERT – Time Estimate Activity a m b t expected A 1 2 3 2 B 2 3 4 3 C 1 2 3 2 D 2 4 6 4 E 1 4 7 4 F 1 2 9 3 G 3 4 11 5 H 1 2 3 2 Variance The duration of each activity is an estimate. Therefore, it is logical that there is a Variance in this estimate. 34

Estimation of Variance Activity a m b t expected A 1 2 3 2 B 2 3 4 3 C 1 2 3 2 D 2 4 6 4 E 1 4 7 4 F 1 2 9 3 G 3 4 11 5 H 1 2 3 2 Variance 35

Estimation of Variance Activity a m b t expected Variance A 1 2 3 2 . 11 B 2 3 4 3 . 11 C 1 2 3 2 D 2 4 6 4 E 1 4 7 F 1 2 9 G 3 4 H 1 2 Variance 4 V = ( ( b – a) / 6)2 3 A 11 = ( (3 – 1) /5 6) 2 = (2/6)2 =. 11 B 3= ( ( 4 – 2)2/ 6) 2 = (2/6) 2 =. 11 36

Estimation of Variance Δρασ/τα a m b t αναμ/νος Variance A 1 2 3 2 . 11 B 2 3 4 3 . 11 C 1 2 3 2 . 11 D 2 4 6 4 . 44 E 1 4 7 4 1 F 1 2 9 3 1. 78 G 3 4 11 5 1. 78 H 1 2 3 2 . 11 37

Critical Path and Project Duration Δρασ/τα a m b A 1 2 3 B 2 3 C 1 t αναμ/νος Variance 2 . 11 3 . 11 2 3 2 We want to estimate the . 11 Project Variance : 6 4 . 44 Assumptions: 4 The Critical path is ACEGH D 2 4 E 1 4 7 4 1 F 1 2 9 3 1. 78 G 3 4 11 5 1. 78 H 1 2 3 2 . 11 Project Duration = Sum of duration of critical activities = 2 + 4 + 5+ 2 = 15 38

Δρασ/τα a m b t αναμ/νος Variance A 1 2 3 2 . 11 B 2 3 4 3 . 11 C 1 2 3 2 . 11 D 2 4 6 4 . 44 E 1 4 7 4 1 F 1 2 9 3 1. 78 G 3 4 11 5 1. 78 H 1 2 3 2 . 11 39

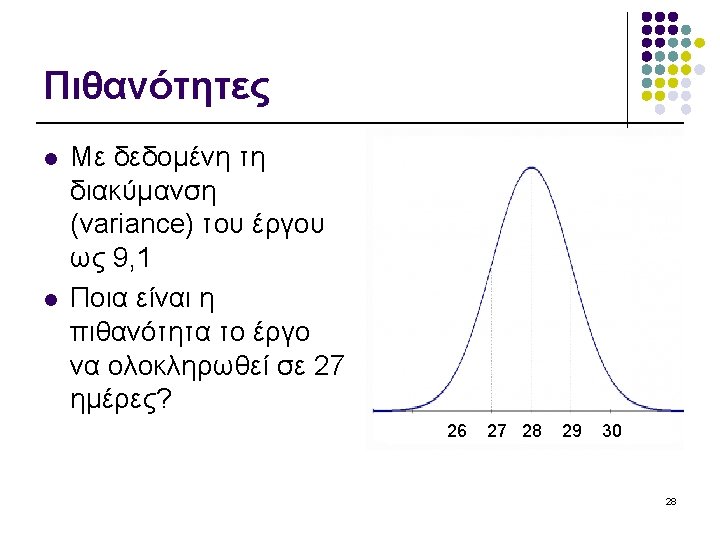
What does it mean? l Our project will have a “variance” of + or – 3, 11 and a standard deviation of 1, 76 weeks 40

Example & Estimates l l l Critical Path = 15 weeks. Standard Deviation = + 1. 76 Delivery Time = 16 weeks Your manager wants to know “what is the probability to complete the project within the available time” Well, Sir. If I had to take a scientifically wild guess, I would say we have about 82% chance to getting this project completed on time What would your answer be? 42

Z score l l l In order to be able to answer with accuracy we need to estimate the Z (statistical) score, given by: l l Should remember P(-z) = 1 - P(z) Z = (Due Date – Expected Date) / σp Z = (16 – 15) / 1. 76 = 0. 57 43

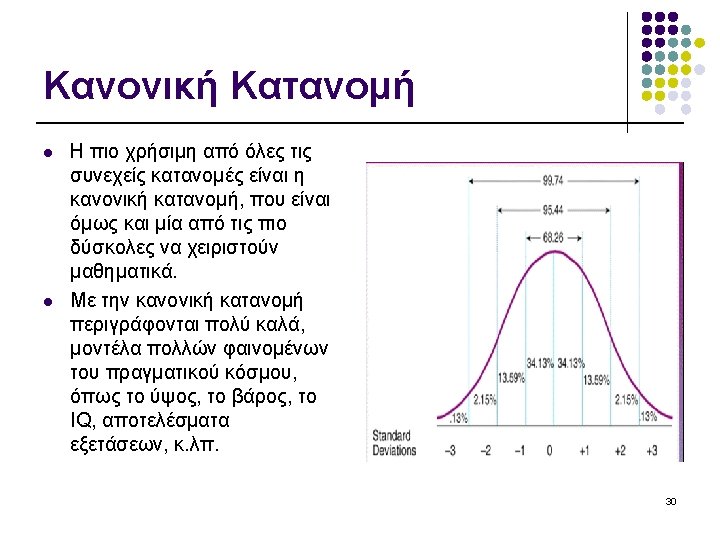
What is a Z-Score? l l Simply put, a z-score is the number of standard deviations from the mean a data point is. But more technically it’s a measure of how many standard deviations below or above the population mean a raw score is. A z-score is also known as a standard score and it can be placed on a normal distribution curve. Z-scores range from -3 standard deviations (which would fall to the far left of the normal distribution curve) up to +3 standard deviations (which would fall to the far right of the normal distribution curve). In order to use a z-score, you need to know the mean μ and also the population standard deviation σ. 44
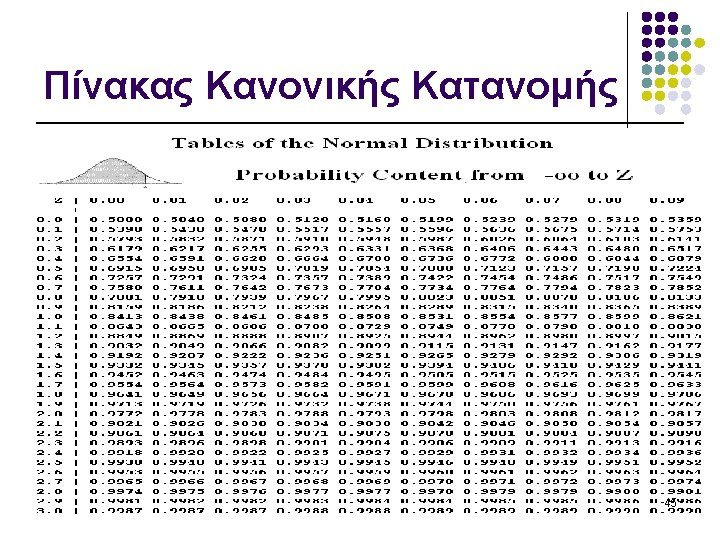
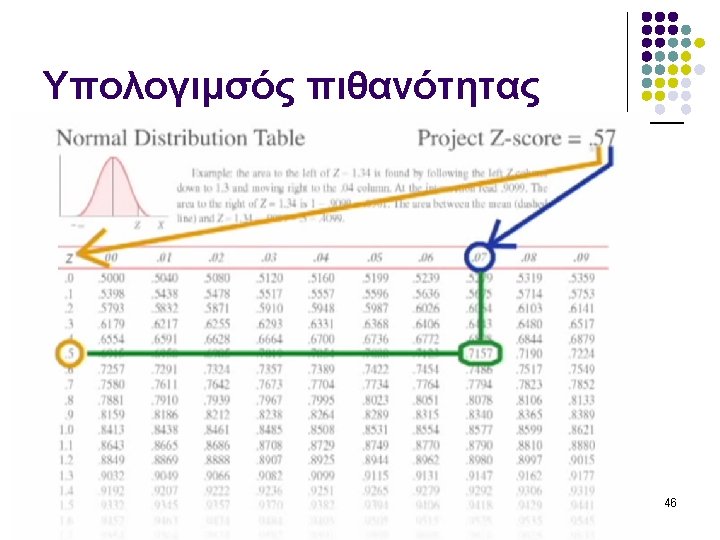

What does it mean? l It means that there is a 0, 7157 probability (71. 57%) to complete the project until the 16 th week. l l Is there a reason to worry? Obviously, since there is 28, 43% probability for not competing the project within the available time. 47

Project Crashing l l The question, hence becomes, is there anything we can do to reduce the time required (cut short) for the Project completion? If Yes, what is it? 48

Project Crashing l l Crashing is a schedule compression technique used to reduce or shorten the project schedule. Various measures can be used to accomplish this goal. Some of the common methods used are: l l Adding additional resources to the critical path tasks This option has various constraints such as the securing of the budget to add the resources, and the availability of the resources. Reduce the project requirements or scope This can be done only if the sponsor and major stakeholders agree to reduce the scope 49

Q&A 50
- Slides: 50