
Formulating the Hypothesis 4 The null hypothesis is

- Slides: 18
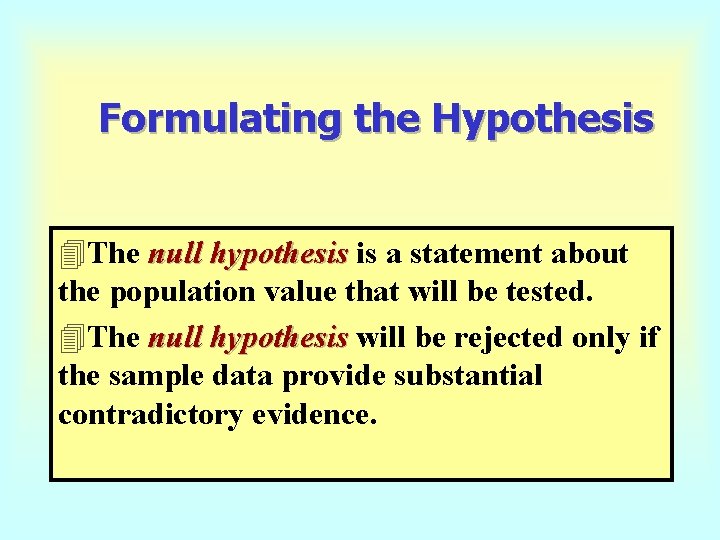
Formulating the Hypothesis 4 The null hypothesis is a statement about the population value that will be tested. 4 The null hypothesis will be rejected only if the sample data provide substantial contradictory evidence.
Formulating the Hypothesis 4 The alternative hypothesis is the hypothesis that includes all population values not covered by the null hypothesis. 4 The alternative hypothesis is deemed to be true if the null hypothesis is rejected.
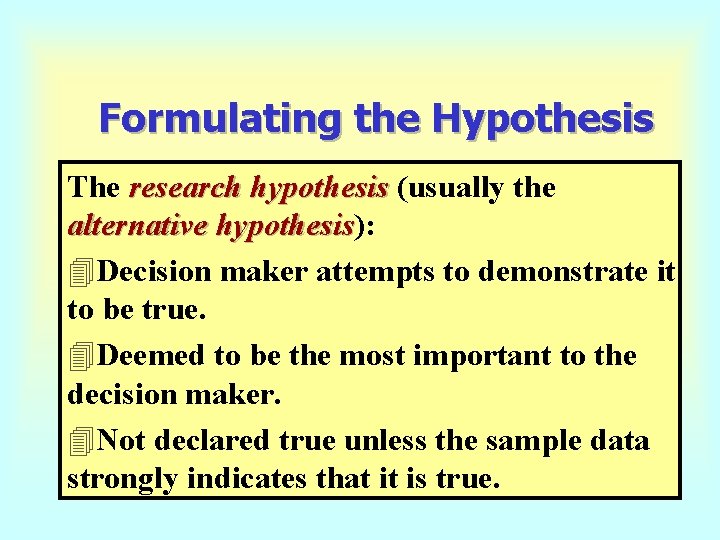
Formulating the Hypothesis The research hypothesis (usually the alternative hypothesis): hypothesis 4 Decision maker attempts to demonstrate it to be true. 4 Deemed to be the most important to the decision maker. 4 Not declared true unless the sample data strongly indicates that it is true.
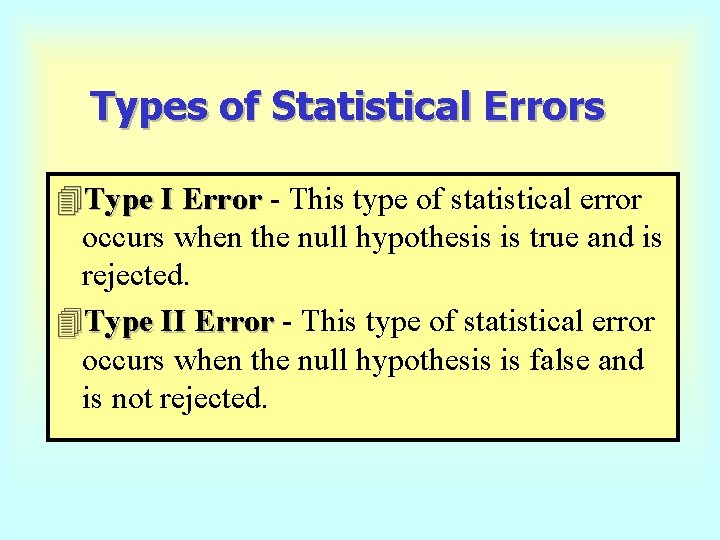
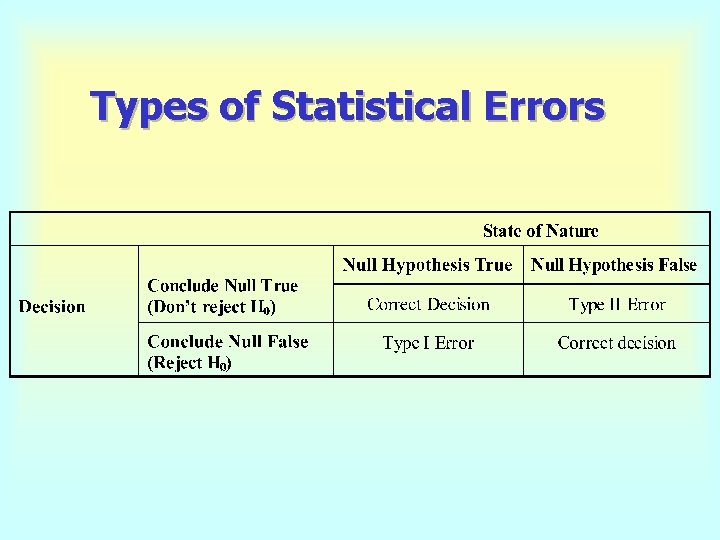
Types of Statistical Errors 4 Type I Error - This type of statistical error occurs when the null hypothesis is true and is rejected. 4 Type II Error - This type of statistical error occurs when the null hypothesis is false and is not rejected.
Types of Statistical Errors
Establishing the Decision Rule The critical value is 4 Determined by the significance level. 4 The cutoff value for a test statistic that leads to either rejecting or not rejecting the null hypothesis.
Establishing the Decision Rule The significance level is the maximum probability of committing a Type I statistical error. The probability is denoted by the symbol .
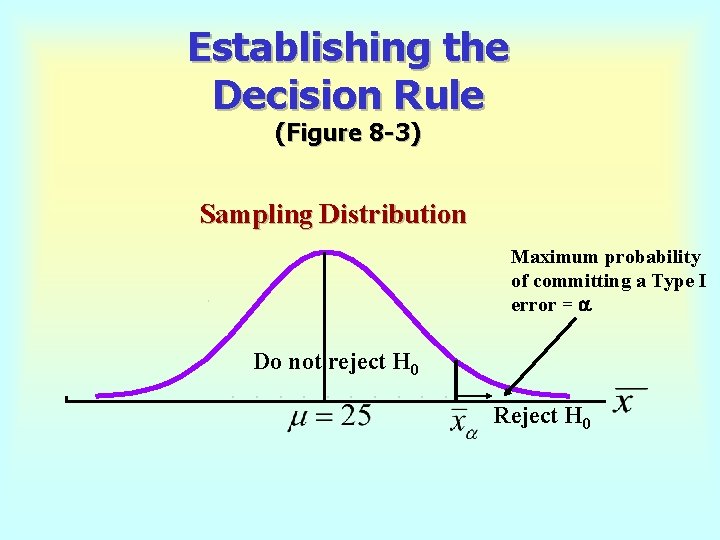
Establishing the Decision Rule (Figure 8 -3) Sampling Distribution Maximum probability of committing a Type I error = Do not reject H 0 Reject H 0
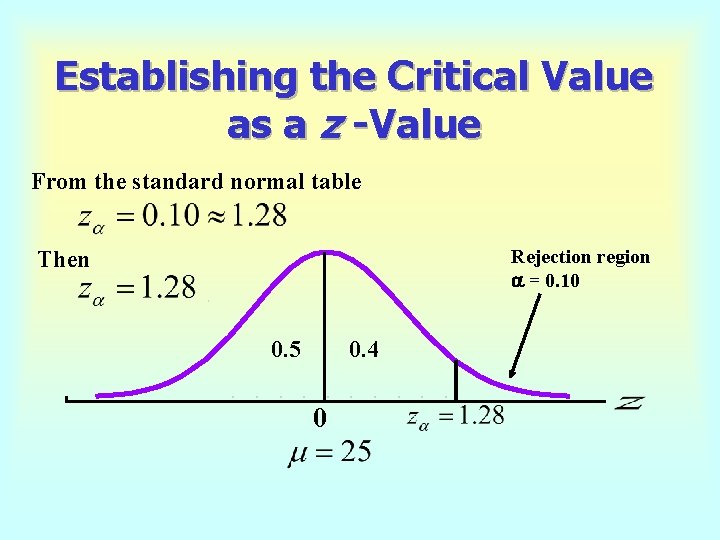
Establishing the Critical Value as a z -Value From the standard normal table Rejection region = 0. 10 Then 0. 5 0. 4 0
Establishing the Decision Rule The test statistic is a function of the sampled observations that provides a basis for testing a statistical hypothesis.
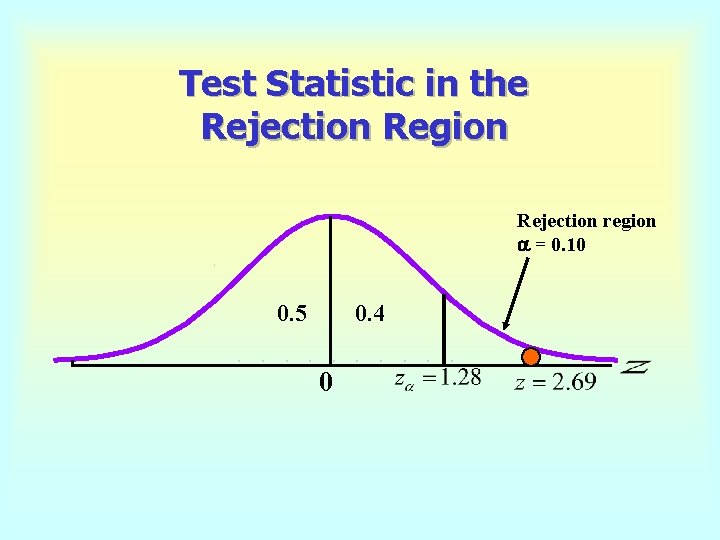
Test Statistic in the Rejection Region Rejection region = 0. 10 0. 5 0. 4 0
Establishing the Decision Rule The p-value is 4 The probability of obtaining a test statistic at least as extreme as the test statistic we calculated from the sample. 4 Also known as the observed significance level.
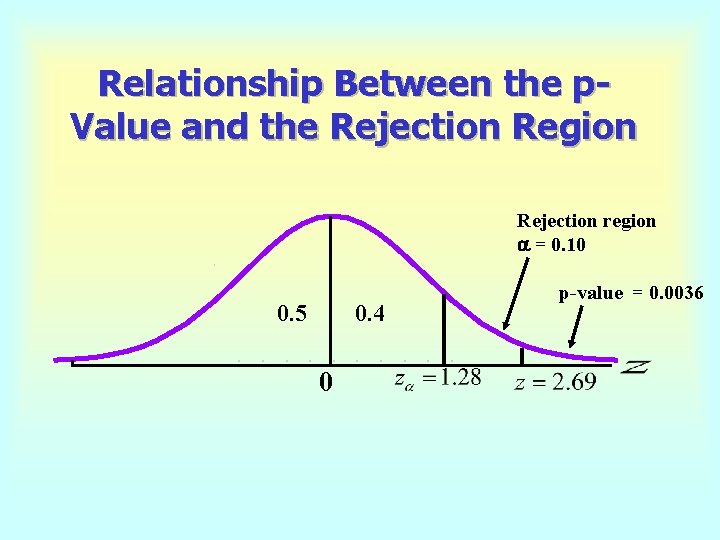
Relationship Between the p. Value and the Rejection Region Rejection region = 0. 10 0. 5 0. 4 0 p-value = 0. 0036
Using the p-Value to Conduct the Hypothesis Test 4 If the p-value is less than or equal to a, a reject the null hypothesis. 4 If the p-value is greater than a, a do not reject the null hypothesis. Example: For a = 0. 05 with the p-value = 0. 02 for a particular test, then the null hypothesis is rejected.
One-Tailed Hypothesis Tests A one-tailed hypothesis test is a test in which the entire rejection region is located in one tail of the test statistic’s distribution.
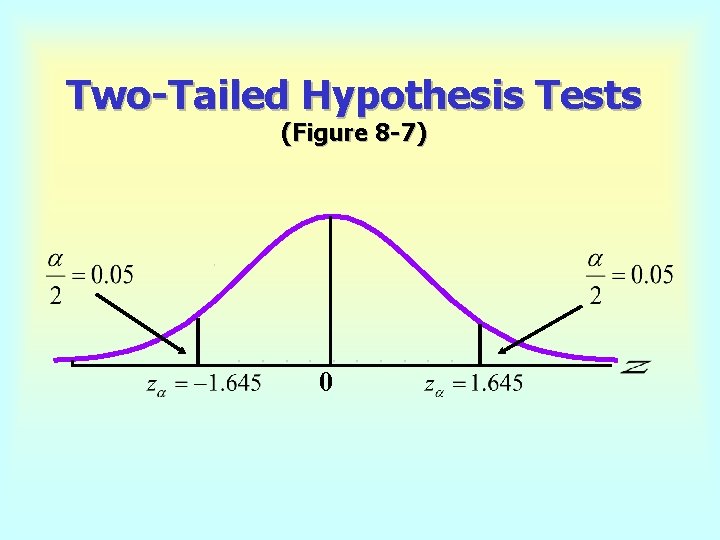
Two-Tailed Hypothesis Tests A two-tailed hypothesis test is a test in which the rejection region is split between the two tails of the test statistic’s distribution.
Two-Tailed Hypothesis Tests (Figure 8 -7) 0
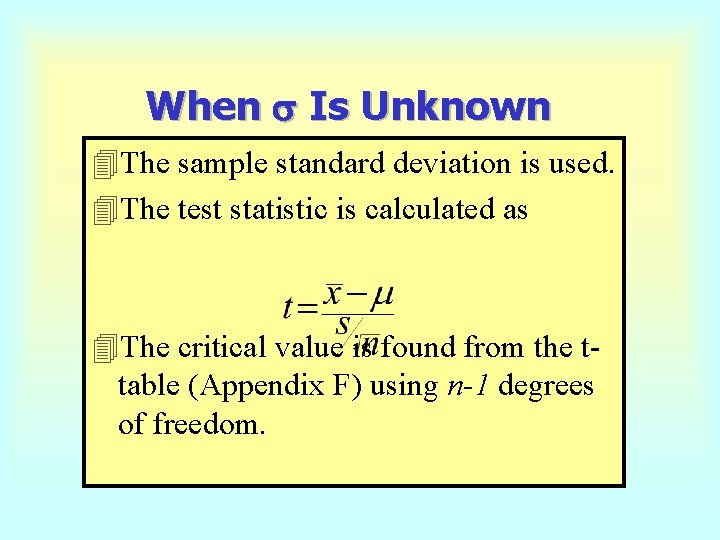
When s Is Unknown 4 The sample standard deviation is used. 4 The test statistic is calculated as 4 The critical value is found from the ttable (Appendix F) using n-1 degrees of freedom.