
Formulating a Research Topic Abhinay Sawant February 18

Formulating a Research Topic Abhinay Sawant February 18, 2009 Economics 201 FS
Update from Last Time l Fixed programs: l l Z-Scores Tri-Power Quarticity Realized Volatility Signature Plots Still Coarse Sampling: l l Currently, sampling frequency = 8 min Should be changed to 5 minutes in future with averaging
Homogeneity of Jumps
Homogeneity of Jumps

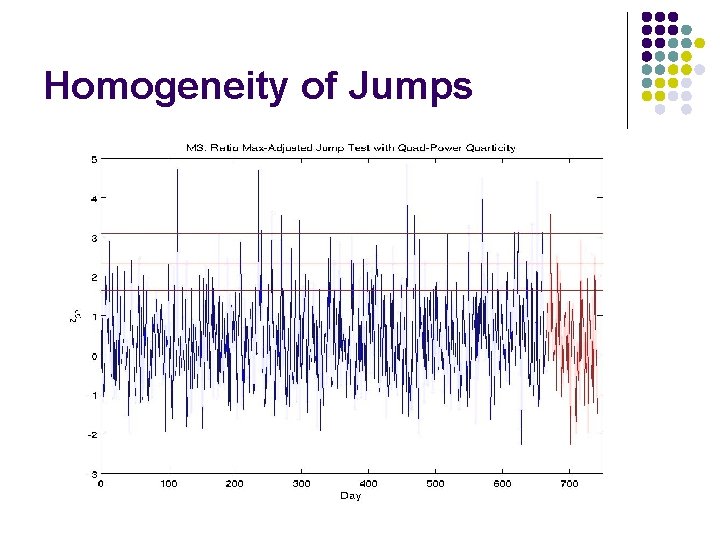
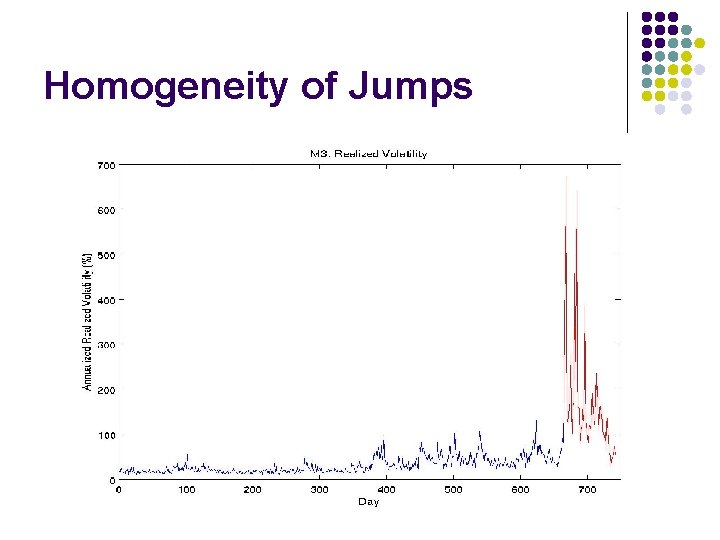
Homogeneity of Jumps l Let X 1, X 2, …, Xn be Bernoulli trials with probability p of success where success is defined as a jump day l Goal is to estimate p for pre-Lehman (1/1/06 – 9/12/08) and post-Lehman periods (9/15/08 – 1/7/09) l Conduct a t-Test to determine if a significance difference exists in parameter p in the two periods for individual equities
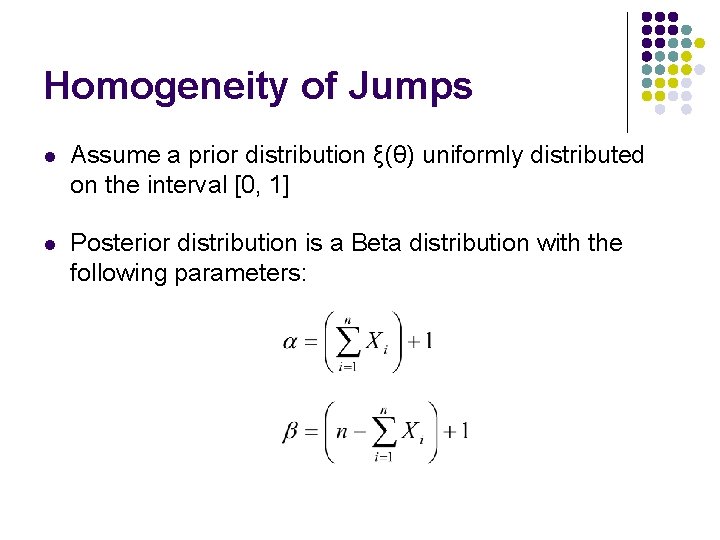
Homogeneity of Jumps l Assume a prior distribution ξ(θ) uniformly distributed on the interval [0, 1] l Posterior distribution is a Beta distribution with the following parameters:
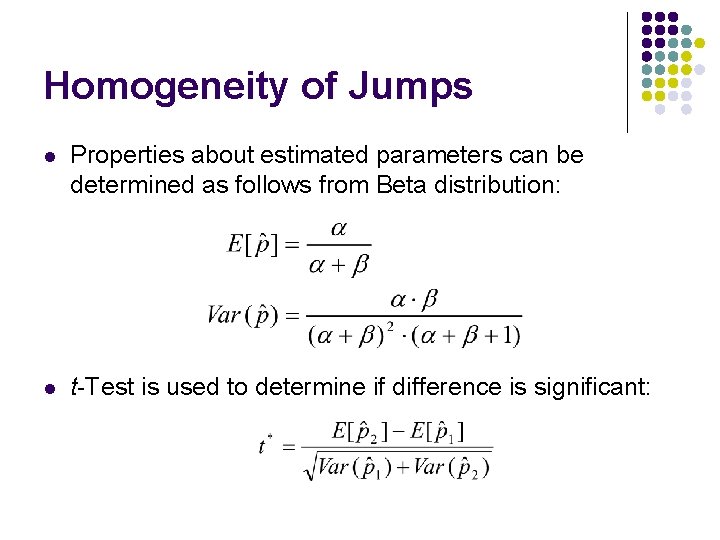
Homogeneity of Jumps l Properties about estimated parameters can be determined as follows from Beta distribution: l t-Test is used to determine if difference is significant:
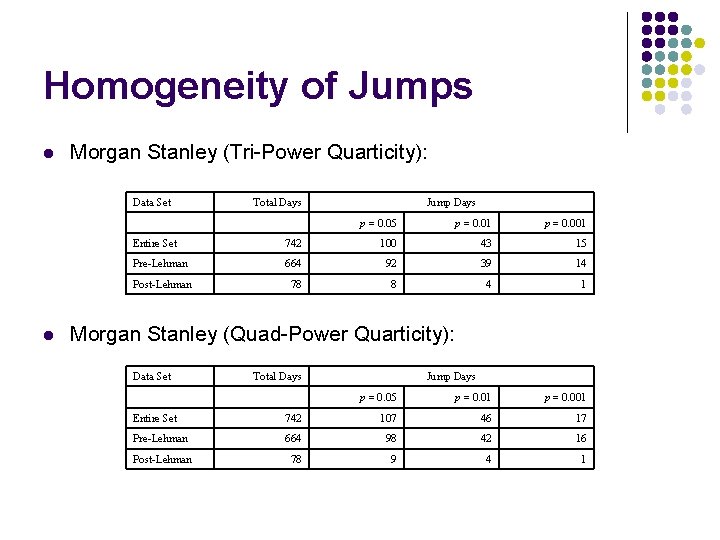
Homogeneity of Jumps l Morgan Stanley (Tri-Power Quarticity): Data Set l Total Days Jump Days p = 0. 05 p = 0. 01 p = 0. 001 Entire Set 742 100 43 15 Pre-Lehman 664 92 39 14 Post-Lehman 78 8 4 1 p = 0. 05 p = 0. 01 p = 0. 001 Morgan Stanley (Quad-Power Quarticity): Data Set Total Days Jump Days Entire Set 742 107 46 17 Pre-Lehman 664 98 42 16 Post-Lehman 78 9 4 1
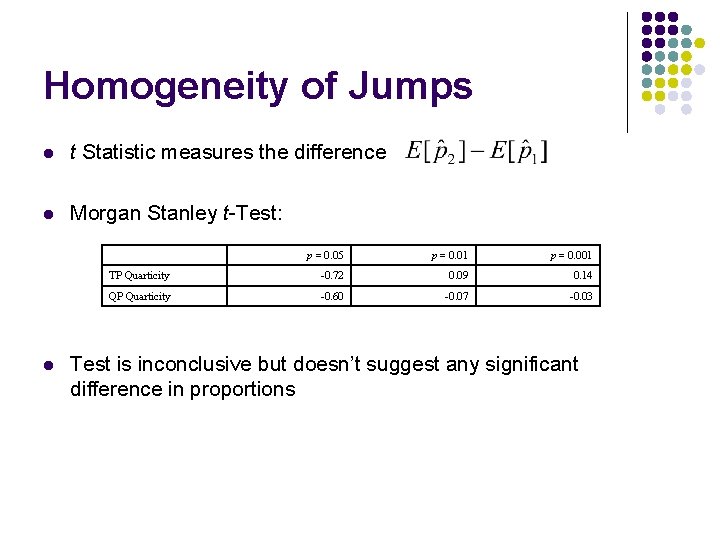
Homogeneity of Jumps l t Statistic measures the difference l Morgan Stanley t-Test: l p = 0. 05 p = 0. 01 p = 0. 001 TP Quarticity -0. 72 0. 09 0. 14 QP Quarticity -0. 60 -0. 07 -0. 03 Test is inconclusive but doesn’t suggest any significant difference in proportions
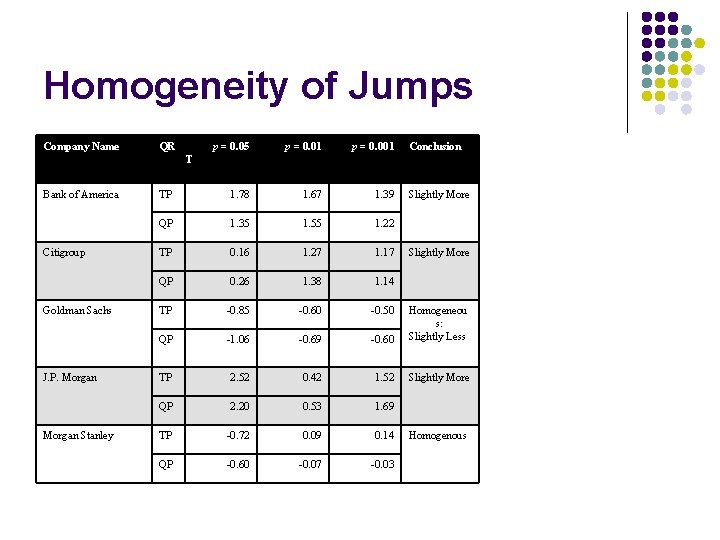
Homogeneity of Jumps Company Name QR p = 0. 05 p = 0. 01 p = 0. 001 Conclusion TP 1. 78 1. 67 1. 39 QP 1. 35 1. 55 1. 22 TP 0. 16 1. 27 1. 17 QP 0. 26 1. 38 1. 14 TP -0. 85 -0. 60 -0. 50 QP -1. 06 -0. 69 -0. 60 Homogeneou s: Slightly Less TP 2. 52 0. 42 1. 52 Slightly More QP 2. 20 0. 53 1. 69 TP -0. 72 0. 09 0. 14 QP -0. 60 -0. 07 -0. 03 T Bank of America Citigroup Goldman Sachs J. P. Morgan Stanley Slightly More Homogenous
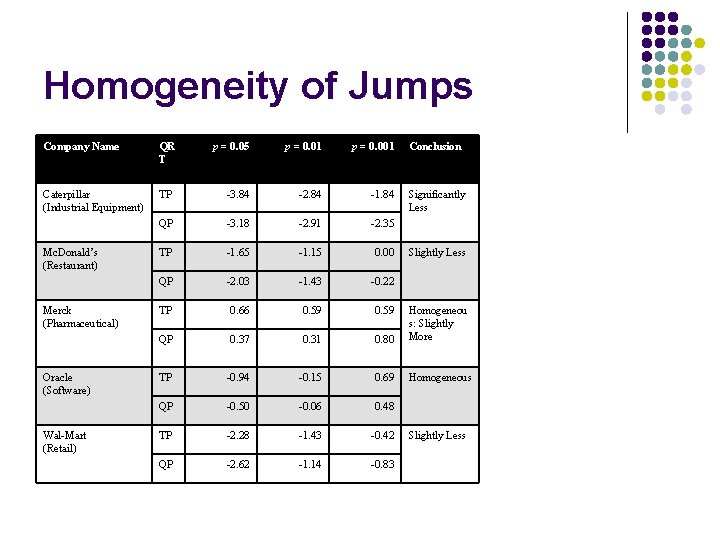
Homogeneity of Jumps Company Name QR T Caterpillar (Industrial Equipment) Mc. Donald’s (Restaurant) Merck (Pharmaceutical) Oracle (Software) Wal-Mart (Retail) p = 0. 05 p = 0. 01 p = 0. 001 Conclusion TP -3. 84 -2. 84 -1. 84 QP -3. 18 -2. 91 -2. 35 TP -1. 65 -1. 15 0. 00 QP -2. 03 -1. 43 -0. 22 TP 0. 66 0. 59 QP 0. 37 0. 31 0. 80 Homogeneou s: Slightly More TP -0. 94 -0. 15 0. 69 Homogeneous QP -0. 50 -0. 06 0. 48 TP -2. 28 -1. 43 -0. 42 QP -2. 62 -1. 14 -0. 83 Significantly Less Slightly Less
Other Properties of Jumps
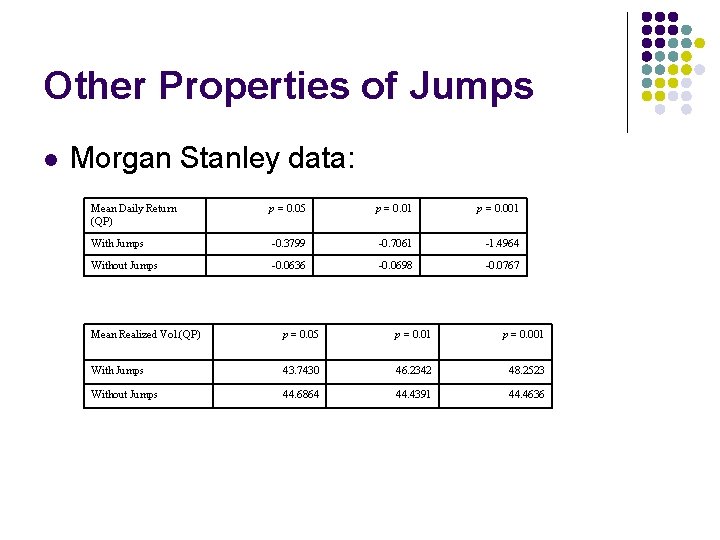
Other Properties of Jumps l Morgan Stanley data: Mean Daily Return (QP) p = 0. 05 p = 0. 01 p = 0. 001 With Jumps -0. 3799 -0. 7061 -1. 4964 Without Jumps -0. 0636 -0. 0698 -0. 0767 Mean Realized Vol. (QP) p = 0. 05 p = 0. 01 p = 0. 001 With Jumps 43. 7430 46. 2342 48. 2523 Without Jumps 44. 6864 44. 4391 44. 4636
Other Properties of Jumps

Alternative Research Topics Portfolio Risk l Constructing 2 -asset portfolios and how does volatility change? l Realized Covariance: l How does investment process change for timedependent volatility and correlation?

Alternative Research Topics Risk Management l Incorporating time-dependent volatility for Va. R model
- Slides: 16