Forest Fires in Europe an overview Paulo Barbosa

Forest Fires in Europe: an overview Paulo Barbosa Joint Research Centre – European Commission Institute for Environment and Sustainability 21020 Ispra (VA), Italy http: //natural-hazards. jrc. it

European Forest Fire Information System EFFIS Objectives: • Support the existing European Commission regulation Forest Focus on forest fires Customer/users: • Customer DGs: DG ENV, DG REGIO • Users: Civil Protection Services, Forest Fire Services, Environmental Services

European Forest Fire Information System EFFIS Modules Fuel/Biomass Fire Risk Burnt Areas Products: • Cartography • Tables Risk zoning • Statistics CO 2 emissions Regeneration Common Core Database (Forest Focus) Customer and user: EP Member States EC
 Existing information on forest fires events collected by")
Common Core Database (since early 80’s) Existing information on forest fires events collected by the Countries • Number of fires • Fire location (commune level) • Date: start (first alarm) / end • Time of intervention / Time of extinction • Burnt area: forest / non-forest • Cause (unknown, natural, accident, deliberate)

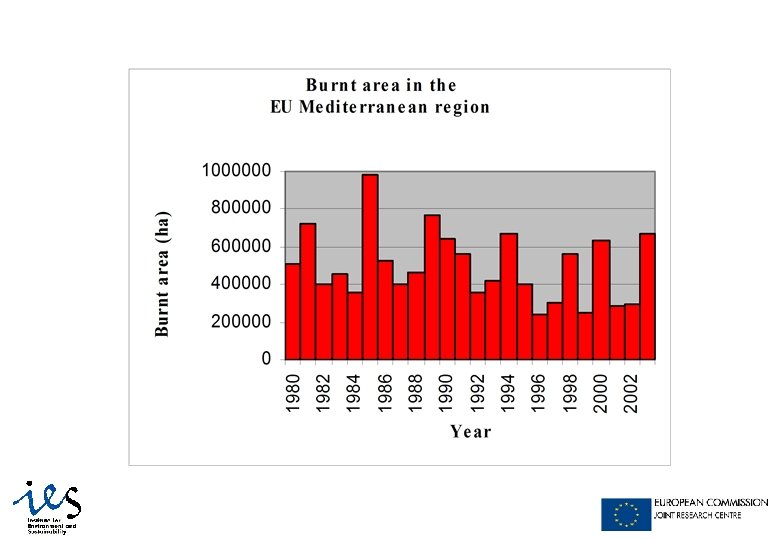
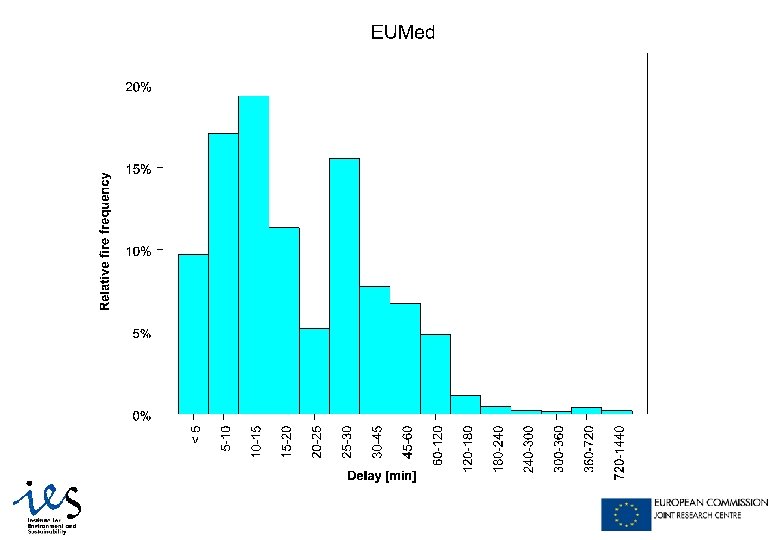
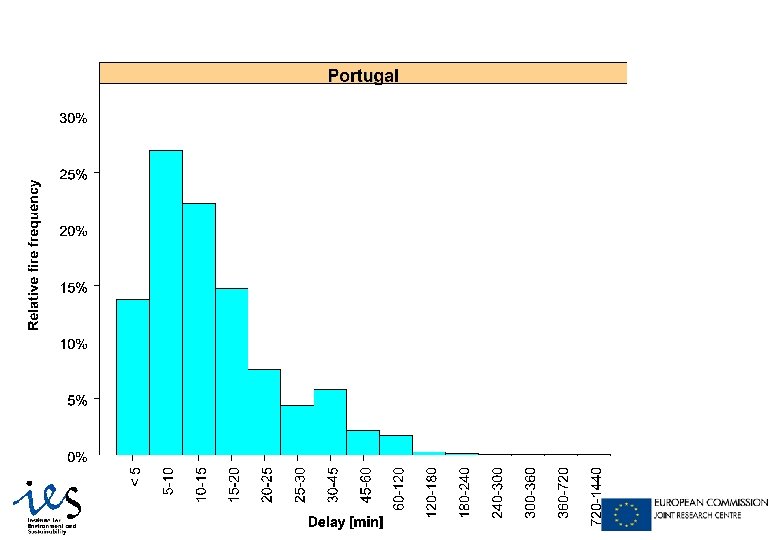
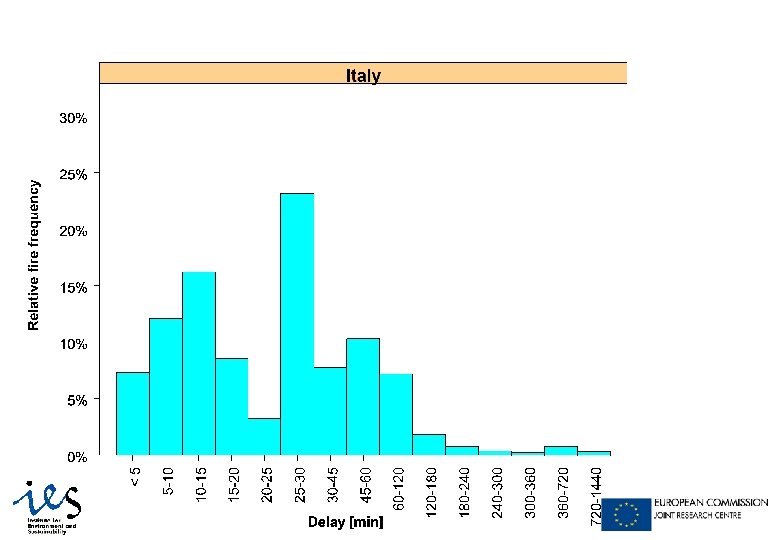
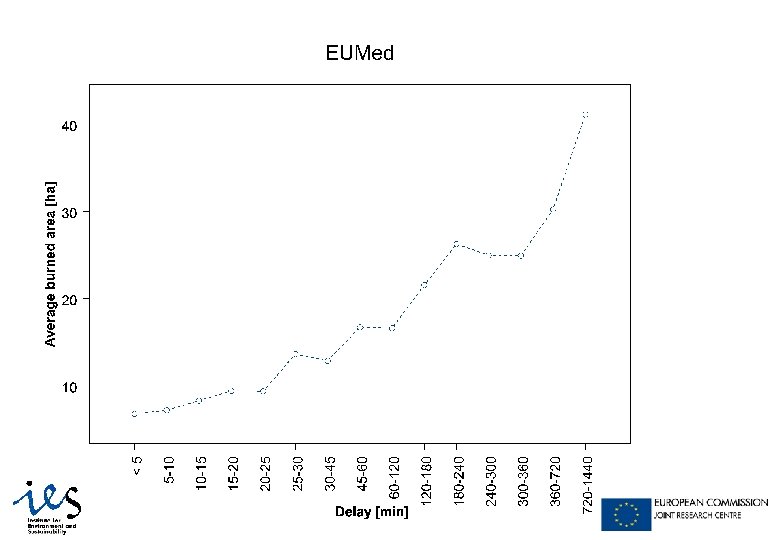
Some Statistics l In average around 500 000 ha burn per year throughout Southern Europe (P, E, F, I, EL). l Around 96% of the fires are human caused l > 50% of the fires start between 12: 00 and 18: 00 h > 50% of the burnt area is burned in the same period l l 50% of the fires have a delay of less than 15 minutes between fire detection and initial attack l The average final size of a fire after an initial attack delay of 15 minutes is ~ 8 ha

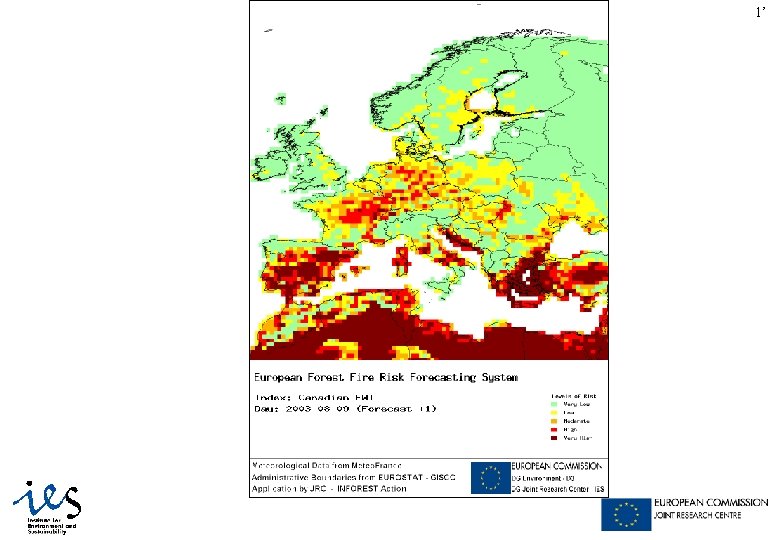
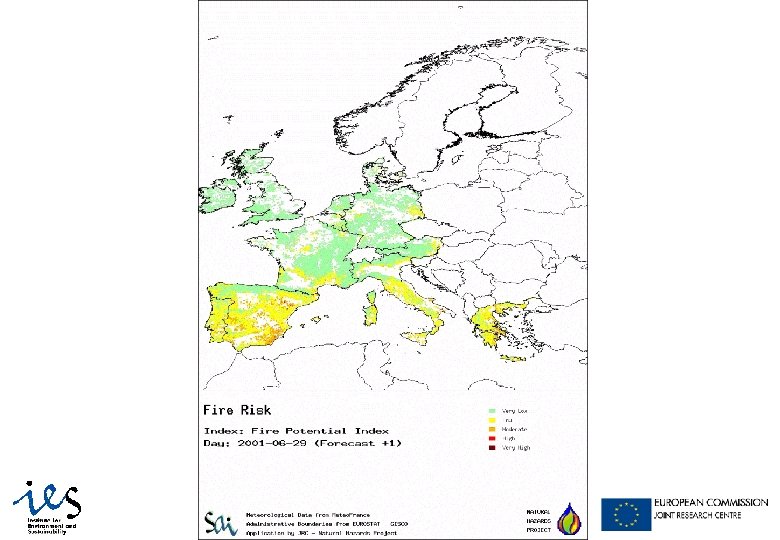
1’ Forest Fires and Remote Sensing Applications in Europe • Pre-fire (fuels mapping, risk mapping) • During fire (Detection, Monitoring, smoke management ) • Post-fire (Burnt Area Mapping, fire emissions)

Fuel Maps: e. g. Prometheus Fuel Models

Fire Detection and monitoring l AVHRR l ATSR l MODIS l Most of these fire products show a more or less large overestimation of fire detections (false alarms) in Southern Europe They are only a sample due to reduced number of daily acquisitions l
 Range Spatial Res (Km)EU HRV 0.")
MSG data Channel Bands ID Wavelength Bandwidth (µm) Range Spatial Res (Km)EU HRV 0. 75 0. 6 to 0. 9 0 - 459 W/m 2 sr µm ~2 0. 635 0. 56 to 0. 71 0 - 533 W/m 2 sr µm 4 -6 VIS 0. 81 0. 74 to 0. 88 0 - 357 W/m 2 sr µm 4 -6 IR 1. 64 1. 50 to 1. 78 0 - 75 W/m 2 sr µm 4 -6 3. 92 3. 48 to 4. 36 0 - 335 K 4 -6 IR 8. 70 8. 30 to 9. 10 0 - 300 K 4 -6 IR 10. 80 9. 80 to 11. 80 0 - 335 K 4 -6 IR 12. 00 11. 00 to 13. 00 0 - 335 K 4 -6 6. 25 5. 35 to 7. 15 0 - 300 K 4 -6 7. 35 6. 85 to 7. 85 0 - 300 K 4 -6 VIS 0. 6 IR 3. 9 IR 6. 2 Visible & NIR IR / Window Water vapour IR 7. 3 IR 9. 7 IR / Ozone 9. 66 9. 38 to 9. 94 0 - 310 K 4 -6 IR 13. 4 IR / CO 2 13. 40 12. 40 to 14. 40 0 - 300 K 4 -6

Fire Detection Requirements PROPERTY USER REQUIREMENT MSG Detection time 15 – 20 minutes 15 minutes Minimum detected fire 50 m 2 (0. 005 ha) 0. 06 – 0. 5 ha ? Geo-location accuracy 300 – 500 meters 0. 5 pixels ? Alarm classification Intensity Fire Radiative Energy False alarm discrimination 5 – 15 % Diurnal Cycle+ saturation

Smoke Dispersion l MSG can be used for tracking smoke dispersion l MSG can be used to calibrate smoke dispersion models (SPREAD Project)
 l IRS Wi. FS (>")
Burnt Area Mapping l Landsat TM (> 1 ha) l IRS Wi. FS (> 50 ha) l IRS AWIFS (> 5 ha) l MSG…. . ?
 % of total burned")
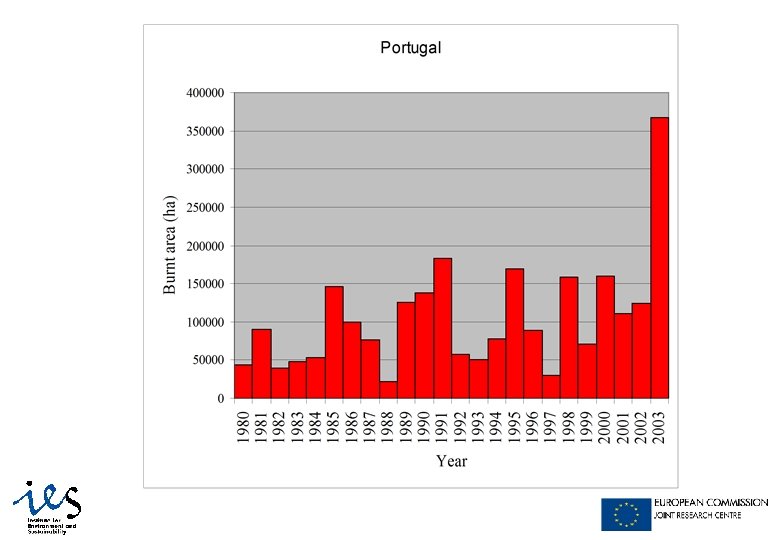
BURNT AREA AND DAMAGE ASSESSMENT: PORTUGAL 2003 Area burnt (ha) % of total burned Agriculture 45206 11. 9 Forest land 323009 85. 2 Barren 8996 2. 4 Social 1827 0. 5 379038 100. 0 Land use Total

Fire emissions l MSG useful for fire emission estimates? l Sugested use of Fire Radiative Energy as a surrogate of Burned Biomass (Flasse, Roberts)
 Bv biomass (g m-2) C burning efficiency (g g-1)")
Av burned area (m 2) Bv biomass (g m-2) C burning efficiency (g g-1) Evemission coefficient for CO 2 Regional estimates of CO 2 emissions
- Slides: 23