Forecasting Weather Forecasting Weather Now that Meteorologists understand


 • • From the")
 – warm, humid air masses that")
 – Hot, dry air masses that")


 that contain rising")


- Slides: 33
Forecasting Weather
Forecasting Weather • Now that Meteorologists understand the factors that affect weather they must put all of this together to create weather maps and to determine weather patterns. – Together weather maps and weather patterns are very helpful in forecasting the weather.
Weather Maps • Graphically show temperature, barometric pressure, wind speed/direction, cloud cover and relative humidity. – Also shows: • Air masses • Fronts • hazardous conditions – Created by putting together data from thousands of weather stations from all across the world.
Weather Map
Map Symbols • Map symbols are used to help identify the conditions reported from each weather station.
Other Symbols
Weather Movement • Weather moves from areas of high pressure to areas of low pressure within air masses. – A huge body of air that has similar temperature, humidity and air pressure throughout it. • Classified by two characteristics: 1. Temperature 2. humidity • Warm or cold air masses depend on the temperature of the region over which the air mass forms.
Air Masses • 4 general air masses 1. Polar (P) • • From the poles to 60° N or S latitude. Very cold air mass. 2. Tropical (T) • • From the equator to 25° N or S latitude. Warm to hot air mass. 3. Continental (c) • • Over any large land mass. Dry air mass. 4. Marine (m) • • Over any large body of water. Wet air mass.
Combining Air Masses 1. Maritime Tropical (m. T) – warm, humid air masses that form over oceans near the tropics. – Summer = hot and humid weather – Winter = humid conditions that bring rain or snow. 2. Maritime Polar (m. P) – cool, humid air masses that form over the icy cold North Pacific and North Atlantic oceans. – Affect the West Coast more than the East Coast • Summer = cool, humid air brings fog, rain and cool temperatures to the West Coast.
Combining Air Masses 3. Continental Tropical (c. T) – Hot, dry air masses that form only in the summer over dry areas of the southwest and northern Mexico. – Cover the smallest area of all air masses! 4. Continental Polar (c. P) – cool to cold and dry air masses that form over central and northern Canada and Alaska. – Winter = clear, cold and dry air to much of North America. • Arctic Air Masses (A) – bring bitterly cold weather with very low humidity. – Polar Vortex
North American Air Masses
Fronts • An area where two air masses meet and tend to not mix due to differences in temperature and density. – Warm air masses = low densities and rise – Cool air masses = higher densities and sink • Colliding air masses often cause storms and changeable weather. • 4 Types: 1. 2. 3. 4. Cold Front Warm Front Stationary Front Occluded Front
Front Symbols
Types of Fronts 1. Cold Fronts – cold air masses meet and push under a warm air mass. – Violent storms occur followed by fair, cool weather. • Cumulonimbus Clouds
Types of Fronts 2. Warm Fronts – warm air masses overtake a cold air mass and moves over it. – Rain is followed by hot, humid weather. • Cirrus clouds followed by stratus clouds.
Types of Fronts 3. Stationary Fronts – warm air mass meets a cold air mass and no movement occurs – Rain may fall for many days.
Types of Fronts 4. Occluded Front – A fast moving cold front overtakes a warm front, lifts it quickly causing large scale precipitation.
Understanding Weather Maps X c. P
Understanding Weather Maps 1. What is the temperature in Pittsburgh? 78°F 2. What is the wind direction in NY City? SE 3. What type of front is moving into X? Warm – What weather conditions should they be expecting? Rain, hot & humid 4. What is the wind speed at X? 20 5. What type of air mass is moving into Pittsburgh? c. P – Continental Polar
Cyclones & Anticyclones • Cyclones – areas of low pressure (L) that contain rising warm air. – Greek for “wheel”. – Cooler air will move in and take the place of the warm air causing air currents to spins counterclockwise causes rainy, stormy weather. • Anticyclones – high pressure centers (H) of cold, dry air. – Winds spiral clockwise causing clear, dry, fair weather.
Cyclones & Anticyclones Anticyclone Cyclone
Hazardous Conditions • Causes great human suffering and death. – Responsible for sever damage to the environment, infrastructure of cities and town and private property. • Types of Hazardous Conditions: – Thunderstorms – Hurricanes – Tornadoes – Winter Storms
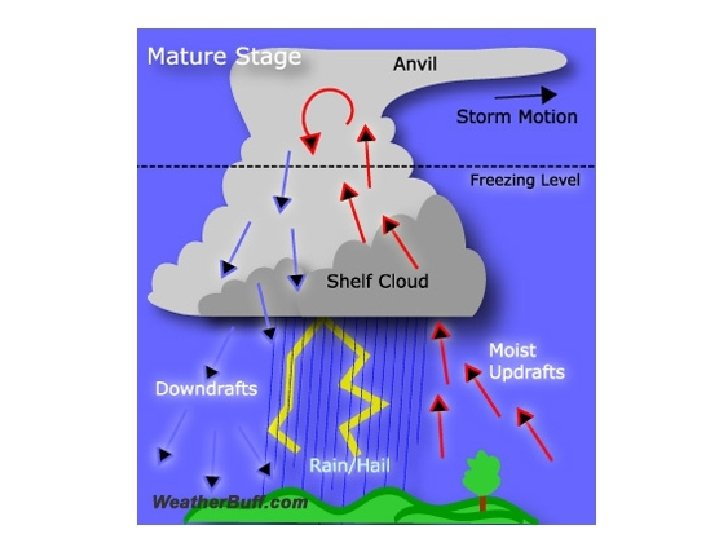
Thunderstorms • Thunderstorms form after severe heating of Earth’s surface. – Form within large cumulonimbus clouds when warm air is forced upward at a cold front. • Causes convection currents. – Internal friction is created within these convection currents causing electric charges in the clouds. • Lightning is the discharge of the electric charges. • Thunder is the sound that rapidly heated air, from lightning, causes as it expands suddenly and explosively. – Mechanical Energy
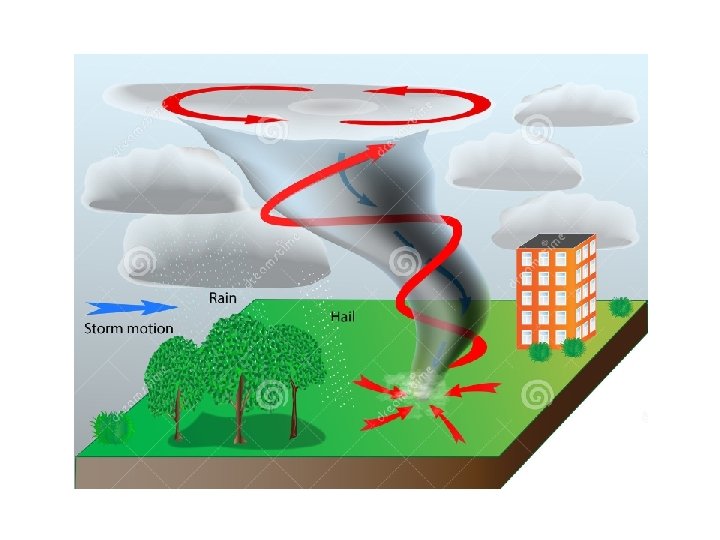
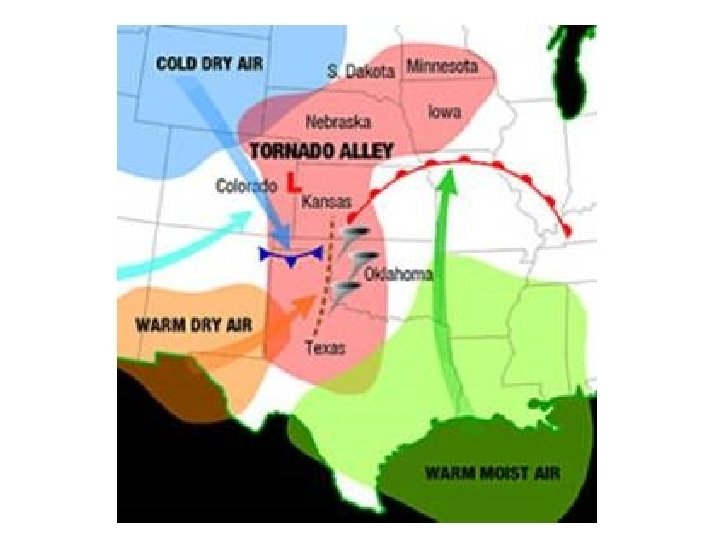
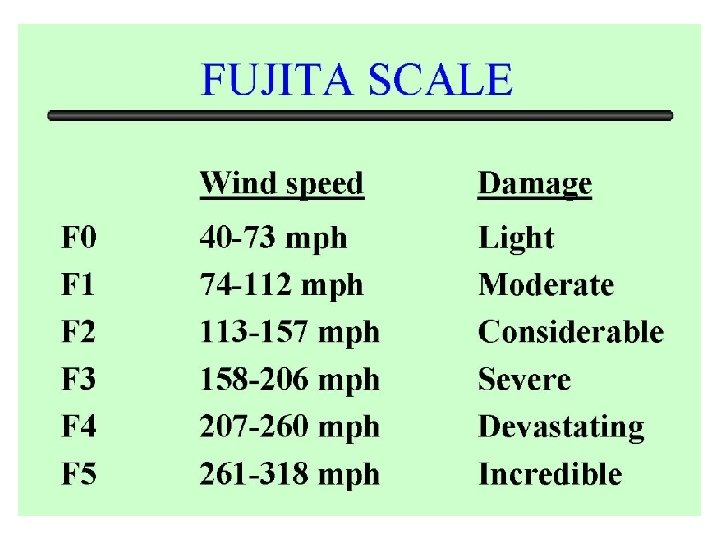
Tornadoes • Develop in low, heavy cumulonimbus clouds during spring and early summer often in late afternoon. – Rapidly whirling, funnel-shaped clouds that are short lived and develop over land from severe thunderstorms. Cyclone – counterclockwise rotation • Over a lake or ocean = waterspout • Occur ONLY in the United States – The Great Plains has the greatest occurrence of tornadoes and is called “tornado alley”.
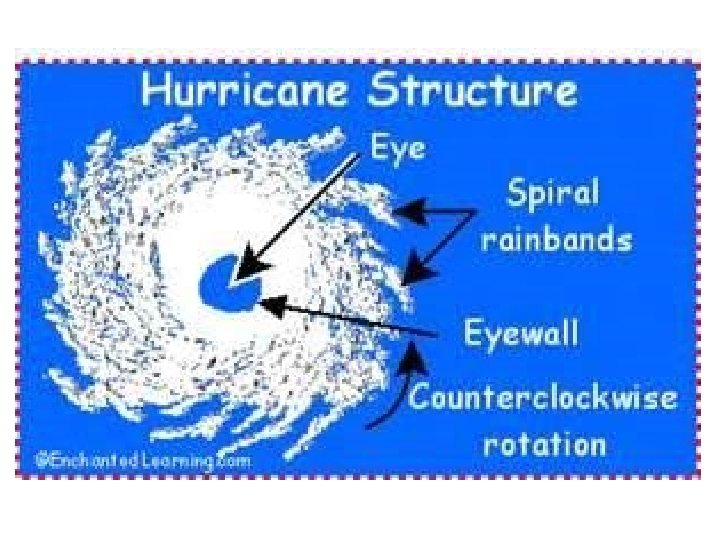
Hurricanes • A tropical storm that has winds of 119 km/hr or higher and is about 600 km across. – Develops over warm water as a low pressure area or tropical disturbance. • Gets its energy from the warm, humid air at the ocean’s surface. • Winds spiral inward, cyclone, toward the area of low pressure. – Lowest air pressure in a hurricane is found in the center, the eye. • Storm Surge – the dome of water that is pushed ashore where a hurricane lands. – The cause of most damage and death!
Hurricane Categories
Winter Storms • Snow falls when humid air cools below 0°C. • Lake-Effect Snow is caused when land loses heat faster than water and a dry, cold air mass it picks up water vapor from the warmer bodies of water. – Oswego, NY is one of the snowiest cities in the United States. • Receives an average annual snowfall of over 200”.
Average Snowfall in New York