FORECASTING THE WEATHER A weather forecast is a


- Slides: 18
FORECASTING THE WEATHER
A weather forecast is a prediction of weather conditions over the next 3 to 5 days. A meteorologist is a person who observes and collects data on atmospheric conditions to make weather predictions.
Weather-Forecasting Technology Weather balloons carry electronic equipment that can measure weather conditions as high as 30 km above Earth’s surface. Weather balloons measure temperature, air pressure and relative humidity. By tracking the balloon, meteorologists can measure wind speed and direction.
A thermometer is a tool used to measure air temperature. Most thermometers use a liquid sealed in a narrow glass tube. When air temperature increases, the liquid expands and moves up the tube. As air temperature decreases, the liquid shrinks and moves down the tube.
A barometer is an instrument used to measure air pressure. A mercurial barometer consists of a glass tube that is sealed at one end and placed in a container full of mercury. As the air pressure pushes on the mercury inside the container, the mercury moves up the glass tube. The greater the air pressure is, the higher the mercury will rise.
Mercurial barometer
Wind direction can be measured using a windsock. This is a cone-shaped bag that is open at both ends. The wind enters through the wide end and leaves through the narrow end – therefore the wide ends points into the wind.
A wind vane is shaped like an arrow with a large tail and is attached to a pole. As the wind pushes the tail of the wind vane, the wind vane spins on the pole until the arrow points into the wind.
An anemometer is used to measure wind speed. It consists of three or four cups connected by spokes to a pole. He wind pushes on the hollow sides of the cups and causes the cups to rotate on the pole. The motion sends a weak electric current that is measured and displayed on a dial.
Radar is used to fined the location, movement and amount of precipitation. It can also detect what form of precipitation a weather system is carrying.
My. Fox Cleveland | Weather Home Doppler radar is used to track local precipitation. Weather. Net 5. com - Home
Weather satellites that orbit the Earth provide the images of weather systems you see on tv weather reports. Satellites can track storm systems and measure wind speeds, humidity and temperatures at different altitudes.
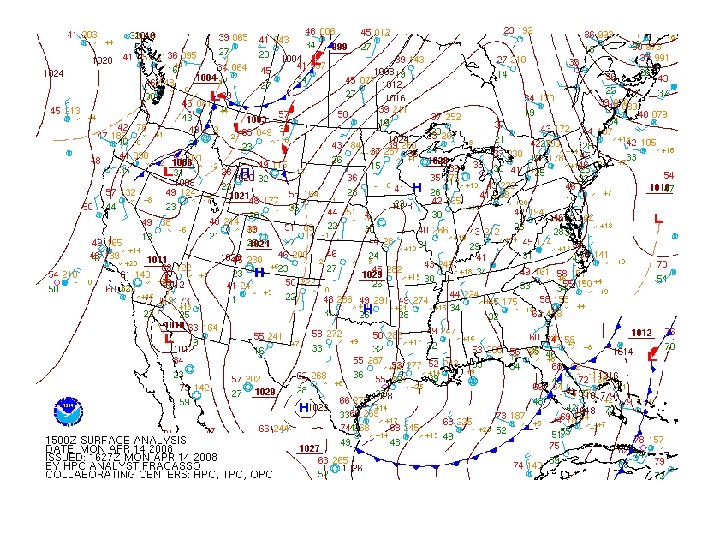
Weather maps are based on information gathered from about 1, 000 weather stations across the United States. Each station is represented by a station model. A station model is a small circle that shows the location of the weather station. Surrounding the small circle is a set of symbols and numbers, which represent weather data.
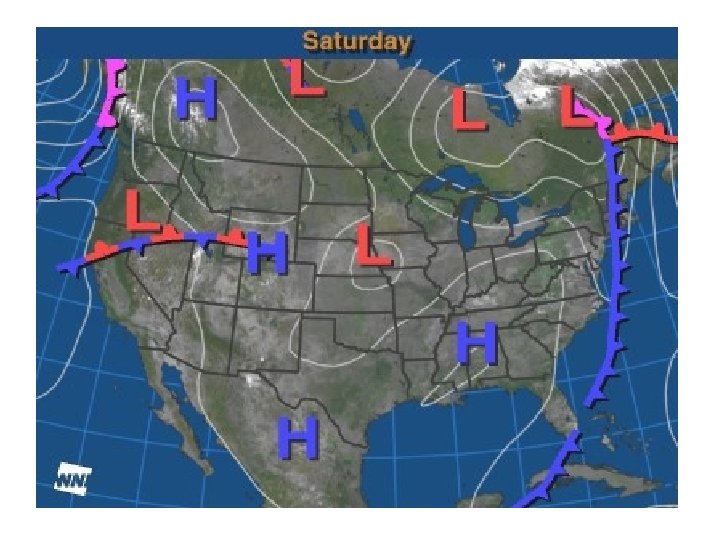
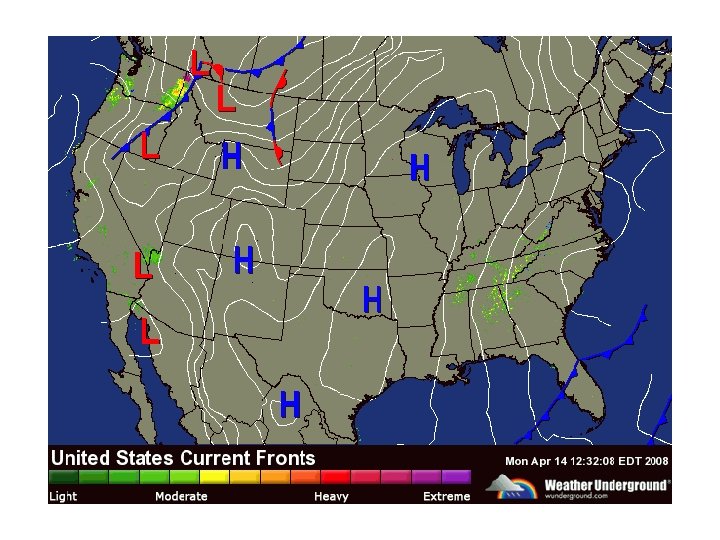
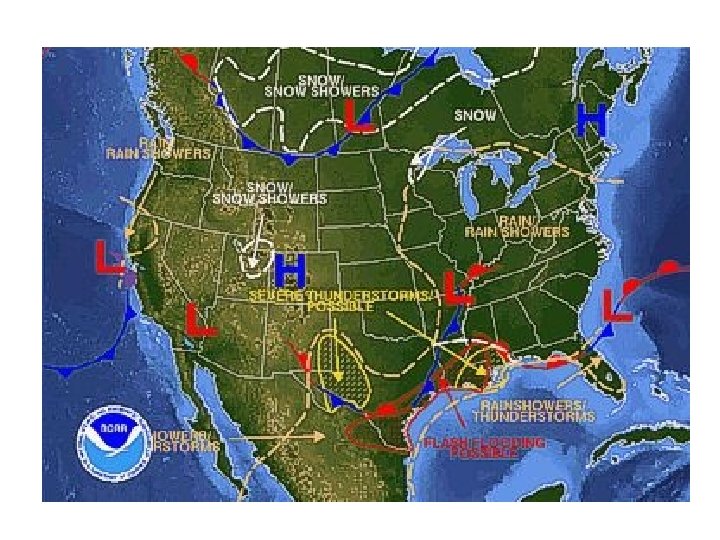
Weather maps that you see on TV include lines called isobars. Isobars are lines that connect points of equal air pressure. Isobars that form enclosed circles represent areas of high or low pressure. These are usually marked on a map with H or L. Fronts are also labeled on weather maps.