
Forecasting Prediction is very difficult especially if its
- Slides: 37
Forecasting “Prediction is very difficult, especially if it's about the future. ” Nils Bohr
Objectives • Give the fundamental rules of forecasting • Calculate a forecast using a moving average, weighted moving average, and trend • Calculate the accuracy of a forecast
What is forecasting? Forecasting is a tool used for predicting future demand based on past demand information.
Why is forecasting important? Demand for products and services is usually uncertain. Forecasting can be used for… • Strategic planning (long range planning) • Finance and accounting (budgets and cost controls) • Marketing (future sales, new products) • Production and operations
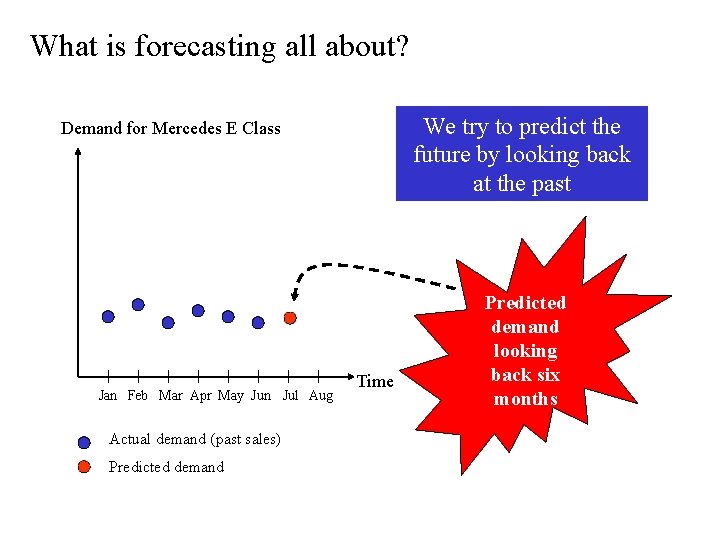
What is forecasting all about? We try to predict the future by looking back at the past Demand for Mercedes E Class Jan Feb Mar Apr May Jun Jul Aug Actual demand (past sales) Predicted demand Time Predicted demand looking back six months
What’s Forecasting All About? From the March 10, 2006 : Ahead of the Oscars, an economics professor, at the request of Weekend Journal, processed data about this year's films nominated for best picture through his statistical model and predicted with 97. 4% certainty that "Brokeback Mountain" would win. Oops. Last year, the professor tuned his model until it correctly predicted 18 of the previous 20 best-picture awards; then it predicted that "The Aviator" would win; "Million Dollar Baby" won instead. Sometimes models tuned to prior results don't have great predictive powers.
Some general characteristics of forecasts • Forecasts are sometimes wrong • Forecasts are more accurate for groups or families of items • Forecasts are more accurate for shorter time periods • Every forecast should include an error estimate • Forecasts are no substitute for calculated demand.
Key issues in forecasting 1. A forecast is only as good as the information included in the forecast (past data) 2. History is not a perfect predictor of the future (i. e. : there is no such thing as a perfect forecast) REMEMBER: Forecasting is based on the assumption that the past predicts the future! When forecasting, think carefully whether or not the past is strongly related to what you expect to see in the future…
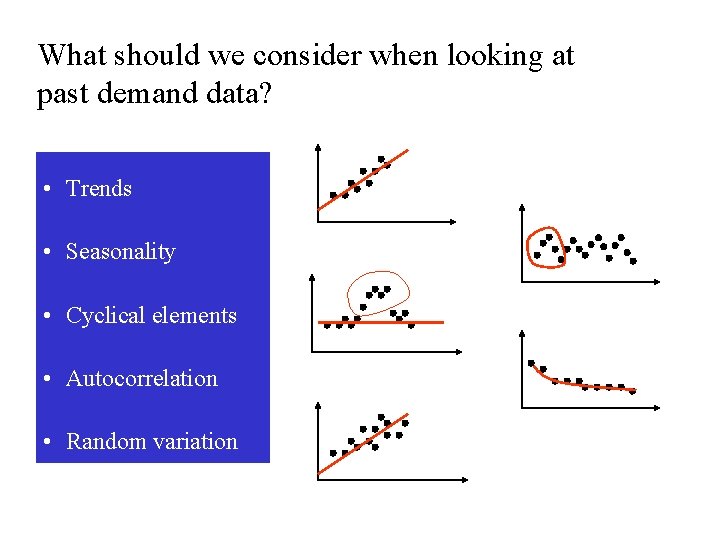
What should we consider when looking at past demand data? • Trends • Seasonality • Cyclical elements • Autocorrelation • Random variation
Some Important Questions • What is the purpose of the forecast? • Which systems will use the forecast? • How important is the past in estimating the future? Answers will help determine time horizons, techniques, and level of detail for the forecast.
Types of forecasting methods Qualitative methods Quantitative methods Rely on subjective opinions from one or more experts. Rely on data and analytical techniques.
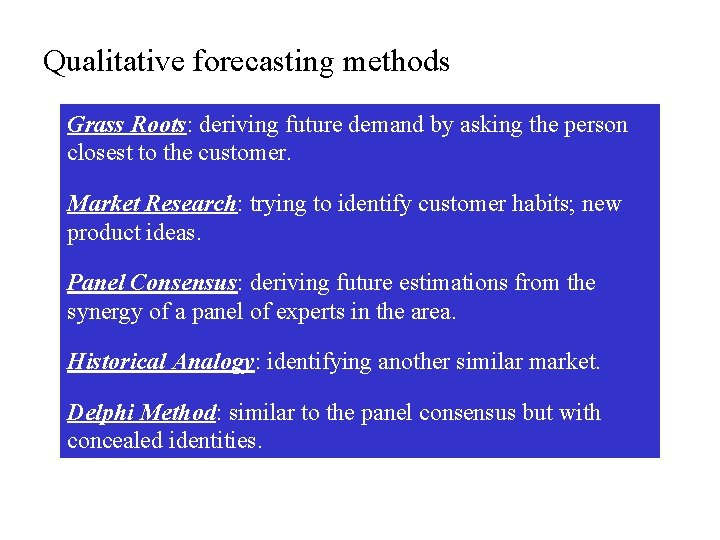
Qualitative forecasting methods Grass Roots: deriving future demand by asking the person closest to the customer. Market Research: trying to identify customer habits; new product ideas. Panel Consensus: deriving future estimations from the synergy of a panel of experts in the area. Historical Analogy: identifying another similar market. Delphi Method: similar to the panel consensus but with concealed identities.
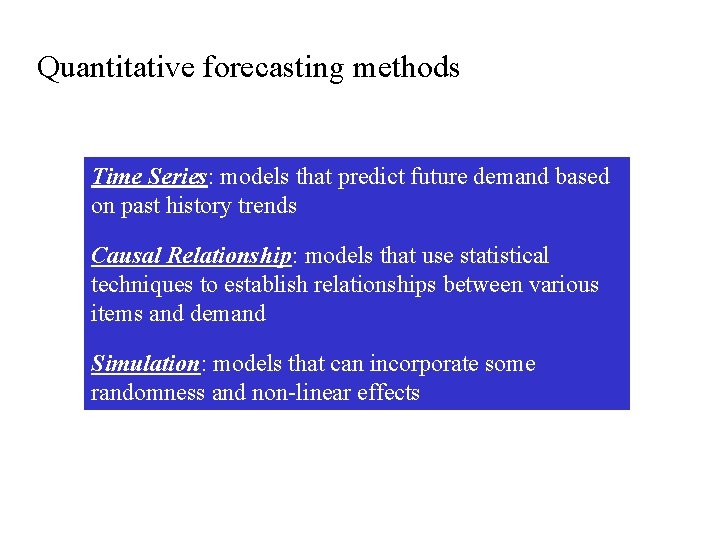
Quantitative forecasting methods Time Series: models that predict future demand based on past history trends Causal Relationship: models that use statistical techniques to establish relationships between various items and demand Simulation: models that can incorporate some randomness and non-linear effects
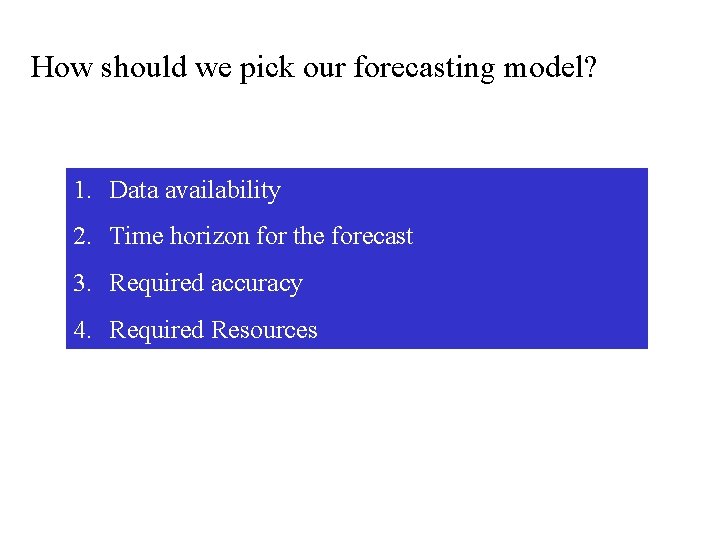
How should we pick our forecasting model? 1. Data availability 2. Time horizon for the forecast 3. Required accuracy 4. Required Resources
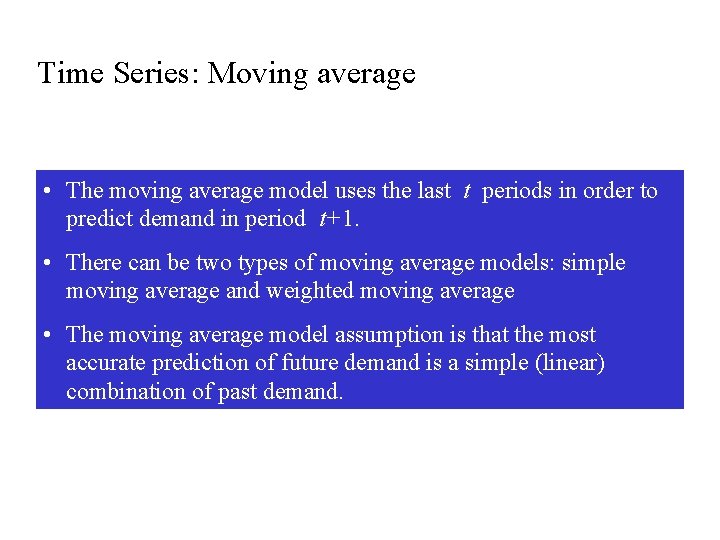
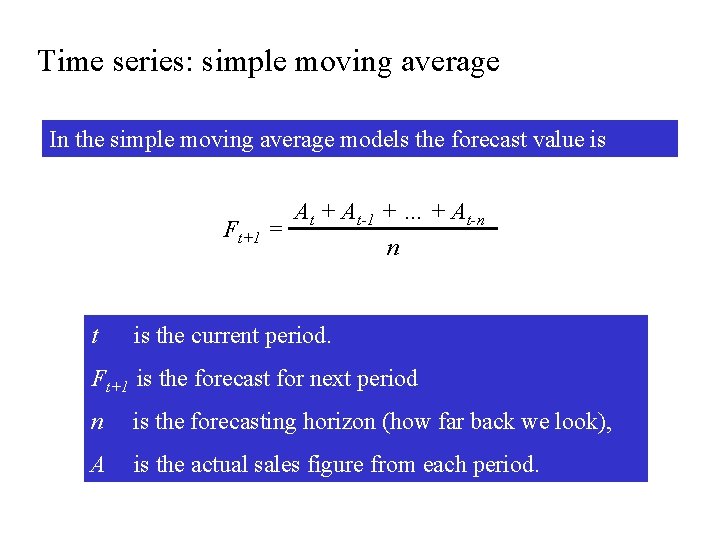
Time Series: Moving average • The moving average model uses the last t periods in order to predict demand in period t+1. • There can be two types of moving average models: simple moving average and weighted moving average • The moving average model assumption is that the most accurate prediction of future demand is a simple (linear) combination of past demand.
Time series: simple moving average In the simple moving average models the forecast value is At + At-1 + … + At-n Ft+1 = n t is the current period. Ft+1 is the forecast for next period n is the forecasting horizon (how far back we look), A is the actual sales figure from each period.
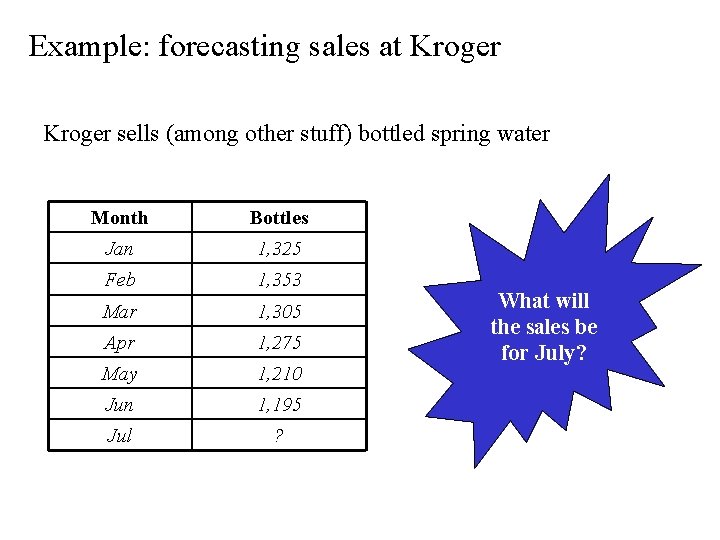
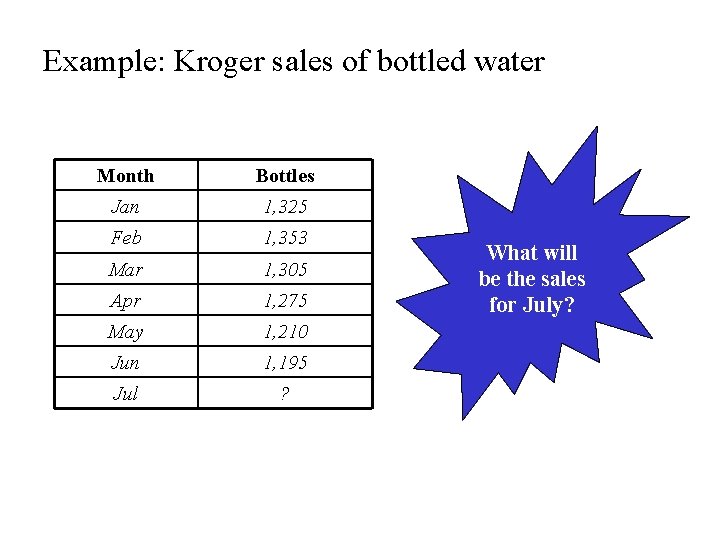
Example: forecasting sales at Kroger sells (among other stuff) bottled spring water Month Bottles Jan 1, 325 Feb 1, 353 Mar 1, 305 Apr 1, 275 May 1, 210 Jun 1, 195 Jul ? What will the sales be for July?
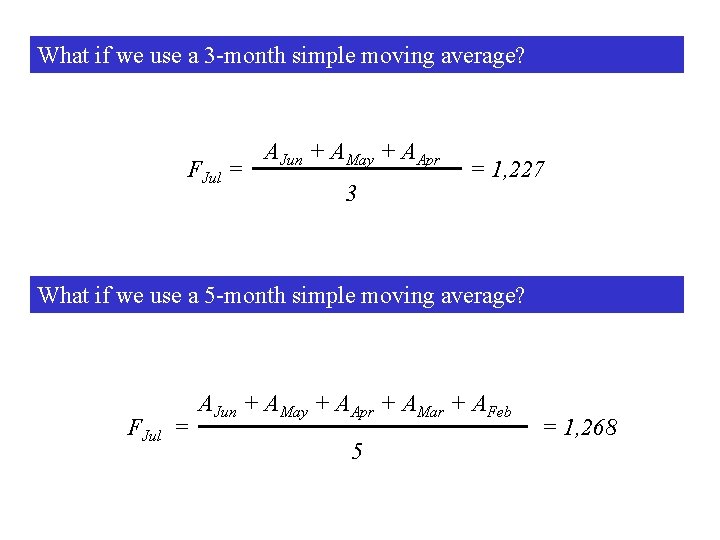
What if we use a 3 -month simple moving average? FJul = AJun + AMay + AApr 3 = 1, 227 What if we use a 5 -month simple moving average? FJul = AJun + AMay + AApr + AMar + AFeb 5 = 1, 268
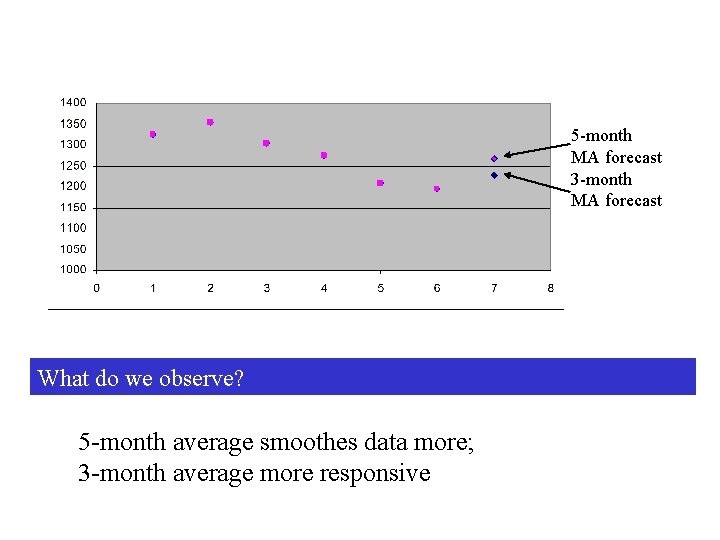
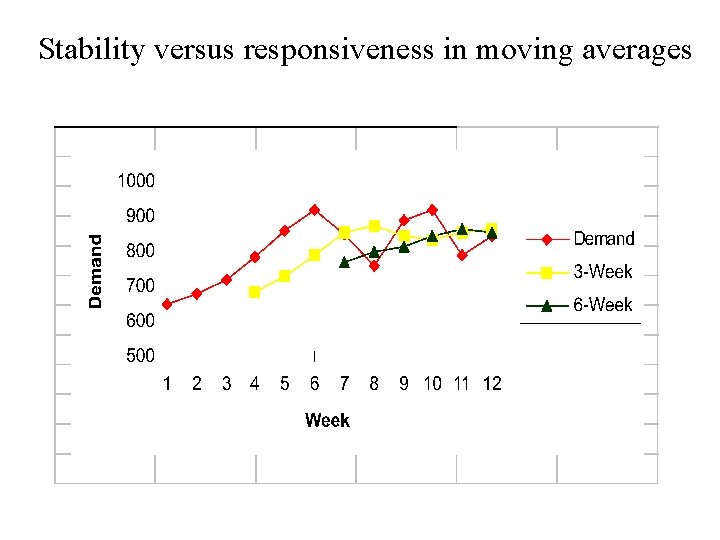
5 -month MA forecast 3 -month MA forecast What do we observe? 5 -month average smoothes data more; 3 -month average more responsive
Stability versus responsiveness in moving averages
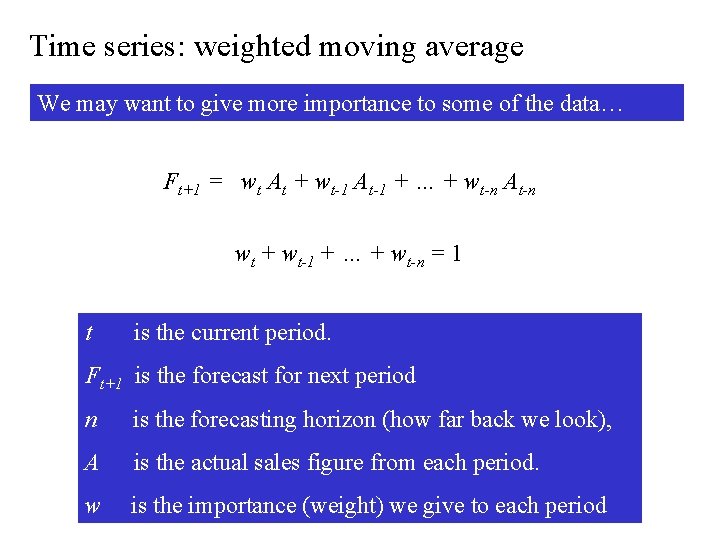
Time series: weighted moving average We may want to give more importance to some of the data… Ft+1 = wt At + wt-1 At-1 + … + wt-n At-n wt + wt-1 + … + wt-n = 1 t is the current period. Ft+1 is the forecast for next period n is the forecasting horizon (how far back we look), A is the actual sales figure from each period. w is the importance (weight) we give to each period
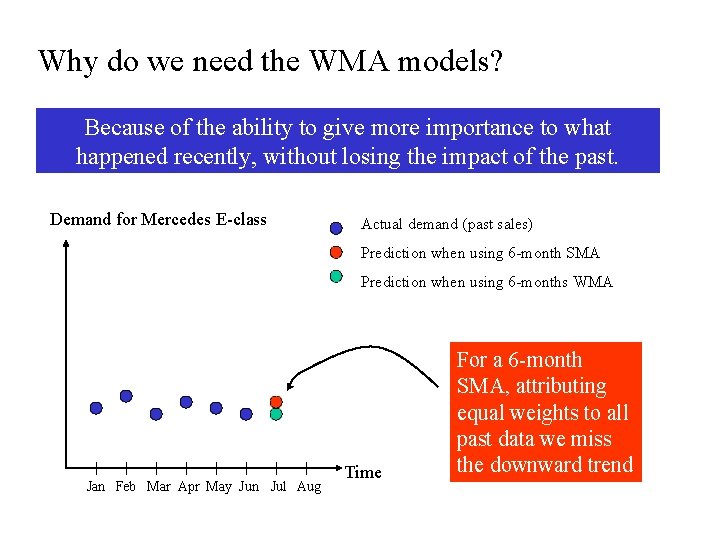
Why do we need the WMA models? Because of the ability to give more importance to what happened recently, without losing the impact of the past. Demand for Mercedes E-class Actual demand (past sales) Prediction when using 6 -month SMA Prediction when using 6 -months WMA Jan Feb Mar Apr May Jun Jul Aug Time For a 6 -month SMA, attributing equal weights to all past data we miss the downward trend
Example: Kroger sales of bottled water Month Bottles Jan 1, 325 Feb 1, 353 Mar 1, 305 Apr 1, 275 May 1, 210 Jun 1, 195 Jul ? What will be the sales for July?
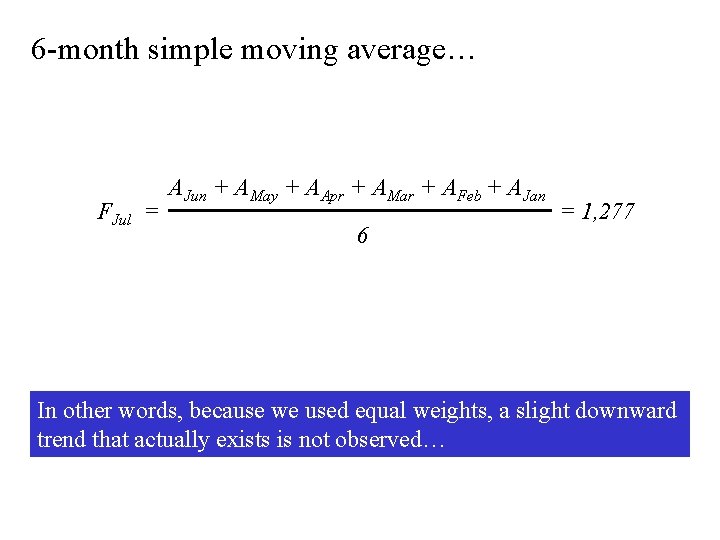
6 -month simple moving average… FJul = AJun + AMay + AApr + AMar + AFeb + AJan 6 = 1, 277 In other words, because we used equal weights, a slight downward trend that actually exists is not observed…
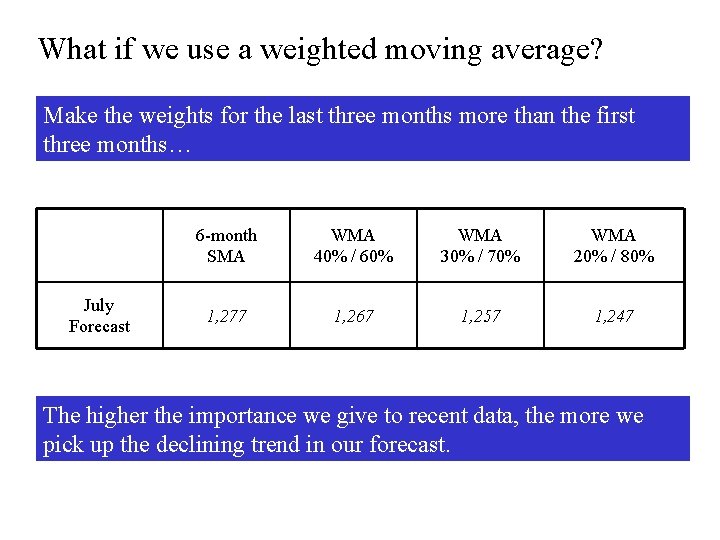
What if we use a weighted moving average? Make the weights for the last three months more than the first three months… July Forecast 6 -month SMA WMA 40% / 60% WMA 30% / 70% WMA 20% / 80% 1, 277 1, 267 1, 257 1, 247 The higher the importance we give to recent data, the more we pick up the declining trend in our forecast.
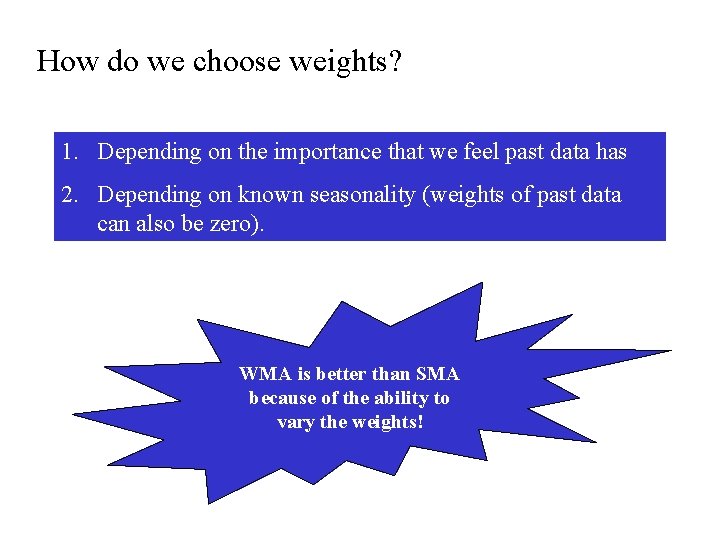
How do we choose weights? 1. Depending on the importance that we feel past data has 2. Depending on known seasonality (weights of past data can also be zero). WMA is better than SMA because of the ability to vary the weights!
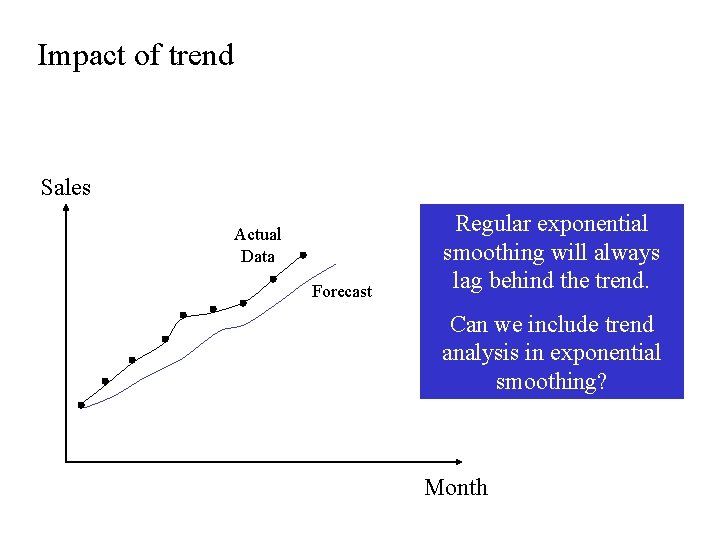
Trend. . What do you think will happen to a moving average model when there is a trend in the data?
Impact of trend Sales Actual Data Forecast Regular exponential smoothing will always lag behind the trend. Can we include trend analysis in exponential smoothing? Month
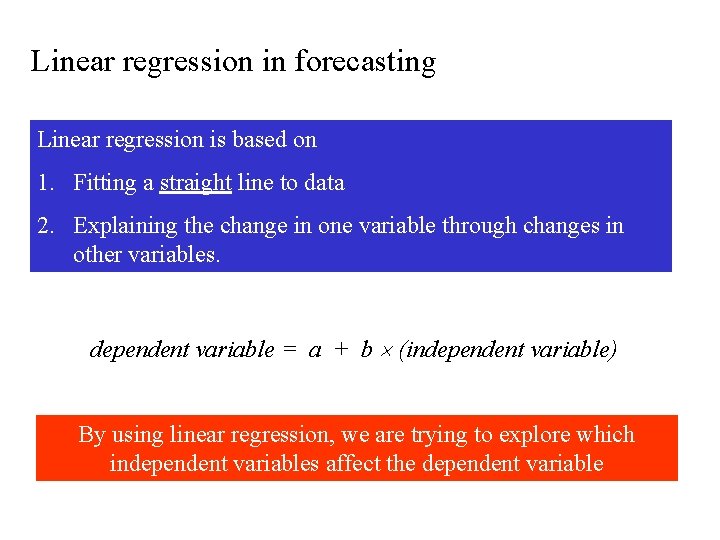
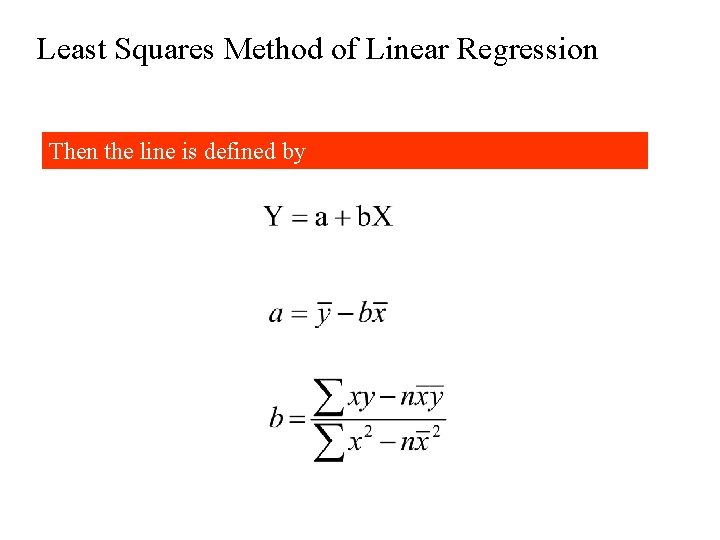
Linear regression in forecasting Linear regression is based on 1. Fitting a straight line to data 2. Explaining the change in one variable through changes in other variables. dependent variable = a + b (independent variable) By using linear regression, we are trying to explore which independent variables affect the dependent variable
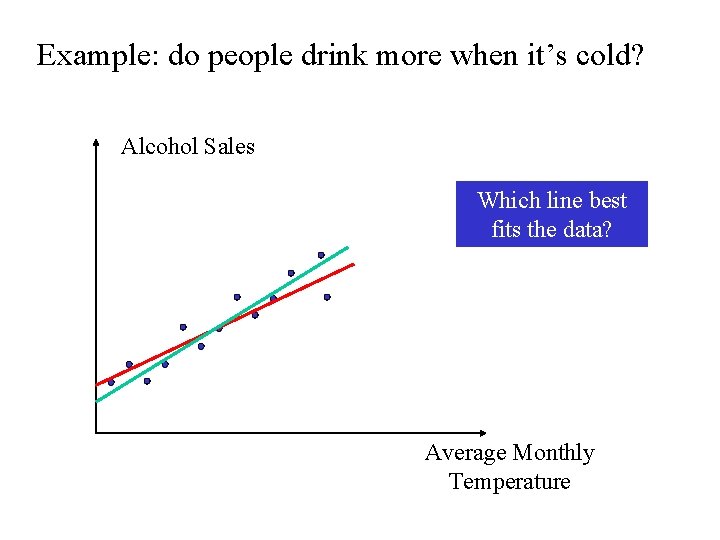
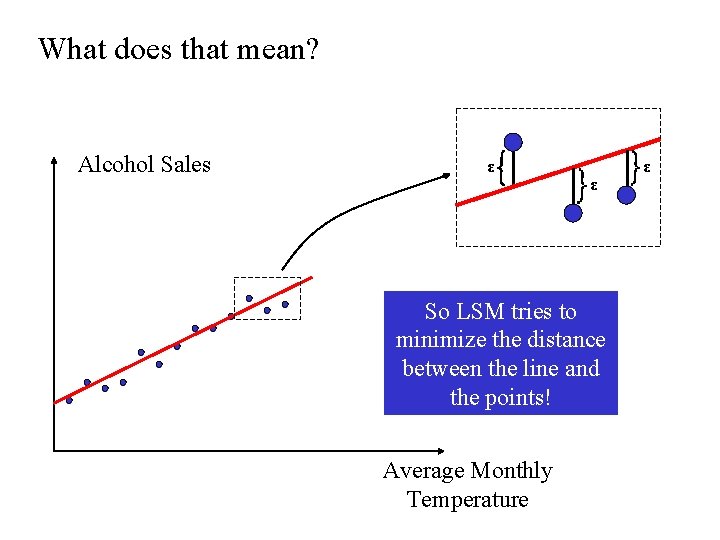
Example: do people drink more when it’s cold? Alcohol Sales Which line best fits the data? Average Monthly Temperature
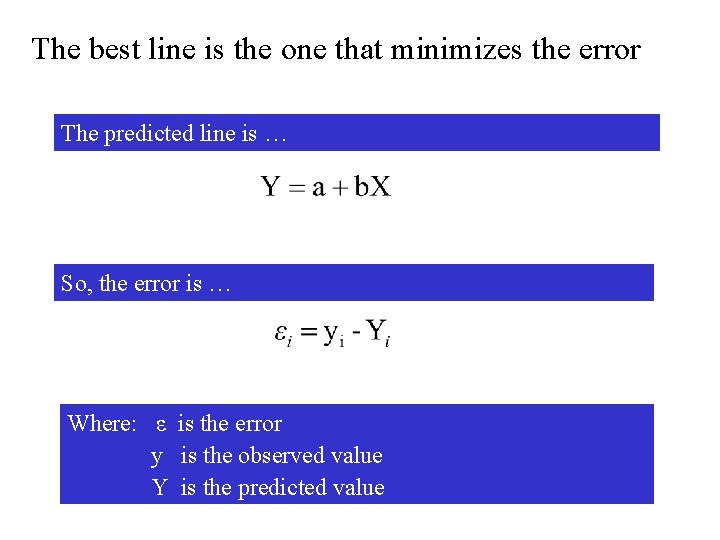
The best line is the one that minimizes the error The predicted line is … So, the error is … Where: ε is the error y is the observed value Y is the predicted value
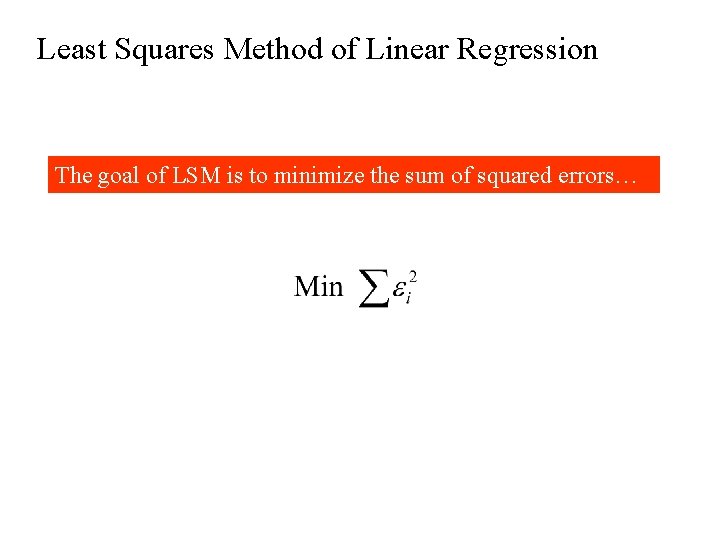
Least Squares Method of Linear Regression The goal of LSM is to minimize the sum of squared errors…
What does that mean? Alcohol Sales ε ε So LSM tries to minimize the distance between the line and the points! Average Monthly Temperature ε
Least Squares Method of Linear Regression Then the line is defined by
Key Point Forecast must be measured for accuracy! The most common means of doing so is by measuring the either the mean absolute deviation or the standard deviation of the forecast error
Which Forecasting Method Should You Use • • Gather the historical data of what you want to forecast Divide data into initiation set and evaluation set Use the first set to develop the models Use the second set to evaluate