
Forecasting Forecast is a statement about the future
Forecasting
Forecast… • is a statement about the future value of a variable of interest (such as demand). • affects decisions and activities throughout an organization. • reduces uncertainty (replaces data).
General statements about forecasting • Assumes causal system past ==> future • Forecasts rarely perfect because of randomness (Be ready to react). • Forecasts more accurate for groups vs. individuals • Forecast accuracy decreases as time horizon increases
Possible targets of forecasting • Factors outside the organization, that are hard to change – eg. weather, inflation, unemployment • Factors within the organization with a greater possibility to change. – eg. age structure, labor turnover, scrap ratio
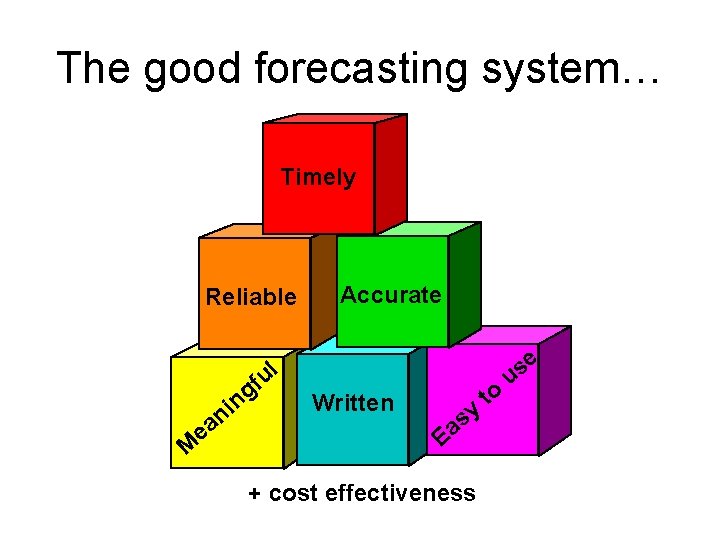
The good forecasting system… Timely Reliable ul M e f g n i an Accurate Written y s Ea + cost effectiveness to e s u
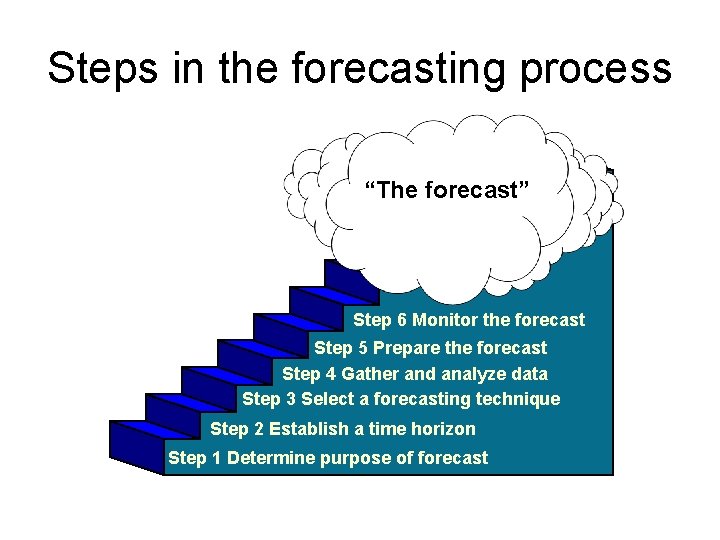
Steps in the forecasting process “The forecast” Step 6 Monitor the forecast Step 5 Prepare the forecast Step 4 Gather and analyze data Step 3 Select a forecasting technique Step 2 Establish a time horizon Step 1 Determine purpose of forecast
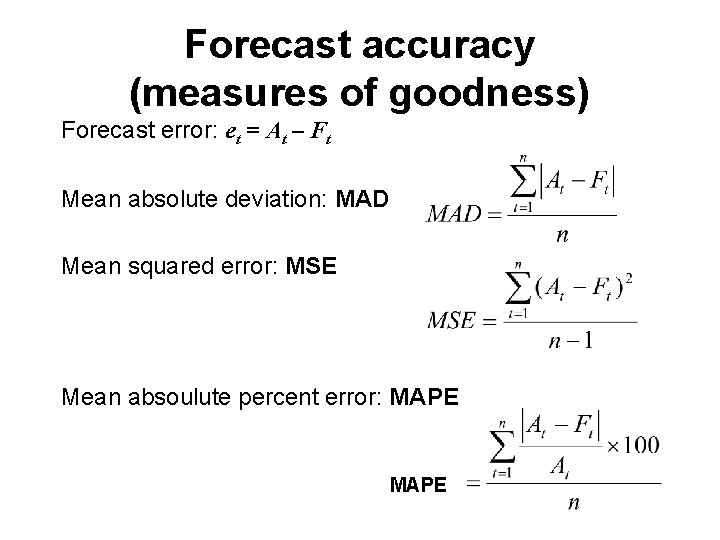
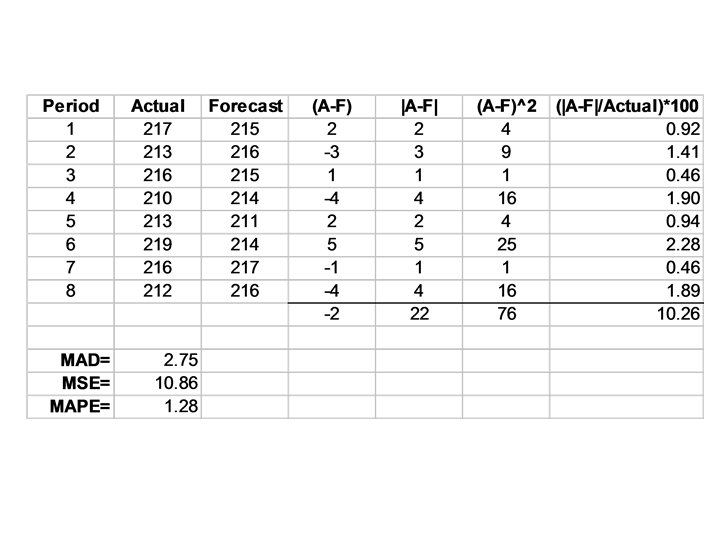
Forecast accuracy (measures of goodness) Forecast error: et = At – Ft Mean absolute deviation: MAD Mean squared error: MSE Mean absoulute percent error: MAPE
Types of forecast • Judgmental - uses subjective inputs – Executive opinions, salesforce opinions, consumer surveys etc. • Time series (time ordered sequence of observations) - uses historical data assuming the future will be like the past • Associative models - uses explanatory variables to predict the future
Time series forecasts • Trend - long-term movement in data • Seasonality - short-term regular variations in data • Cycle – wavelike variations of more than one year’s duration • Irregular variations - caused by unusual circumstances • Random variations - caused by chance

Forecast Variations Irregular variation Trend Cycles 90 89 88 Seasonal variations
Naive forecasts • The forecast for any period equals the previous period’s actual value. • Advantages: – – – – Simple to use Virtually no cost Quick and easy to prepare Data analysis is nonexistent Easily understandable Cannot provide high accuracy Can be a standard for accuracy
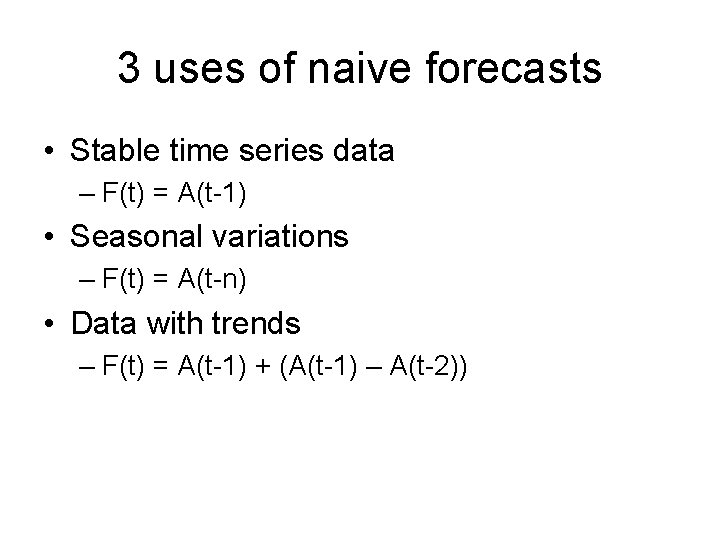
3 uses of naive forecasts • Stable time series data – F(t) = A(t-1) • Seasonal variations – F(t) = A(t-n) • Data with trends – F(t) = A(t-1) + (A(t-1) – A(t-2))
Techniques of averaging (smoothing variations in the data) • • (Simple) Avarage Moving average Weighted moving average Exponential smoothing
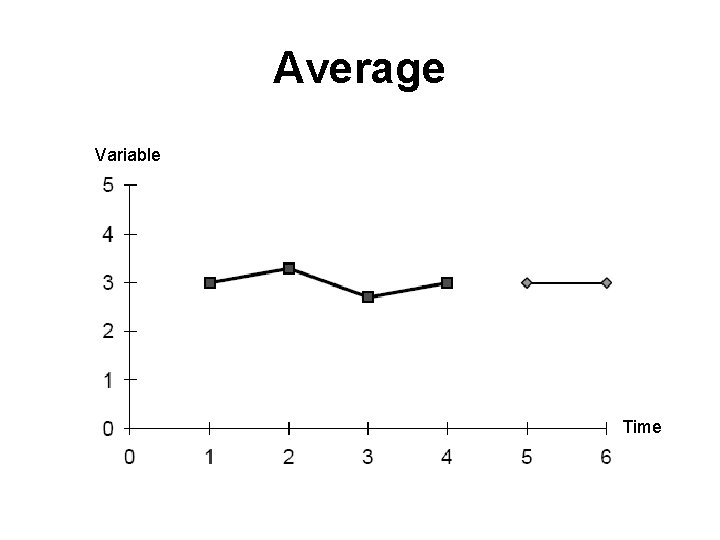
Average Variable Time
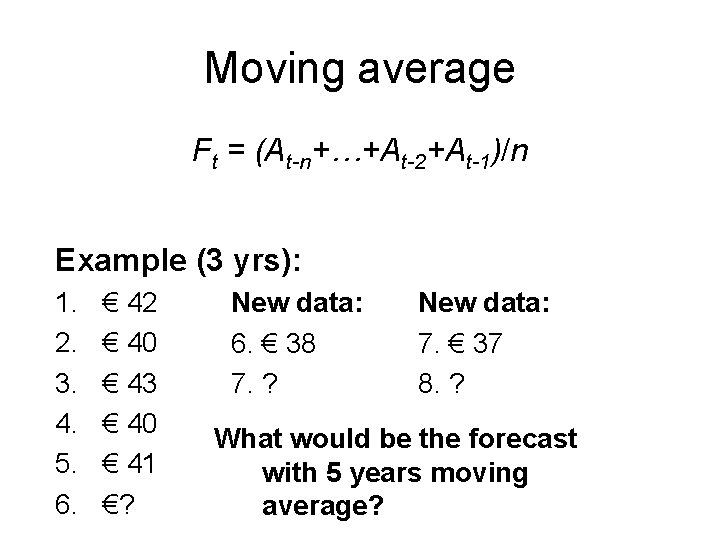
Moving average Ft = (At-n+…+At-2+At-1)/n Example (3 yrs): 1. 2. 3. 4. 5. 6. € 42 € 40 € 43 € 40 € 41 €? New data: 6. € 38 7. ? New data: 7. € 37 8. ? What would be the forecast with 5 years moving average?
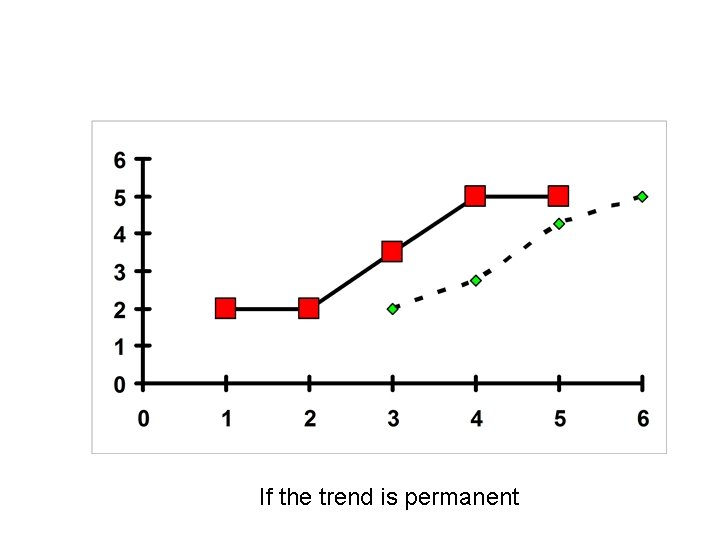
If the trend is permanent
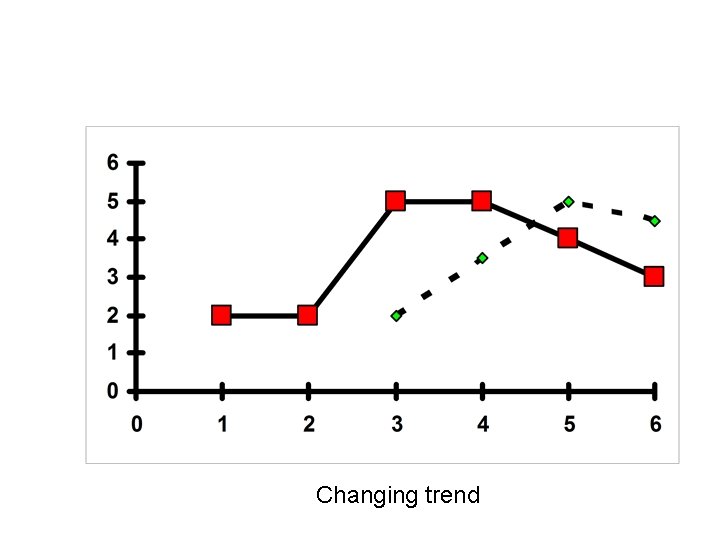
Mottó: egy biztos – minden bizonytalan Az előrejelzés a jövőbeni események megjósolásának tudománya és művészete Miért tudomány? Miért művészet? Changing trend

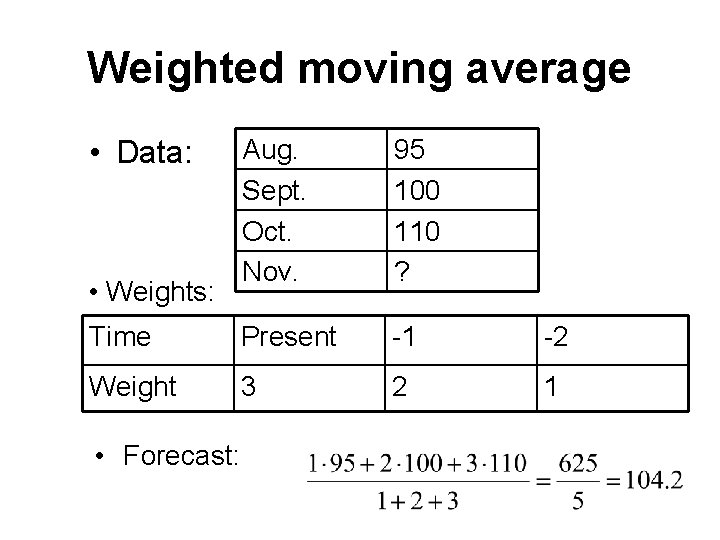
Weighted moving average • Data: Aug. Sept. Oct. Nov. 95 100 110 ? Time Present -1 -2 Weight 3 2 1 • Weights: Súlyok: • Előrejelzés Forecast:
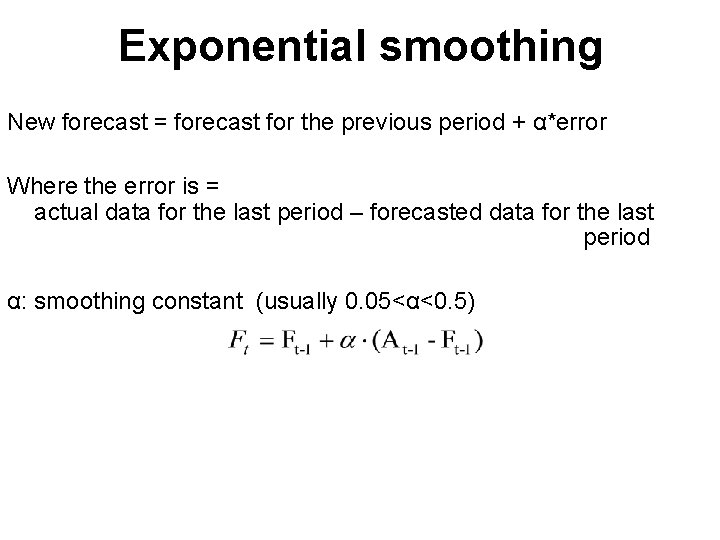
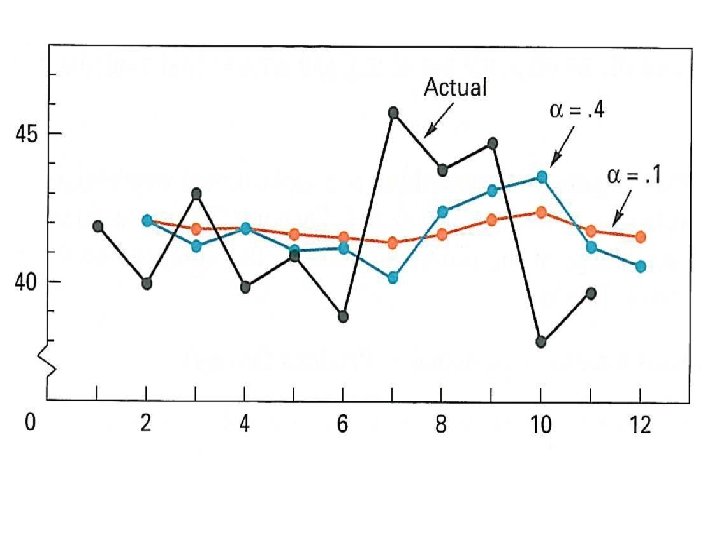
Exponential smoothing New forecast = forecast for the previous period + α*error Where the error is = actual data for the last period – forecasted data for the last period α: smoothing constant (usually 0. 05<α<0. 5)
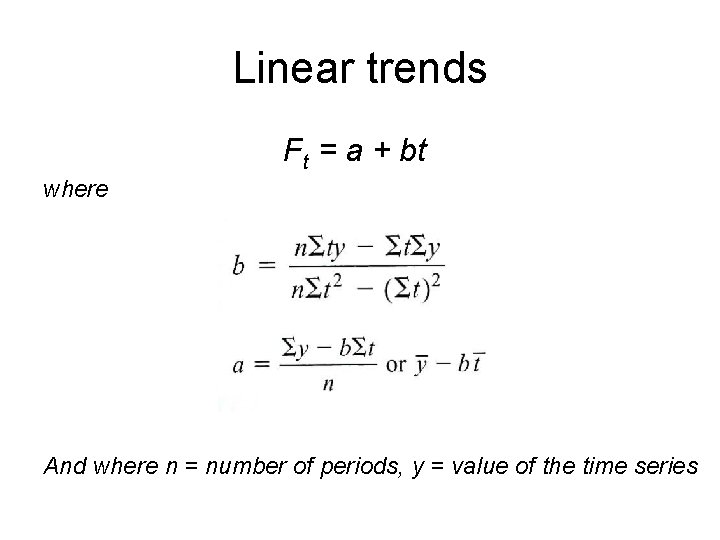
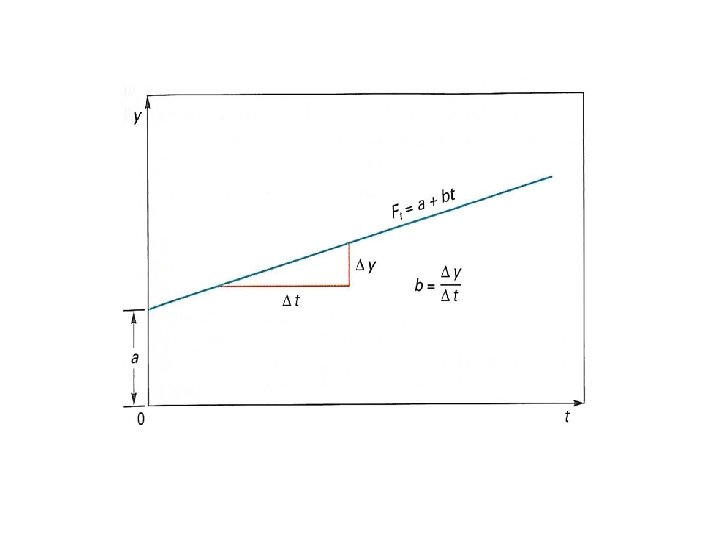
Linear trends Ft = a + bt where And where n = number of periods, y = value of the time series
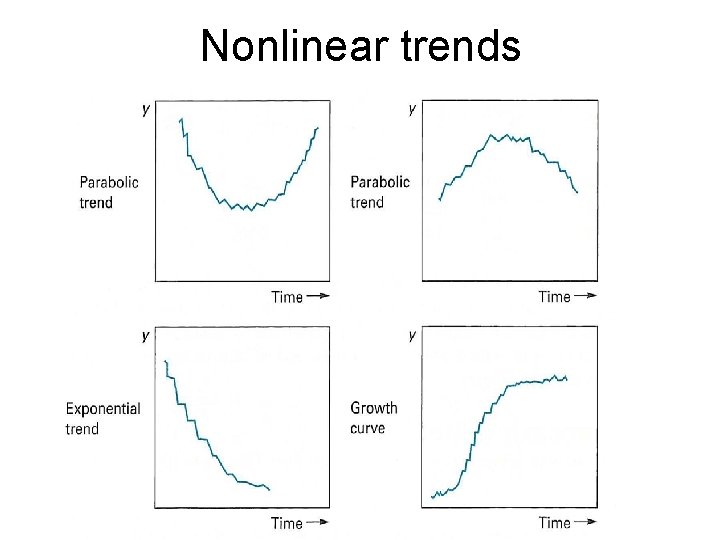
Nonlinear trends
Associative Forecasting • Predictor variables - used to predict values of variable interest • Regression - technique for fitting a line to a set of points • Least squares line - minimizes sum of squared deviations around the line
Controlling the Forecast • Control chart – A visual tool for monitoring forecast errors – Used to detect non-randomness in errors • Forecasting errors are in control if – All errors are within the control limits – No patterns, such as trends or cycles, are present
Sources of Forecast errors • Model may be inadequate • Irregular variations • Incorrect use of forecasting technique
Choosing a Forecasting Technique • No single technique works in every situation • Two most important factors – Cost – Accuracy • Other factors include the availability of: – Historical data – Computers – Time needed to gather and analyze the data – Forecast horizon
- Slides: 29