FORECASTING ELECTRICITY DEMAND PRICES WITH MACHINE LEARNING ALAN


 are a flexible machine learning model which can approximate")

 Mean Absolute Percentage Error North Island 64 MW 2.")


- Slides: 26
FORECASTING ELECTRICITY DEMAND PRICES WITH MACHINE LEARNING ALAN ANSELL
AIMS • Use machine learning to produce accurate predictions of demand nodal prices two hours in advance. • Base price predictions on aggregated North and South Island offer stacks as per WITS.
MACHINE LEARNING • Learning by example rather than explicit instruction • The wealth of data available on the NZEM makes it an ideal target
EXAMPLES AND FEATURES • Each training example consists of a set of features and a target • In an electricity market context, each example might correspond to a trading period, the target the aggregate demand in that period, and the features relevant data such as the time of day or the demand in the previous period.
DEMAND PREDICTION • Want to predict aggregate North and South Island demand (less wind generation) 2 hours ahead of time. • Could easily be applied at a nodal level • Used a dataset consisting of all trading periods between Jan 1 st 2014 – June 30 th 2017
FEATURES FOR DEMAND PREDICTION • Month • Day of week • Number of trading period (1 -50) • Is it a national holiday, and was it yesterday? • Is daylight saving in effect, and did it begin/end on this day? • Temperature in 4 main centres
MORE FEATURES FOR DEMAND PREDICTION • Aggregate load at conforming and non-conforming nodes 5, 8 and 48 trading periods ago • Aggregate wind generation 5 trading periods ago.
PROCESSING FEATURES • Convert categorical features to a set of binary features, one for each possible value, e. g. 7 binary features for day of week • Scale numerical features to have values between 0 and 1
MODEL • Neural networks (NNs) are a flexible machine learning model which can approximate many functions well. • I used a neural network model with 6 hidden layers. • The training objective was to minimise the mean absolute error (MAE) of the demand predictions.
VALIDATION • Temporal cross-validation with folds of one year was used to evaluate the model Test set 2014 Training data 2015 2016 2017 Training data
RESULTS Mean Absolute Error (MAE) Mean Absolute Percentage Error North Island 64 MW 2. 5% South Island 24 MW 1. 4%
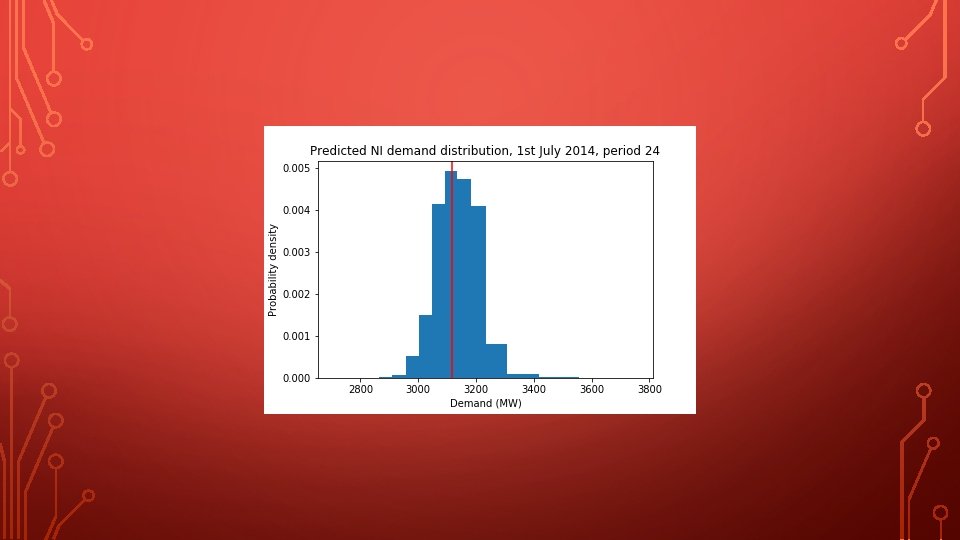
PREDICTING DEMAND DISTRIBUTIONS • Instead of producing a point estimate, predict a distribution of possible load values • Divide the range of possible demand values into a set of N bins, e. g. 2, 000 -2, 100 MW, 2, 100 -2, 200 MW, … • The training target for each trading period is the bin to which the demand value in that trading period belonged
TRAINING A CLASSIFIER FOR DEMAND DISTRIBUTIONS •
PREDICTING PRICES • How can we predict nodal prices given aggregate offer stacks and predicted demands?
AGGREGATE MARKET CLEARING MODEL • Could solve a linear program with two nodes. • But we don’t know about internal losses and capacities.
THE “SATISFIABILITY” FUNCTION •
LEARNING THE “SATISFIABILITY” FUNCTION •
HOW WELL DOES IT WORK? •
ACHIEVING SATISFACTION AT LEAST COST •
ACHIEVING SATISFACTION AT LEAST COST •
DETERMINING PRICES •
FITTING NODAL PRICES •
RESULTS Error of predictions against EMI final prices, Jan 14 – June 17 MAE ($/MWh) MAE (% of mean) Benmore 8. 99 14. 6% Haywards 9. 64 14. 8% Otahuhu 10. 30 14. 9%
NEXT STEPS • Price does not change linearly in response to demand, so using a point estimate of demand may not give an unbiased estimate of price • Instead, sample from estimated demand distribution
ACKNOWLEDGEMENTS • Golbon Zakeri • Andreas Kempa-Liehr