
Forecast Sensitivity to Observations in ACCESS Chris Tingwell
Forecast Sensitivity to Observations in ACCESS Chris Tingwell, Sergei Soldatenko, Jin Lee and Peter Steinle Bureau of Meteorology Research and Development Acknowledgements: Boris Kelly-Gerreyn, Robert De Maid & Agnes Lane Bureau of Meteorology Observations & Infrastructure The Met Office WMO 6 th Workshop on the Impact of Various Observing Systems on NWP Shanghai, China, 10 -13 May, 2016
Outline • Overview of ACCESS • A quick history of Observation impact studies in ACCESS • Adjoint-based Forecast Sensitivity to Observations in ACCESS • Some preliminary results • Ongoing work, future plans
ACCESS • Australian Community Climate and Earth System Simulator • Collaboration between the Bureau of Meteorology, the CSIRO, Australian universities, the Met Office and other international partners. • The NWP subset of ACCESS provides the Bureau with its operational NWP capability. • ACCESS NWP is built around the Met Office Unified Model and Observations Processing System (OPS) and 4 D-VAR assimilation.
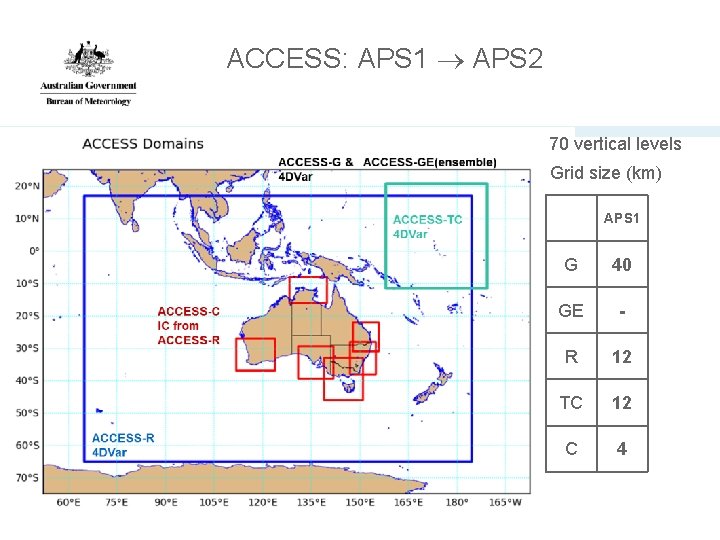
ACCESS: APS 1 APS 2 70 vertical levels Grid size (km) APS 1 4 G 40 GE - R 12 TC 12 C 4
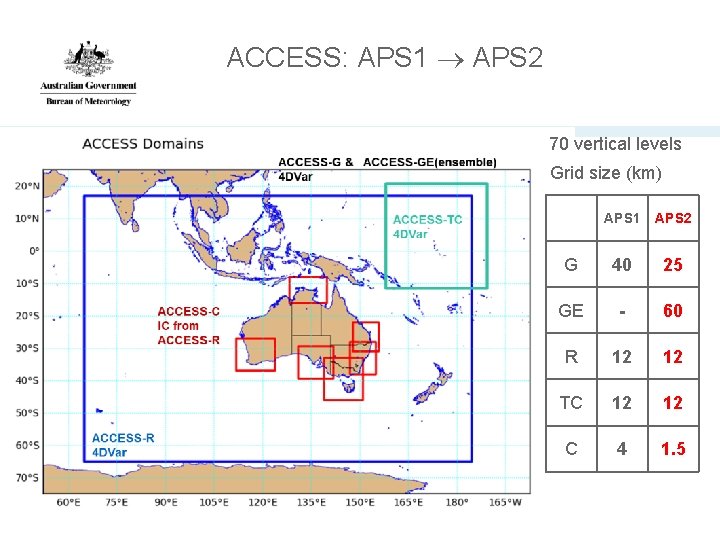
ACCESS: APS 1 APS 2 70 vertical levels Grid size (km) 5 APS 1 APS 2 G 40 25 GE - 60 R 12 12 TC 12 12 C 4 1. 5
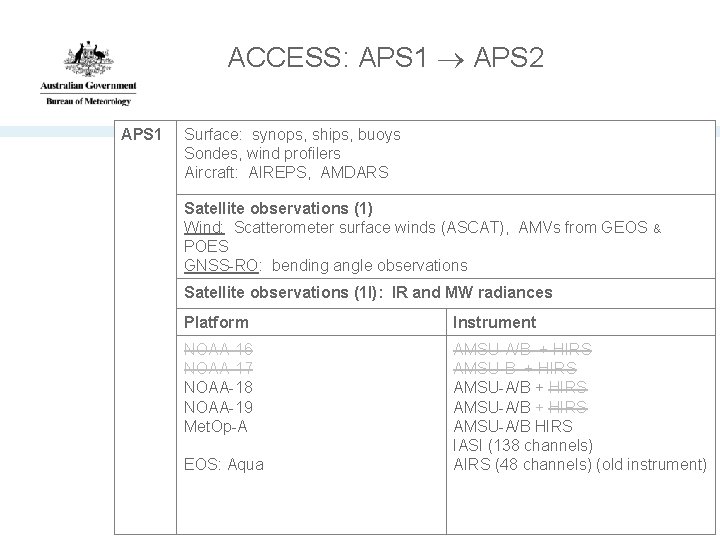
ACCESS: APS 1 APS 2 APS 1 Surface: synops, ships, buoys Sondes, wind profilers Aircraft: AIREPS, AMDARS Satellite observations (1) Wind: Scatterometer surface winds (ASCAT), AMVs from GEOS & POES GNSS-RO: bending angle observations Satellite observations (1 I): IR and MW radiances Platform Instrument NOAA-16 NOAA-17 NOAA-18 NOAA-19 Met. Op-A AMSU-A/B + HIRS AMSU-A/B HIRS IASI (138 channels) AIRS (48 channels) (old instrument) EOS: Aqua
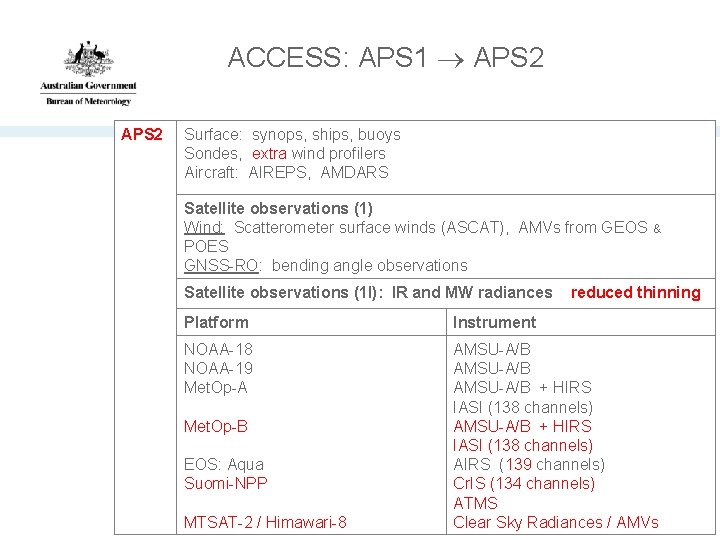
ACCESS: APS 1 APS 2 Surface: synops, ships, buoys Sondes, extra wind profilers Aircraft: AIREPS, AMDARS Satellite observations (1) Wind: Scatterometer surface winds (ASCAT), AMVs from GEOS & POES GNSS-RO: bending angle observations Satellite observations (1 I): IR and MW radiances reduced thinning Platform Instrument NOAA-18 NOAA-19 Met. Op-A AMSU-A/B + HIRS IASI (138 channels) AIRS (139 channels) Cr. IS (134 channels) ATMS Clear Sky Radiances / AMVs Met. Op-B EOS: Aqua Suomi-NPP MTSAT-2 / Himawari-8
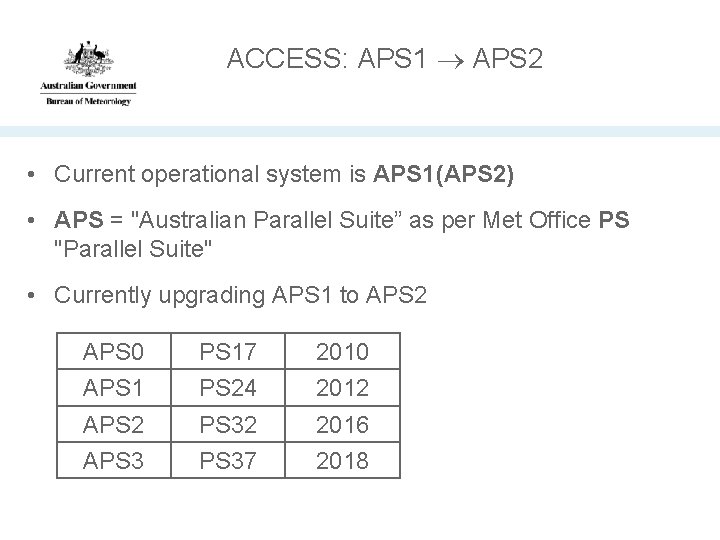
ACCESS: APS 1 APS 2 • Current operational system is APS 1(APS 2) • APS = "Australian Parallel Suite” as per Met Office PS "Parallel Suite" • Currently upgrading APS 1 to APS 2 APS 0 APS 17 PS 24 2010 2012 APS 32 PS 37 2016 2018
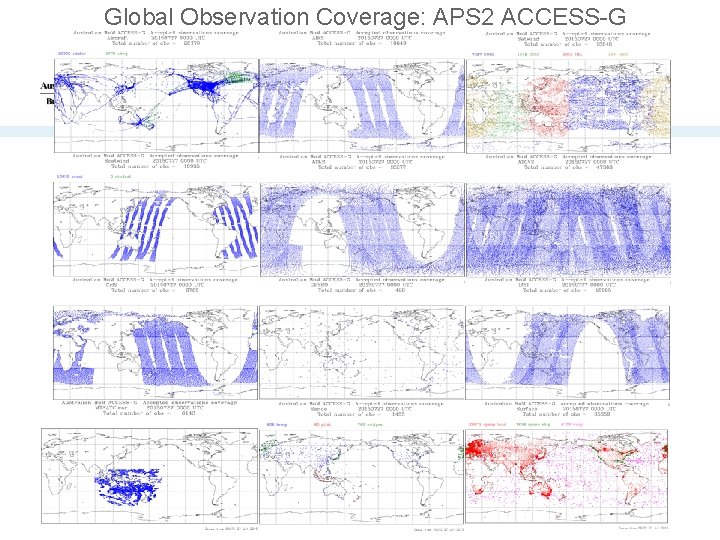
Global Observation Coverage: APS 2 ACCESS-G
Summary history of observation impact studies in ACCESS • Most observation impact studies to date have been OSEs – Data denial experiments to test the impact of upper-air network modifications on regional ACCESS-R system (at behest of Bureau observation network planners). – Impact of satellite observations: new instruments, locally processed AMVs, and demonstrations of the impact that all satellite observations have on Southern Hemisphere forecast skill. – (Some of these reported at Sedona. ) – Done rarely: expensive and time consuming.
Adjoint-based FSO in ACCESS • The use of Met Office VAR in ACCESS makes the Met Office FSO system available to us: – Can run inexpensively - in real-time - downstream of the operational ACCESS-G suite – Provides continuous information about the impact of each assimilated observation on the 24 h forecast error – Has attracted a lot of interest within the Bureau from observation network planners – Data assimilators see it as a potentially valuable tool to assess "health" of the ACCESS assimilation system and guide DA R&D
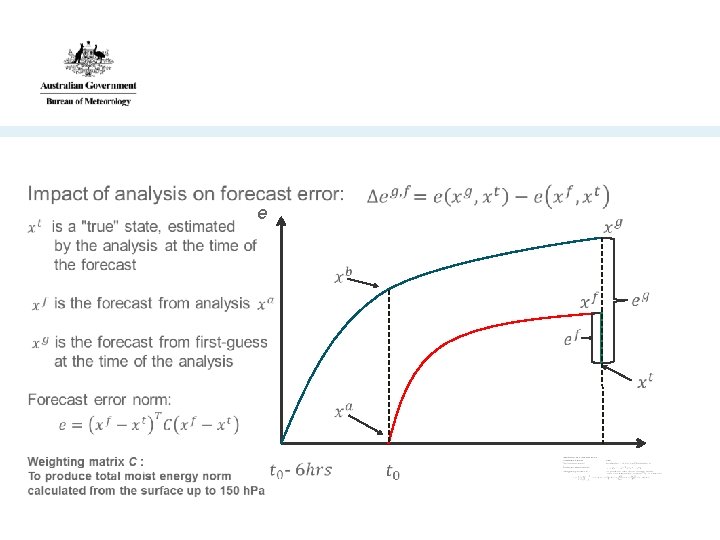
e
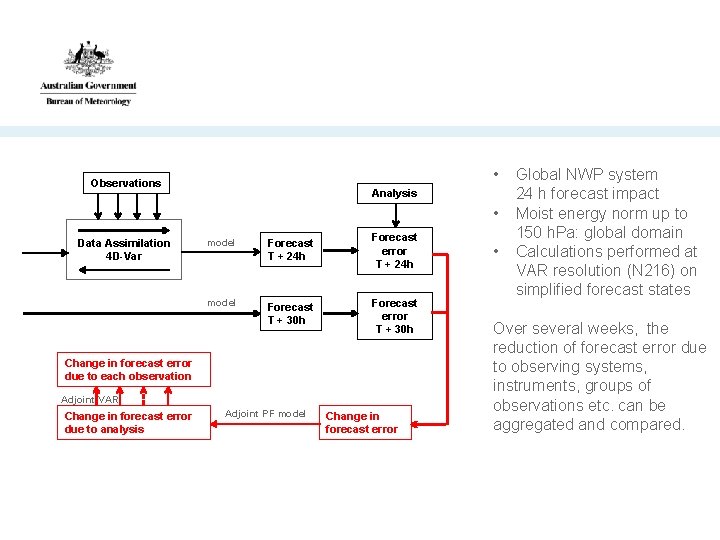
• Observations Analysis • Data Assimilation 4 D-Var model Forecast T + 24 h Forecast error T + 24 h model Forecast T + 30 h Forecast error T + 30 h Change in forecast error due to each observation Adjoint VAR Change in forecast error due to analysis Adjoint PF model Change in forecast error • Global NWP system 24 h forecast impact Moist energy norm up to 150 h. Pa: global domain Calculations performed at VAR resolution (N 216) on simplified forecast states Over several weeks, the reduction of forecast error due to observing systems, instruments, groups of observations etc. can be aggregated and compared.
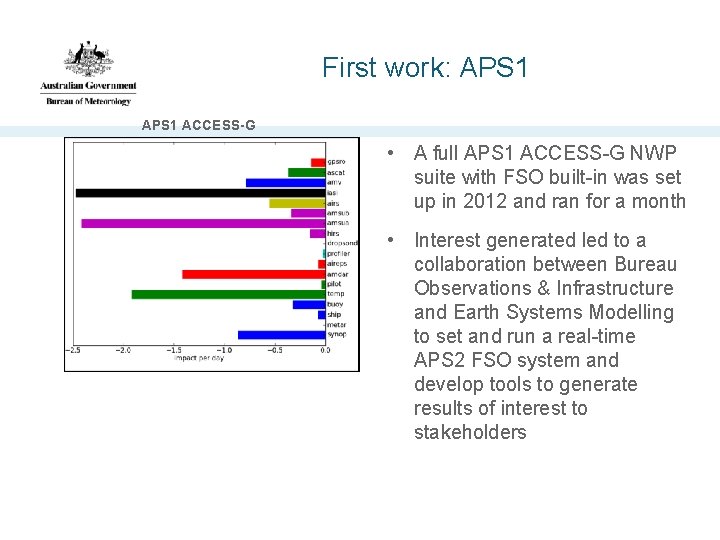
First work: APS 1 ACCESS-G • A full APS 1 ACCESS-G NWP suite with FSO built-in was set up in 2012 and ran for a month • Interest generated led to a collaboration between Bureau Observations & Infrastructure and Earth Systems Modelling to set and run a real-time APS 2 FSO system and develop tools to generate results of interest to stakeholders
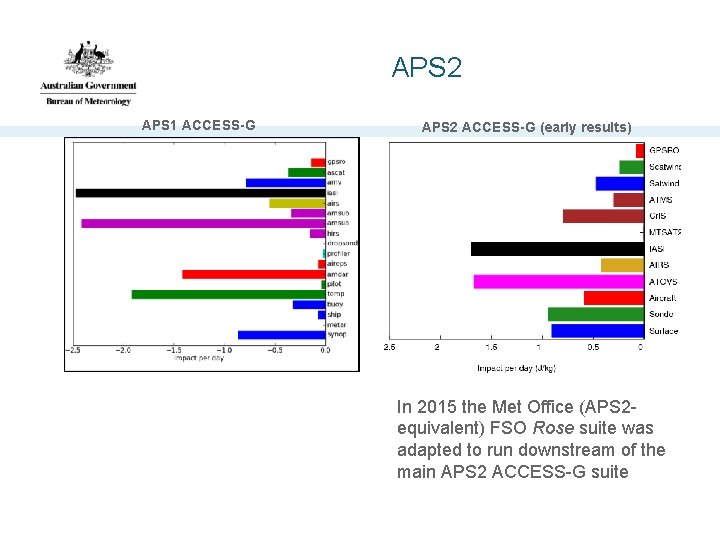
APS 2 APS 1 ACCESS-G APS 2 ACCESS-G (early results) In 2015 the Met Office (APS 2 equivalent) FSO Rose suite was adapted to run downstream of the main APS 2 ACCESS-G suite
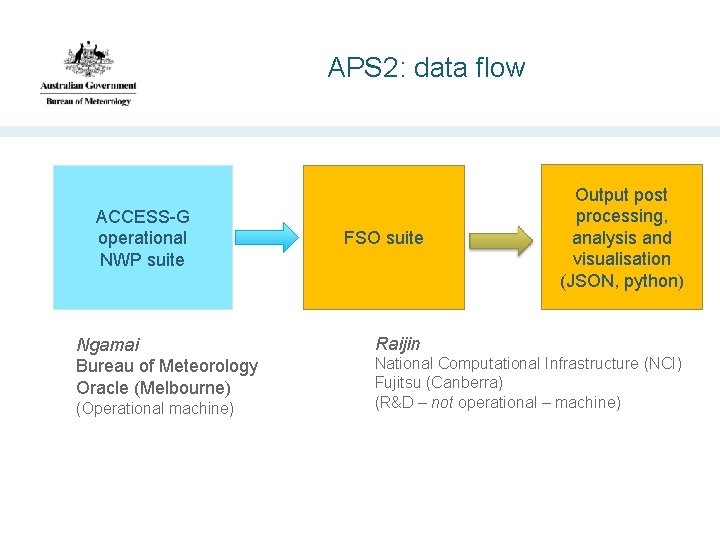
APS 2: data flow ACCESS-G operational NWP suite Ngamai Bureau of Meteorology Oracle (Melbourne) (Operational machine) FSO suite Output post processing, analysis and visualisation (JSON, python) Raijin National Computational Infrastructure (NCI) Fujitsu (Canberra) (R&D – not operational – machine)
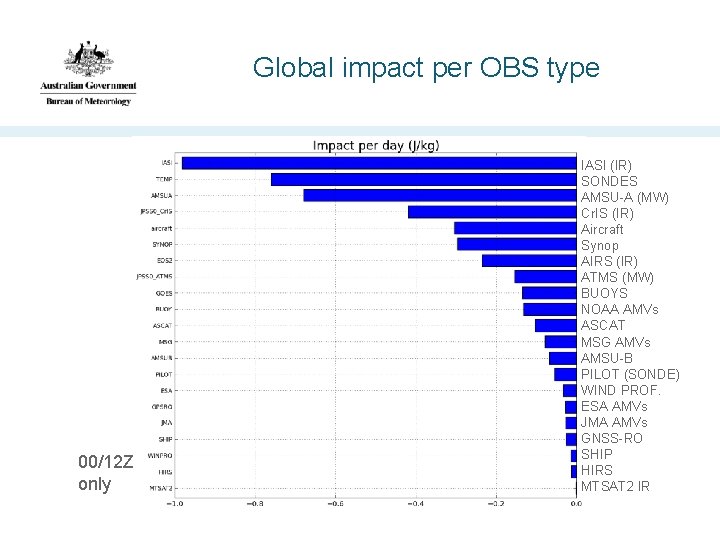
Global impact per OBS type 00/12 Z only IASI (IR) SONDES AMSU-A (MW) Cr. IS (IR) Aircraft Synop AIRS (IR) ATMS (MW) BUOYS NOAA AMVs ASCAT MSG AMVs AMSU-B PILOT (SONDE) WIND PROF. ESA AMVs JMA AMVs GNSS-RO SHIP HIRS MTSAT 2 IR
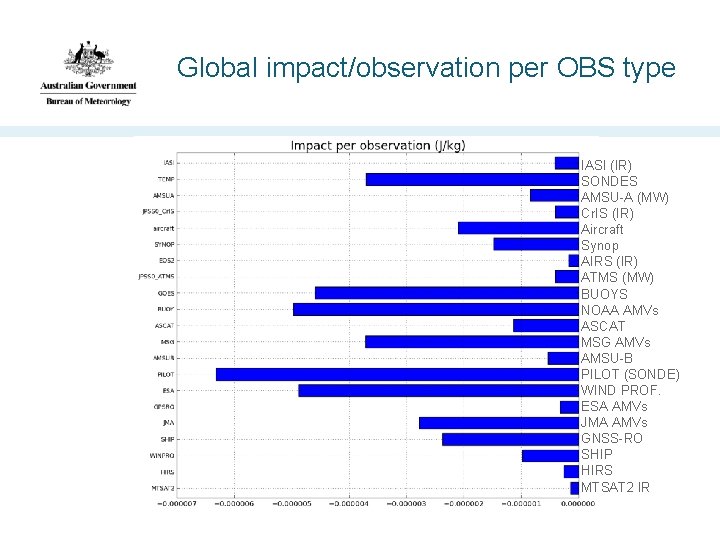
Global impact/observation per OBS type IASI (IR) SONDES AMSU-A (MW) Cr. IS (IR) Aircraft Synop AIRS (IR) ATMS (MW) BUOYS NOAA AMVs ASCAT MSG AMVs AMSU-B PILOT (SONDE) WIND PROF. ESA AMVs JMA AMVs GNSS-RO SHIP HIRS MTSAT 2 IR
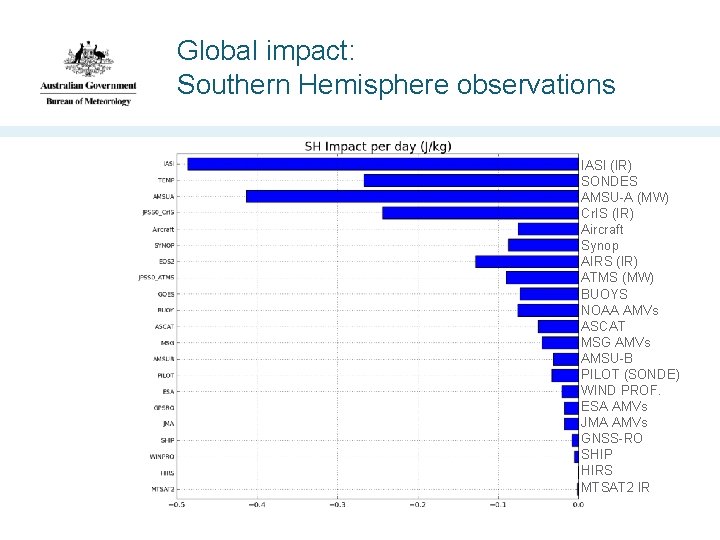
Global impact: Southern Hemisphere observations IASI (IR) SONDES AMSU-A (MW) Cr. IS (IR) Aircraft Synop AIRS (IR) ATMS (MW) BUOYS NOAA AMVs ASCAT MSG AMVs AMSU-B PILOT (SONDE) WIND PROF. ESA AMVs JMA AMVs GNSS-RO SHIP HIRS MTSAT 2 IR
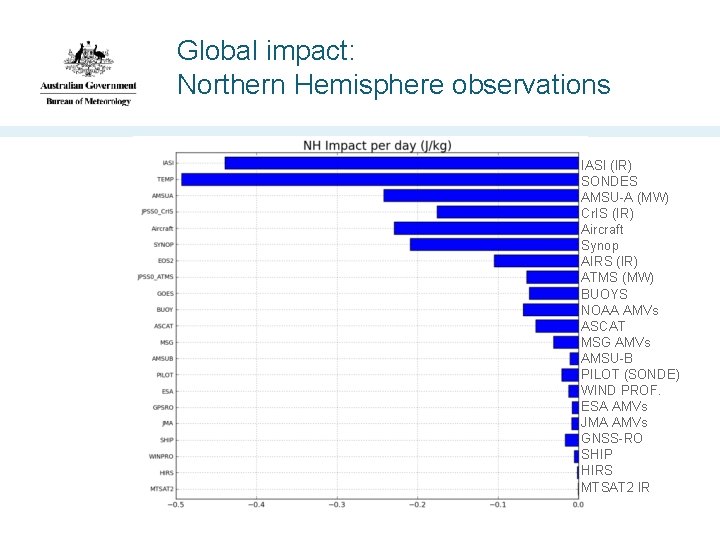
Global impact: Northern Hemisphere observations IASI (IR) SONDES AMSU-A (MW) Cr. IS (IR) Aircraft Synop AIRS (IR) ATMS (MW) BUOYS NOAA AMVs ASCAT MSG AMVs AMSU-B PILOT (SONDE) WIND PROF. ESA AMVs JMA AMVs GNSS-RO SHIP HIRS MTSAT 2 IR
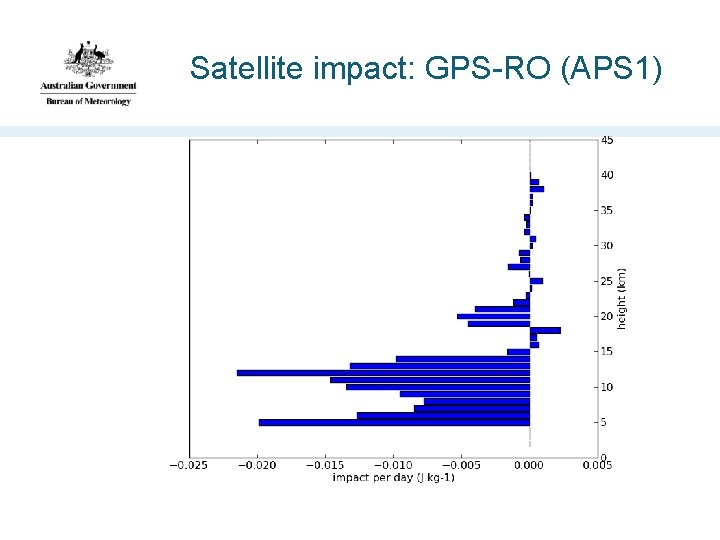
Satellite impact: GPS-RO (APS 1)
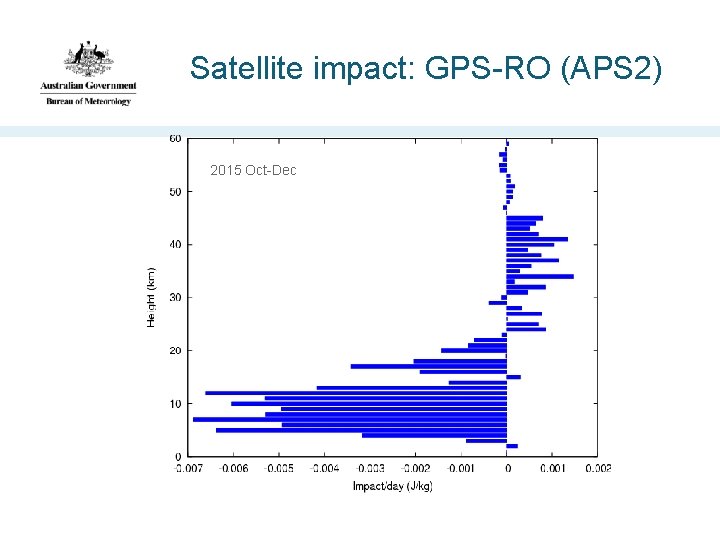
Satellite impact: GPS-RO (APS 2) 2015 Oct-Dec
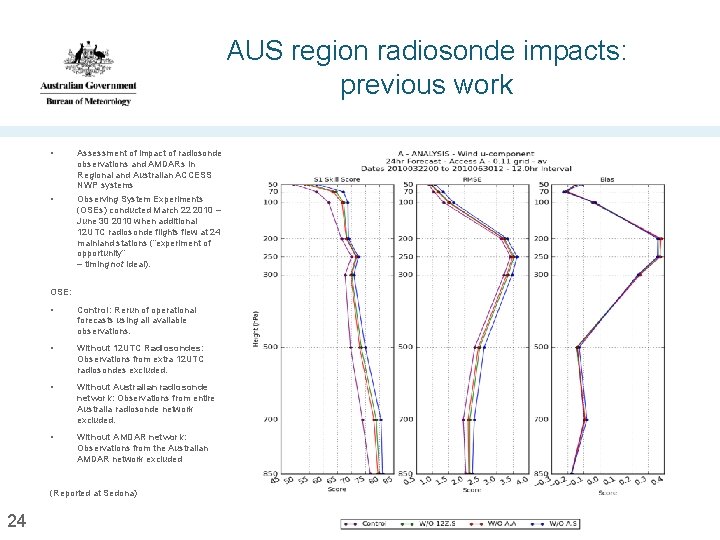
AUS region radiosonde impacts: previous work • Assessment of impact of radiosonde observations and AMDARs in Regional and Australian ACCESS NWP systems • Observing System Experiments (OSEs) conducted March 22 2010 – June 30 2010 when additional 12 UTC radiosonde flights flew at 24 mainland stations (“experiment of opportunity” – timing not ideal). OSE: • Control: Rerun of operational forecasts using all available observations. • Without 12 UTC Radiosondes: Observations from extra 12 UTC radiosondes excluded. • Without Australian radiosonde network: Observations from entire Australia radiosonde network excluded. • Without AMDAR network: Observations from the Australian AMDAR network excluded (Reported at Sedona) 24
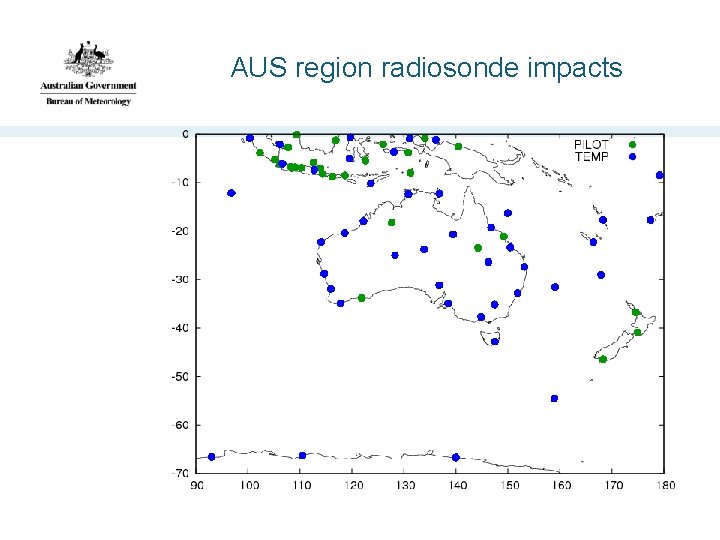
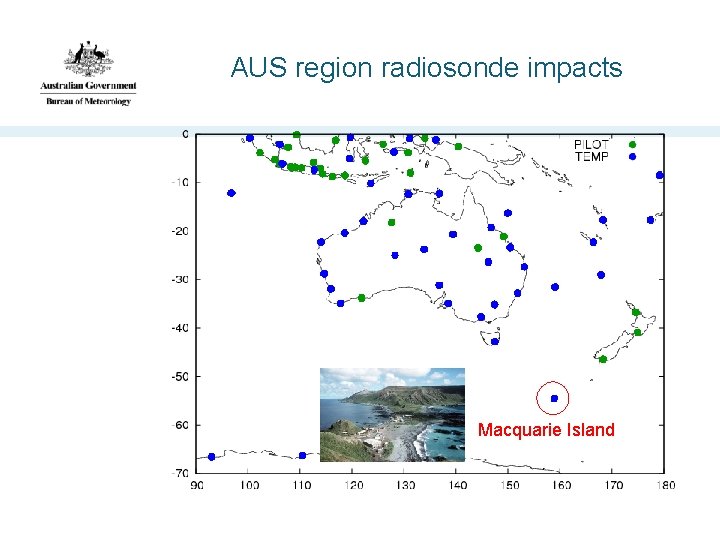
AUS region radiosonde impacts
AUS region radiosonde impacts Macquarie Island
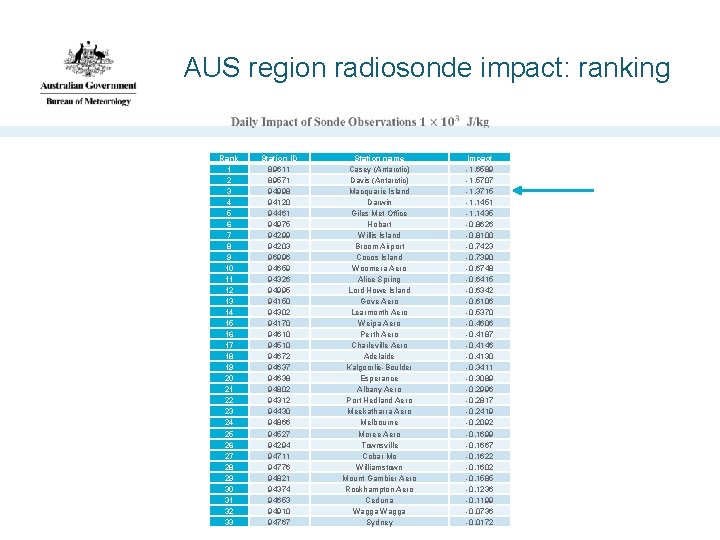
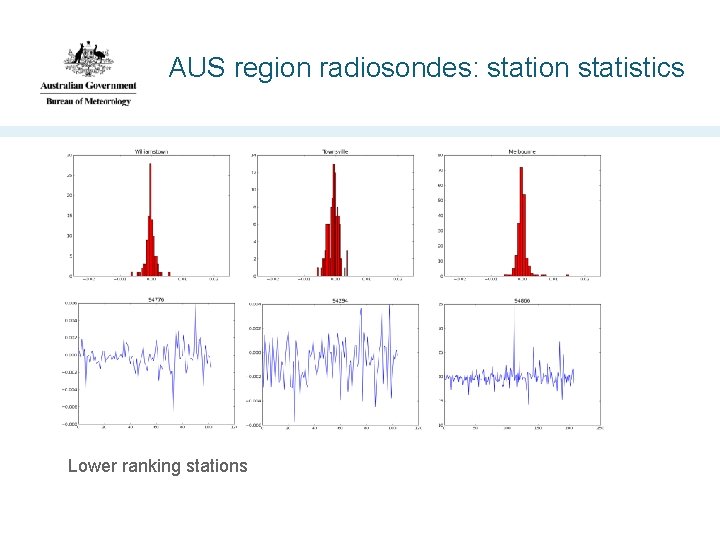
AUS region radiosonde impact: ranking Rank 1 2 3 4 5 6 7 8 9 10 11 12 13 14 15 16 17 18 19 20 21 22 23 24 25 26 27 28 29 30 31 32 33 Station ID 89611 89571 94998 94120 94461 94975 94299 94203 96996 94659 94326 94995 94150 94302 94170 94610 94510 94672 94637 94638 94802 94312 94430 94866 94527 94294 94711 94776 94821 94374 94653 94910 94767 Station name Casey (Antarctic) Davis (Antarctic) Macquarie Island Darwin Giles Met Office Hobart Willis Island Broom Airport Cocos Island Woomera Aero Alice Spring Lord Howe Island Gove Aero Learmonth Aero Weipa Aero Perth Aero Charleville Aero Adelaide Kalgoorlie-Boulder Esperance Albany Aero Port Hedland Aero Meekatharra Aero Melbourne Moree Aero Townsville Cobar Mo Williamstown Mount Gambier Aero Rockhampton Aero Ceduna Wagga Sydney Impact -1. 6589 -1. 5707 -1. 3715 -1. 1451 -1. 1435 -0. 8626 -0. 8100 -0. 7423 -0. 7390 -0. 6748 -0. 6415 -0. 6342 -0. 6106 -0. 5370 -0. 4606 -0. 4187 -0. 4146 -0. 4130 -0. 3411 -0. 3089 -0. 2996 -0. 2817 -0. 2419 -0. 2092 -0. 1699 -0. 1667 -0. 1622 -0. 1602 -0. 1585 -0. 1236 -0. 1199 -0. 0736 -0. 0172
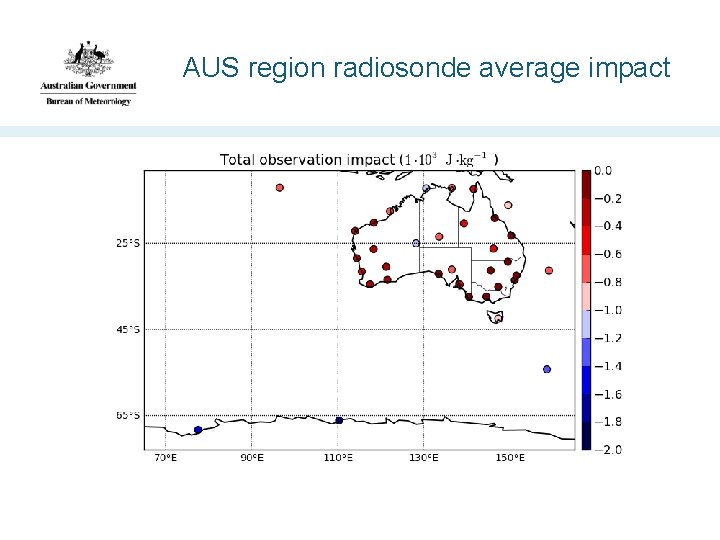
AUS region radiosonde average impact
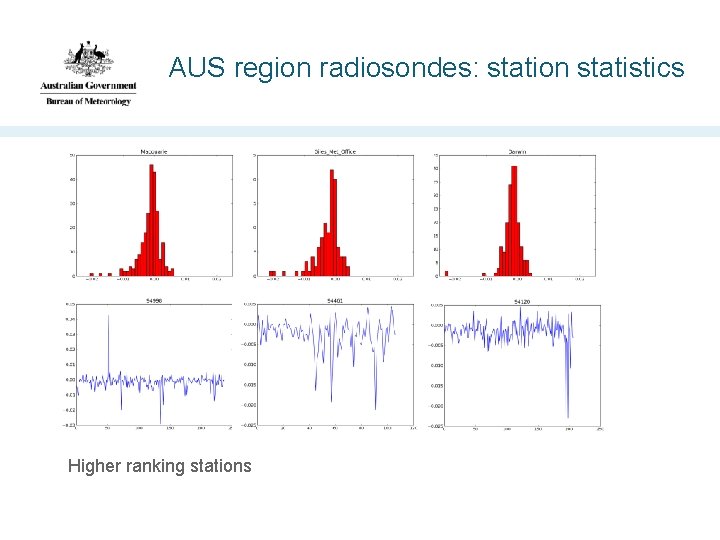
AUS region radiosondes: station statistics Higher ranking stations
AUS region radiosondes: station statistics Lower ranking stations
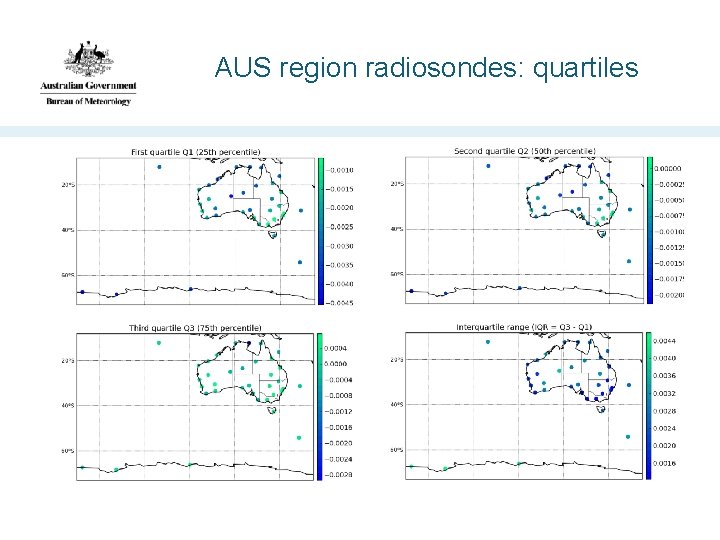
AUS region radiosondes: quartiles
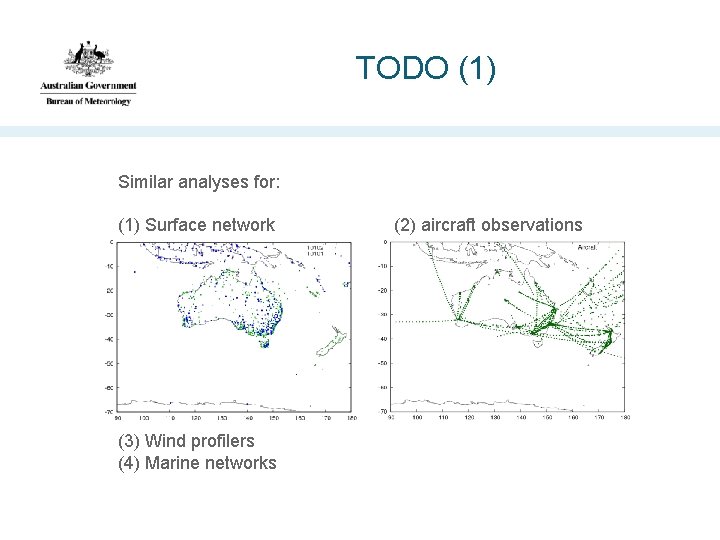
TODO (1) Similar analyses for: (1) Surface network (2) aircraft observations (3) Wind profilers (4) Marine networks
TODO (2) • AUS station ranking statistics (how many times does station X appear in the top quarter ? Second quarter ? … • Stakeholder engagement: – What do other people want ? – How and where would they like to see it ? – Events/periods of interest ? – How best to use these results to guide network planning ? • Stakeholder education: not the only way to assess the value of observations (e. g. the anchoring role of unbiased observations).
TODO (3) • Use an AUS-region energy norm in the global suite • Retrospective ACCESS-G runs for periods of particular interest • Regional NWP: ACCESS-R FSO ? • Satellite channel impact analyses • Relative impact of locally received and processed satellite observations (important source of low latency data and inputstream robustness). • Other error metrics ?
Summary • We have commenced routine running of an FSO suite in conjunction with the Bureau's operational global ACCESS NWP suite • Development of analysis and visualisation tools is in progress • Bureau stakeholder engagement will inform the way in which the FSO output is analysed and presented
- Slides: 34