For the 10 th Annual Spuyten Duyvil Undergraduate


 Do the Internet")

 in the human body CP (0) = 12. 2699,")
, the concentration of LSD in the Tissues as")
")

")


 = 763 -1,")
 = 763 -1, I(0) =")

. Using Vernier")


 gently toss them out onto the")

, the number of M&M cells which are")


")


- Slides: 59
For the 10 th Annual Spuyten Duyvil Undergraduate Mathematics Conference, Manhattan College Modeling First Teaching of Differential Equations – SIMIODE 0930, 16 April 2015 Miguell Hall 207 Brian Winkel, PROF Emeritus, Mathematical Sciences, United States Military Academy West Point NY 10996 USA Brian. Winkel@simiode. org Director SIMIODE www. simiode. org
We present an approach we have used for years and are developing as a web-based community of teachers and learners Systemic Initiative for Modeling Investigations and Opportunities with Differential Equations www. simiode. org Modeling first differential equations We discuss examples of activities to enable students to develop mathematical modeling skills using differential equations while using technology throughout their learning and doing mathematics.
SIMIODE Team Leigh Noble, Technical Director and applied mathematician Mark Tourtellott, Technical Director, Art Designer Jessica Libertini – VMI - Virginia Military Institute, Associate Director Karen Bliss – Quinnipiac U and then VMI, Associate Director Brian Winkel, Director, Emeritus Math. Sci, USMA Eric Sullivan, Carroll College Ted Wendt, Carroll College Audrey Malagon, VA Wesleyan College Board of Contributing Advisors
i
Sources of modeling opportunities with data are all about us. (1) Do the Internet thing, (2) browse library journals – current and the stacks in fields not known to you, (3) talk to colleagues OUTside mathematics, (4) do your own, e. g. , spread of slime or cookie dough! (5) attend other department seminars and conferences, (6) see ideas in Teachers Group at www. simiode. org. Take risks, learn yourself, jump into the modeling process with your students, and have fun learning with them! Reference: Winkel, B. J. 2013. Browsing Your Way to Better Teaching. PRIMUS: Problems, Resources, and Issues in Mathematics Undergraduate Studies. 23(3): 274 -290. Original references in this paper.
A place find resources for teaching. . . . and another place to share your teaching efforts. . .
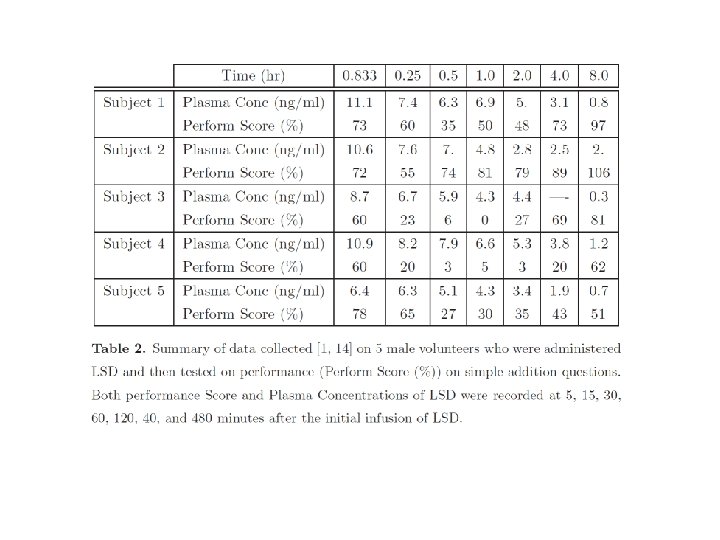
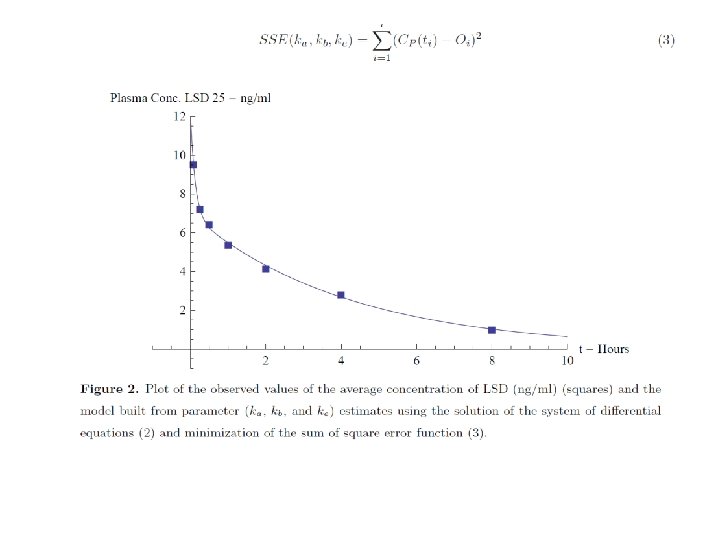
Modeling Lysergic acid diethylamide (LSD) in the human body CP (0) = 12. 2699, for originally LSD was injected at a concentration of 2, 000 ng per kg of body mass for each subject and so we have an initial concentration in the plasma of 12. 2699 = 2000 M/. 163 M 1000 ng of LSD/kg of body mass. CT(0) = 0. COMPARTMENT MODEL P = Plasma and T = Tissue Reference: Winkel, B. J. 2013. Browsing Your Way to Better Teaching. PRIMUS: Problems, Resources, and Issues in Mathematics Undergraduate Studies. 23(3): 274 -290. Original references in this paper.
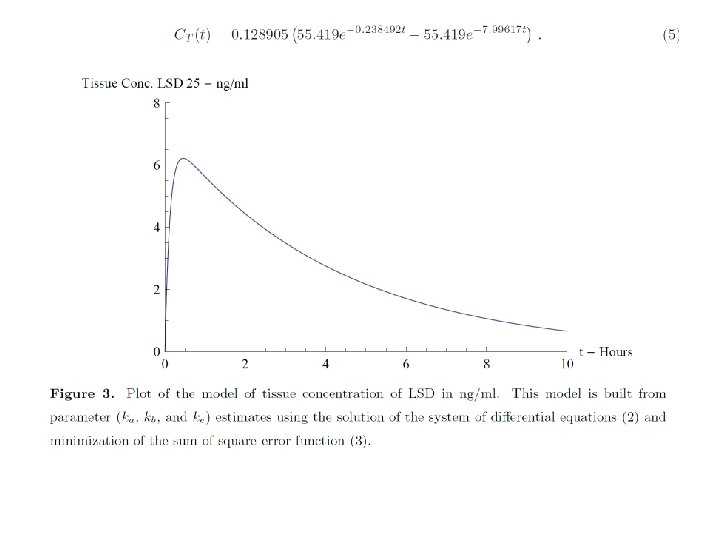
This is the formula for CT(t), the concentration of LSD in the Tissues as a function of time t. Solving the system can be done by hand using eigenvalue approaches or with a computer algebra system (in our case Mathematica) offering a closed form solution. Take time to notice the forms machines return to us. . exponential decay in Tissues.
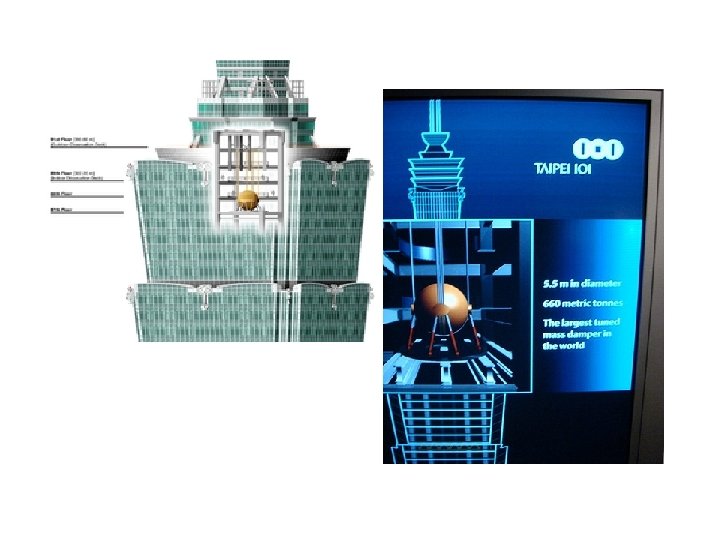
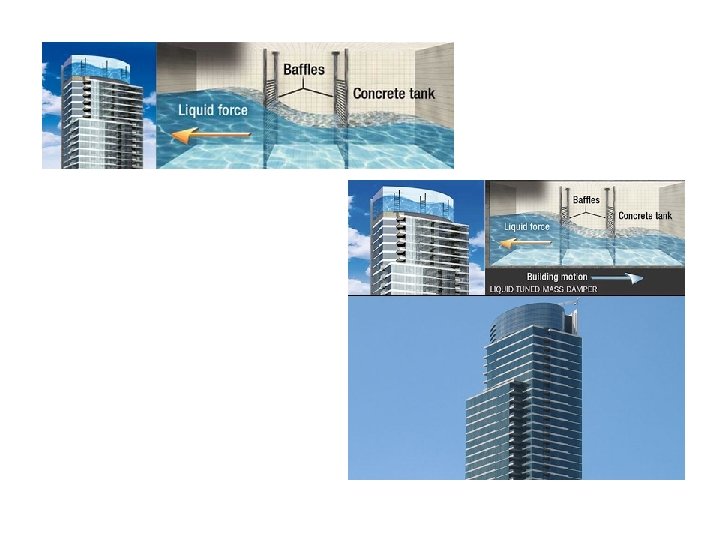
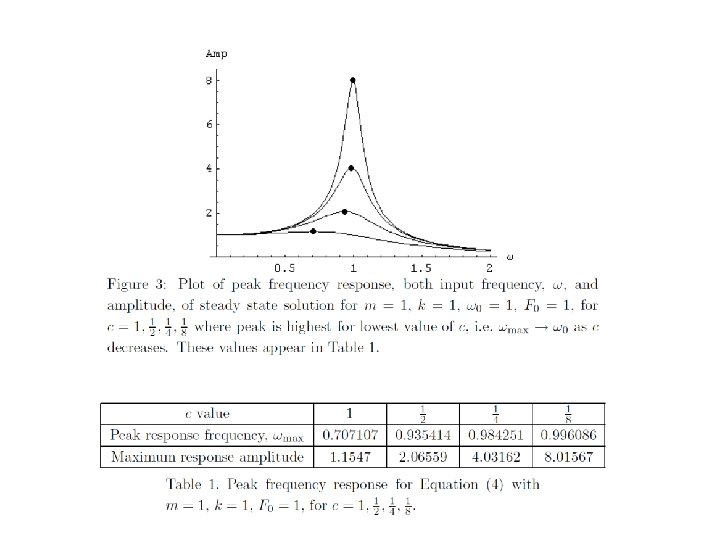
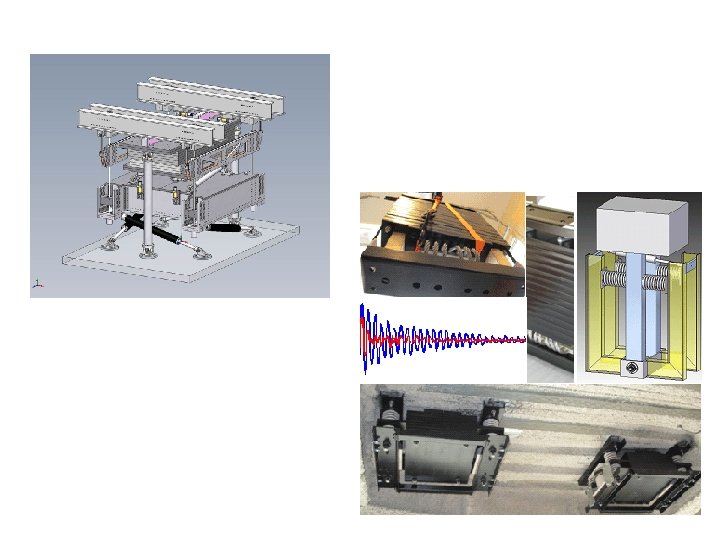
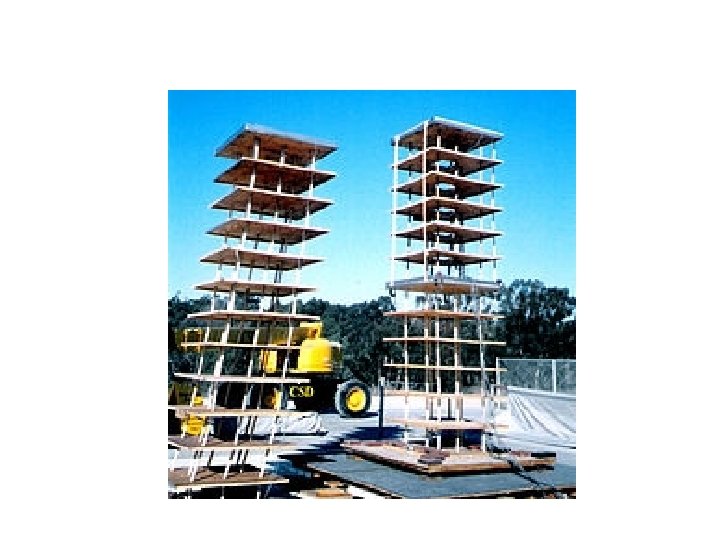
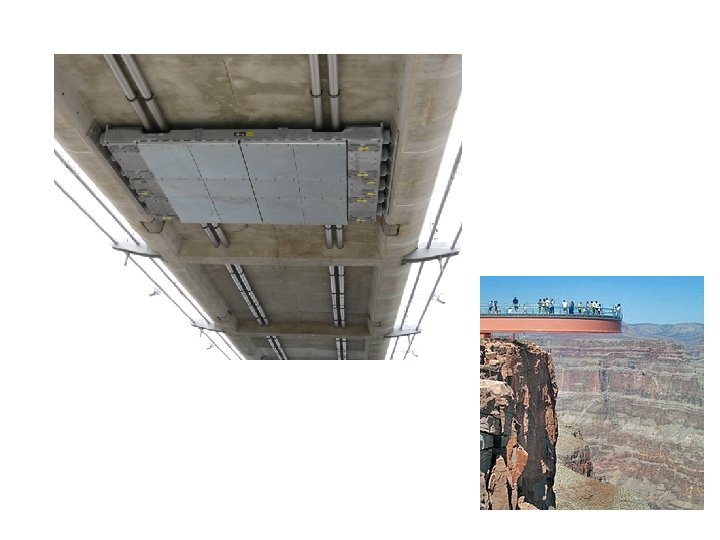
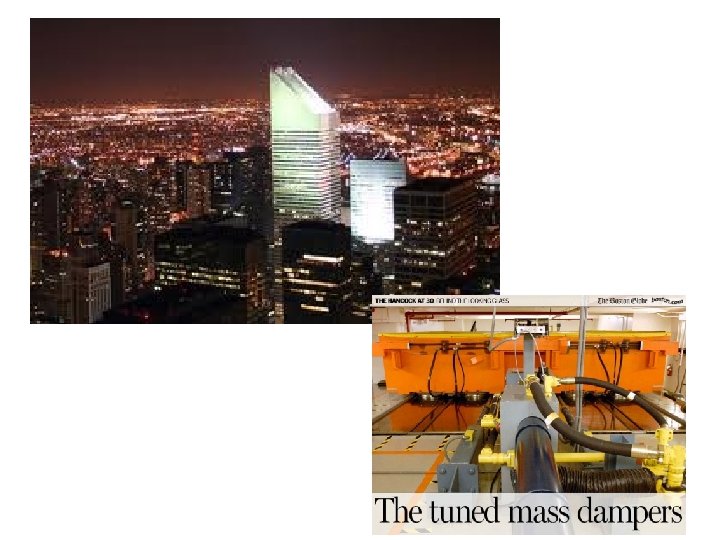
Tuned Mass Dampers Introduced in MA 364 Engineering Mathematics A Tuned Mass Damper (TMD) is a passive mechanical counterweight for a structure consisting of a moving mass (roughly 1– 2% of the structure’s mass) which is usually placed in the upper portion of the structure. The purpose of the TMD is to reduce the effects of motion caused by wind or earthquake. The first uses of TMDs in the United States for large structures was in the John Hancock Building in Boston in 1977 and City Corp Center in New York in 1978. TMD’s are used in many, many structures and devices, including buildings and bridges, electric razors, rotating tools, surgery table platforms, etc. So what is a TMD? Well it is just a system of two second order differential equations And a physical device to implement the results. TMD’s can be in the form of sliding slabs (HUGE) of concrete and steel, sloshing tanks of water, pendula, and more. Winkel, B. J. and K. Landry. 2008. Peak Frequency Responses and Tuned Mass Dampers--Exciting Applications of Systems of Differential Equations. The UMAP Journal. 29(1): 15 -30.
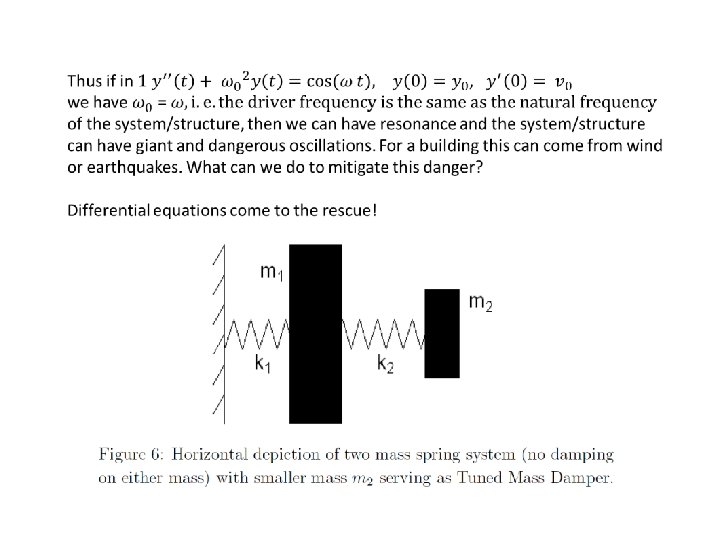
Depiction of two masses for a structure – smaller mass on top. K (spring constant) is called stiffness and c is still called damping coefficient.
In the simplified case where there is no damping (i. e. c = 0) then we might seek to control for resonance by adding a second “tuned” mass.
We now “drive” the larger mass with a force. . wind, earthquake If no second mass then we could have resonance (c=0) or high amplitude. So we add a second smaller mass and we “tune” it so that its system has the same frequency as that of the larger mass.
Now, by examining the solution of our system we can combine terms, simplify, and determine that the amplitude of the resulting oscillation of mass is A picture is worth. . . How many words. . or equations?
So if we are willing to add more and more mass we get a wider “safe” region.
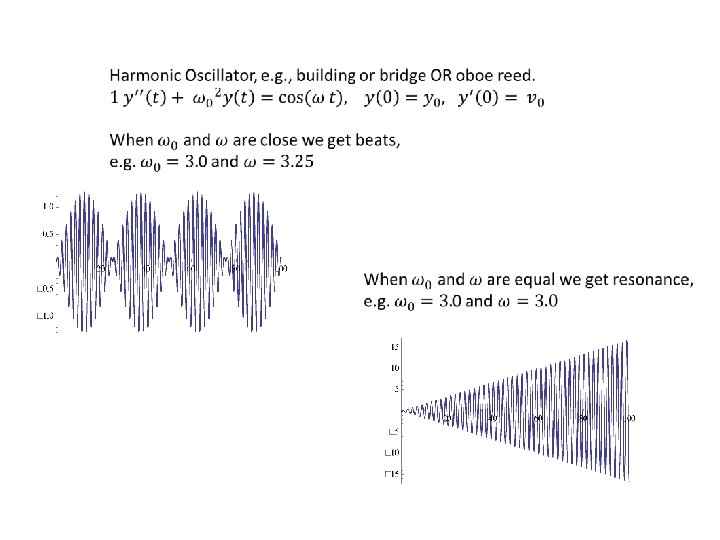
Incidentally, if we go back to just our one mass system with a driving force How big can the response, amp(w), really be? We seek the maximum frequency response of amp(w). Again, a picture. .
Source: Communicable Disease Surveillance Center. 1978. News and Notes: Influenza in a Boarding School. British Medical Journal. 1(6112). http: //www. pubmedcentral. nih. gov / picrender. fcgi? artid=1603269&blobtype. pdf. Accessed 5 September 2008.
Continuous Model Using grid in parameter space to minimize with S(0) = 763 -1, I(0) = 1, and R(0) = 0 we obtain a = 0. 00218 and b = 0. 441.
Discrete Model Using EXCEL’s Solver to minimize with S(0) = 763 -1, I(0) = 1, and R(0) = 0 we obtain a = 0. 00291 and b = 0. 72.
Source: Hrenoff, A. K. 1941. The Influenza Epidemic of 1918 -1919 in San Francisco. The Military Surgeon. November: 805 -811. Source: Miller, S, and J. Helms. 2010. The Disease that Infected Half the World: Mathematics, Biology, and History. PRIMUS. 20(3): 245 -260.
Collected data on falling coffee filters, (time in s, position in m). Using Vernier Go. Motion detector. Model built from Newton’s Second Law m y''(t) = m*g - k y' (t)r , y(0) = 0, y’(0) = v 0 Usual cases r = 1 or r = 2. However, from data k = 6. 12 and r = 0. 24 with SSE = 0. 0000511 Grid in parameter space (K, r, SSE(K, r)) and result of gradient search.
The fit is. .
Spread of Disease Process Experiment conducted at Cornwall NY USA by DR Brian Winkel, PROF Emeritus US Military Academy, West Point NY Prepare a grid (print out M&MGrid. To. Use. For. Simulations pdf file), mark 8 randomly selected cells as infected and write numbers 1 through 8 in each cell, respectively. Make a corral surrounding the grid so when we toss the M&M’s they stay on the grid. Source: Winkel, B. J. 2012. Sourcing for Parameter Estimation and Study of Logistic Differential Equation. International Journal of Mathematical Education in Science and Technology. 43(1): 67 -83.
Place 54 M&M’s in a cup and (a) gently toss them out onto the grid, (b) if an M&M contacts an infected cell/M&M mark the cell with next number of infected, first 9, then 10, then 11, etc. and remove infected M&M’s from population, (c) when all M&M’s are marked from this toss or generation collect M&M’s and toss again until all M&M’s are infected. If you cannot perform this simulation then we have done this for you and enclose 12 generations of our simulation from which you are to gather data on the number of infected at each generation or time.
Equipment: 1 small bag regular M&M’s 1 small cup 1 level surface Early actions: Prepare grid with 8 randomly selected infected cells. Number them as seen here. Open bag and count out 54 M&M’ s. Place M&M’s in cup. Gently toss M&M’s onto surface. If M&M contacts an infected cell/M&M mark the cell with next number of infected, first 9, then 10, then 11, etc. Remove infected M&M’s from population. When all M&M’s are marked from this toss Or generation. Collect M&M’s and toss again. Later action: Yummy!!!
Collect data for each generation on y(t), the number of M&M cells which are infected. Plot the number of infecteds as a function of the generation (time). Propose a mathematical model, using a differential equation for the rate of spread of the disease. Estimate the parameters using a sum of square errors method. Compare your model to your data, numerically and graphically. Does your model do a reasonable and reasoned job of modeling this data and hence this phenomenon?
Generation 1
Generation 1
Generation 1
Generation 8
Generation 10
Generation 10
Generation 10
Generation 13
Generation 13
Generation 13
Generation 14
Generation 14
Plot of data from M&M Generation Efforts. Logistic mathematical model of spread of disease.
Solve DE and form SSE between Data and model. Plot SSE = SSE(r, K) as contour plot.
The fit is. .
Torricelli’s Law Video on SIMIODE You. Tube Channel
Model compared to the data we collect. . .
To see other examples go to www. simiode. org and register. It is FREE. Then join the Teachers Group. It is FREE. Resources, modeling scenarios, projects, technique narratives, and more are there. See our videos at our SIMIODE You. Tube Channel Type this in Google. Each instructional unit has a Student Version with just STATEMENT while inside the Teachers Group there is a version with STATEMENT and extensive COMMENTS Section as well as other resources, e. g. , Excel or Mathematica file with solution strategies. We show a sample of the variety of applications or models to motive the study of differential equations.
Modeling Death and Immigration with M&M 's and Simulation Saving for Child's College Education Modeling the Spread of Oil Slick with Incomplete Data Analysis of incomplete reaction data Modeling Immigration in a Petri Dish How long does it take an ant to build a tunnel of length x in soil? Hang Time Modeling the spread of ICU’s in US Hospitals from 1958 -1974 Chemical Kinetics Models -Zeroth, First, and Second Order Reactions Sublimation of Carbon Dioxide Modeling the Emptying of a Column of Water Modeling drugs for anesthesiology Which melts first, a sphere or cube of ice of the same volume? Modeling dissipation of intraocular gas bubbles used in eye surgery. Changing temperature of container of water in a changing environment Modeling sales of consumer products from a classic marketing study Using data on whiffle ball fall model resistance and predict the fall position Modeling a falling shuttlecock Modeling Dialysis Machine Modeling drug absorption of analgesic pain reliever under two different diets Insect Colony Optimal Control Modeling the amount of shampoo in a bottle during a shower Building a model to help cross a river with current to land at specific spot Convolution Applications – Machine Replacement Theory
i
Want to teach differential equations using modeling and technology up front and throughout the process? Then join us at. . SIMIODE Systemic Initiative for Modeling Investigations and Opportunities with Differential Equations www. simiode. org Thank you.