
For Professional Investors Only Not For Onward Distribution

For Professional Investors Only- Not For Onward Distribution JPMorgan Indian Investment Trust plc January 2010 Rukhshad Shroff, CFA Rajendra Nair, CFA
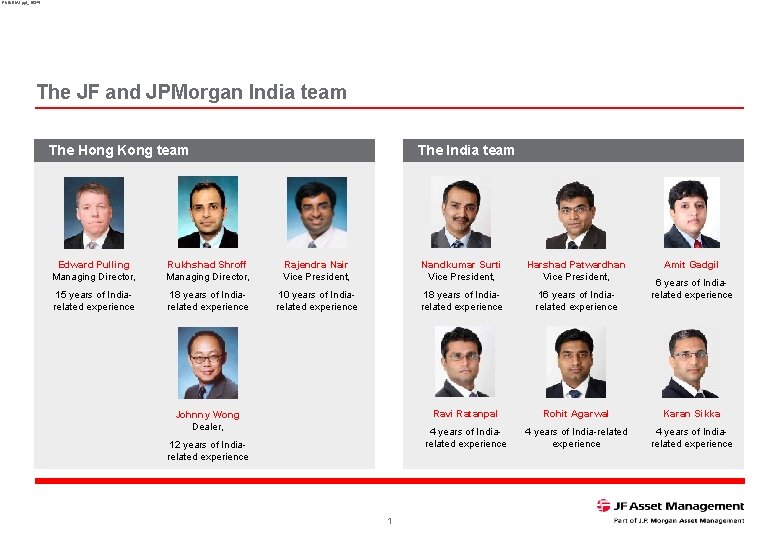
RNINDIA 1. ppt_16345 The JF and JPMorgan India team The Hong Kong team The India team Edward Pulling Managing Director, Rukhshad Shroff Managing Director, Rajendra Nair Vice President, Nandkumar Surti Vice President, Harshad Patwardhan Vice President, 15 years of Indiarelated experience 18 years of Indiarelated experience 10 years of Indiarelated experience 18 years of Indiarelated experience 16 years of Indiarelated experience Johnny Wong Dealer, 12 years of Indiarelated experience 1 Amit Gadgil 6 years of Indiarelated experience Ravi Ratanpal Rohit Agarwal Karan Sikka 4 years of Indiarelated experience 4 years of India-related experience 4 years of Indiarelated experience
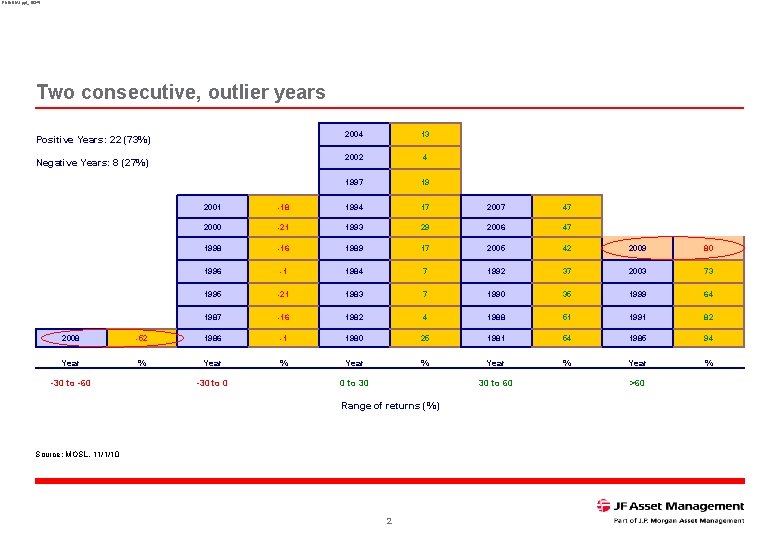
RNINDIA 1. ppt_16345 Two consecutive, outlier years Positive Years: 22 (73%) Negative Years: 8 (27%) 2004 13 2002 4 1997 19 2001 -18 1994 17 2007 47 2000 -21 1993 29 2006 47 1998 -16 1989 17 2005 42 2009 80 1996 -1 1984 7 1992 37 2003 73 1995 -21 1983 7 1990 35 1999 64 1987 -16 1982 4 1988 51 1991 82 2008 -52 1986 -1 1980 25 1981 54 1985 94 Year % Year % -30 to -60 -30 to 0 0 to 30 30 to 60 >60 Range of returns (%) Source: MOSL, 11/1/10 2
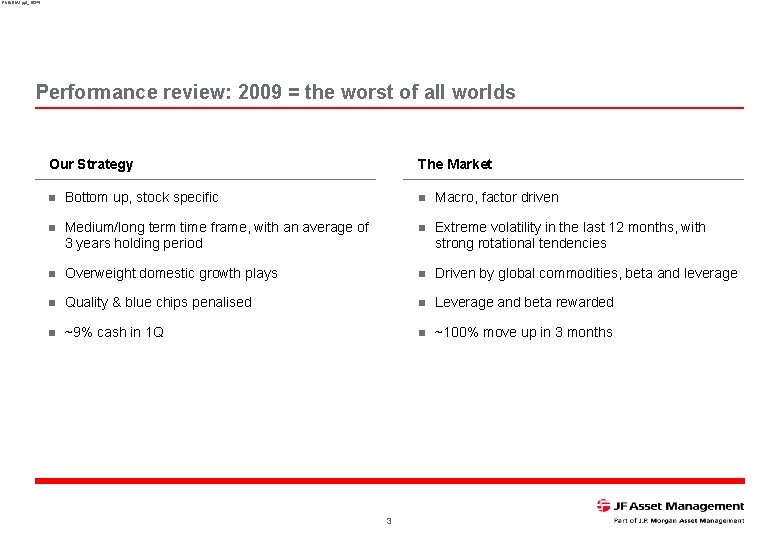
RNINDIA 1. ppt_16345 Performance review: 2009 = the worst of all worlds Our Strategy The Market n Bottom up, stock specific n Macro, factor driven n Medium/long term time frame, with an average of 3 years holding period n Extreme volatility in the last 12 months, with strong rotational tendencies n Overweight domestic growth plays n Driven by global commodities, beta and leverage n Quality & blue chips penalised n Leverage and beta rewarded n ~9% cash in 1 Q n ~100% move up in 3 months 3
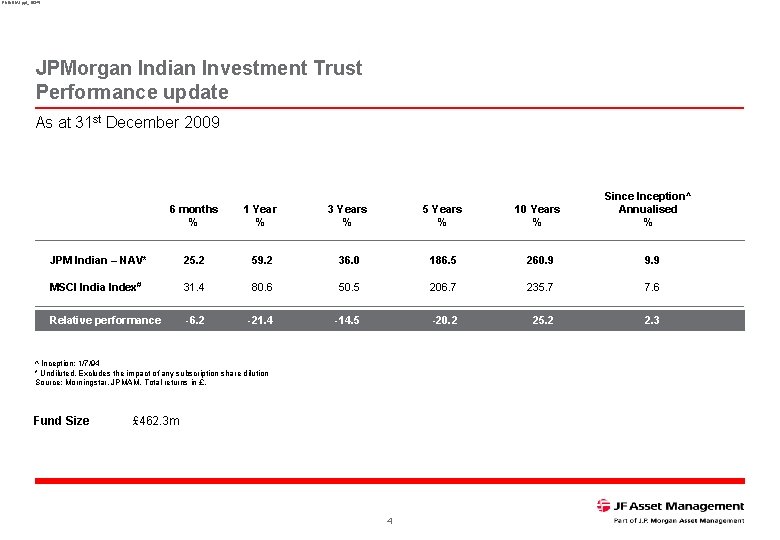
RNINDIA 1. ppt_16345 JPMorgan Indian Investment Trust Performance update As at 31 st December 2009 Since Inception^ Annualised % 6 months % 1 Year % 3 Years % 5 Years % 10 Years % JPM Indian – NAV* 25. 2 59. 2 36. 0 186. 5 260. 9 9. 9 MSCI India Index# 31. 4 80. 6 50. 5 206. 7 235. 7 7. 6 Relative performance -6. 2 -21. 4 -14. 5 -20. 2 25. 2 2. 3 ^ Inception: 1/7/94 * Undiluted. Excludes the impact of any subscription share dilution Source: Morningstar, JPMAM. Total returns in £. Fund Size £ 462. 3 m 4
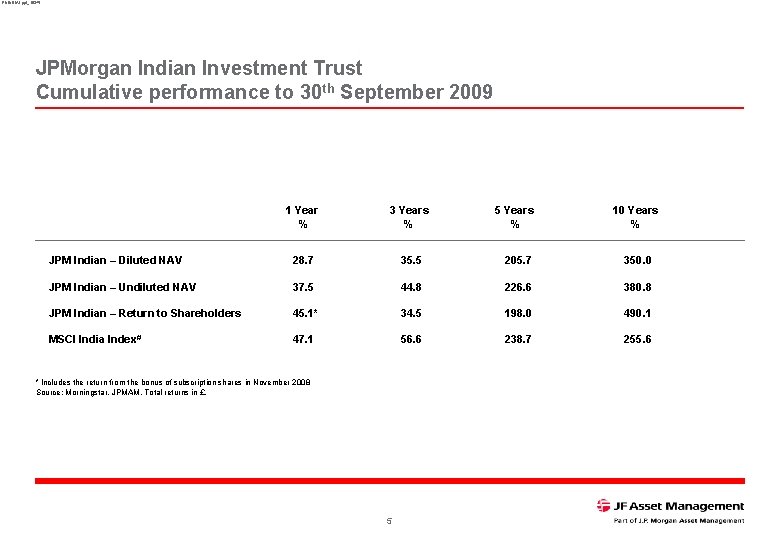
RNINDIA 1. ppt_16345 JPMorgan Indian Investment Trust Cumulative performance to 30 th September 2009 1 Year % 3 Years % 5 Years % 10 Years % JPM Indian – Diluted NAV 28. 7 35. 5 205. 7 350. 0 JPM Indian – Undiluted NAV 37. 5 44. 8 226. 6 380. 8 JPM Indian – Return to Shareholders 45. 1* 34. 5 198. 0 490. 1 MSCI India Index# 47. 1 56. 6 238. 7 255. 6 * Includes the return from the bonus of subscription shares in November 2008 Source: Morningstar, JPMAM. Total returns in £. 5
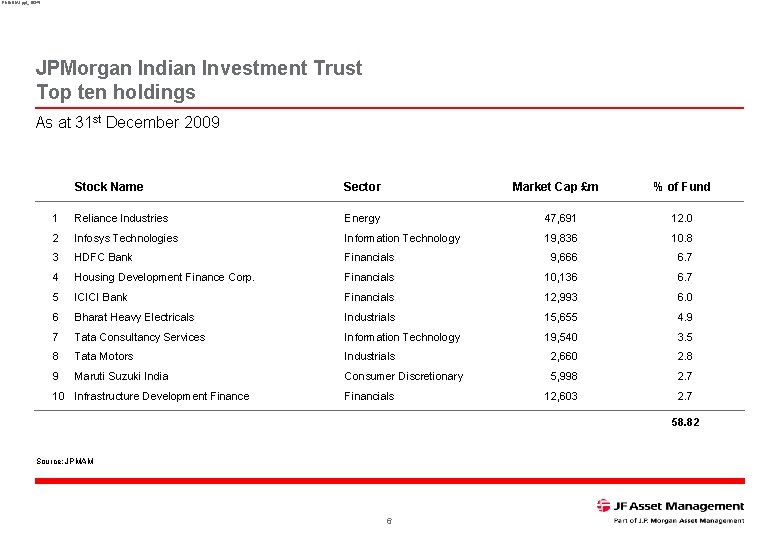
RNINDIA 1. ppt_16345 JPMorgan Indian Investment Trust Top ten holdings As at 31 st December 2009 Stock Name Sector 1 Reliance Industries Energy 47, 691 12. 0 2 Infosys Technologies Information Technology 19, 836 10. 8 3 HDFC Bank Financials 9, 666 6. 7 4 Housing Development Finance Corp. Financials 10, 136 6. 7 5 ICICI Bank Financials 12, 993 6. 0 6 Bharat Heavy Electricals Industrials 15, 655 4. 9 7 Tata Consultancy Services Information Technology 19, 540 3. 5 8 Tata Motors Industrials 2, 660 2. 8 9 Maruti Suzuki India Consumer Discretionary 5, 998 2. 7 12, 603 2. 7 10 Infrastructure Development Finance Market Cap £m Financials % of Fund 58. 82 Source: JPMAM 6
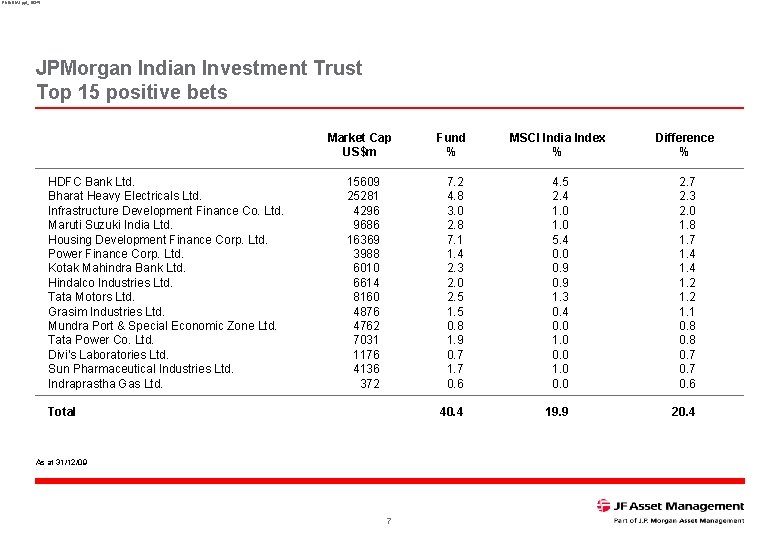
RNINDIA 1. ppt_16345 JPMorgan Indian Investment Trust Top 15 positive bets HDFC Bank Ltd. Bharat Heavy Electricals Ltd. Infrastructure Development Finance Co. Ltd. Maruti Suzuki India Ltd. Housing Development Finance Corp. Ltd. Power Finance Corp. Ltd. Kotak Mahindra Bank Ltd. Hindalco Industries Ltd. Tata Motors Ltd. Grasim Industries Ltd. Mundra Port & Special Economic Zone Ltd. Tata Power Co. Ltd. Divi's Laboratories Ltd. Sun Pharmaceutical Industries Ltd. Indraprastha Gas Ltd. Market Cap US$m Fund % MSCI India Index % Difference % 15609 25281 4296 9686 16369 3988 6010 6614 8160 4876 4762 7031 1176 4136 372 7. 2 4. 8 3. 0 2. 8 7. 1 1. 4 2. 3 2. 0 2. 5 1. 5 0. 8 1. 9 0. 7 1. 7 0. 6 4. 5 2. 4 1. 0 5. 4 0. 0 0. 9 1. 3 0. 4 0. 0 1. 0 0. 0 2. 7 2. 3 2. 0 1. 8 1. 7 1. 4 1. 2 1. 1 0. 8 0. 7 0. 6 40. 4 19. 9 20. 4 Total As at 31/12/09 7
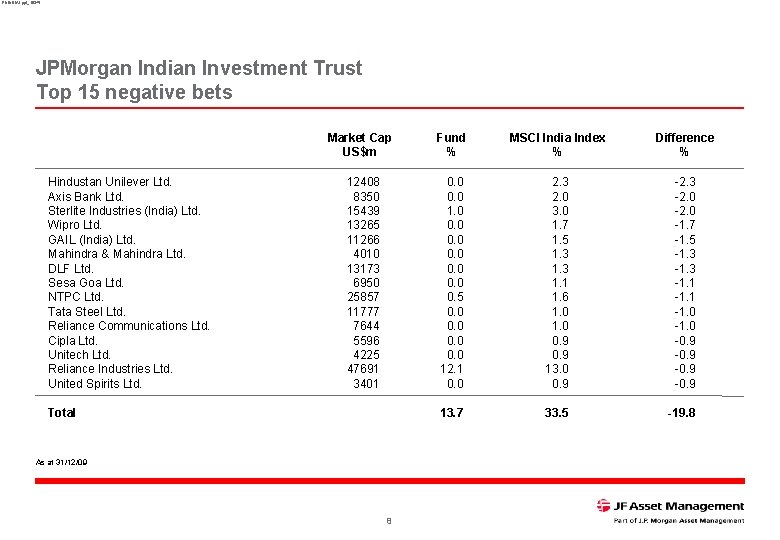
RNINDIA 1. ppt_16345 JPMorgan Indian Investment Trust Top 15 negative bets Hindustan Unilever Ltd. Axis Bank Ltd. Sterlite Industries (India) Ltd. Wipro Ltd. GAIL (India) Ltd. Mahindra & Mahindra Ltd. DLF Ltd. Sesa Goa Ltd. NTPC Ltd. Tata Steel Ltd. Reliance Communications Ltd. Cipla Ltd. Unitech Ltd. Reliance Industries Ltd. United Spirits Ltd. Market Cap US$m Fund % MSCI India Index % Difference % 12408 8350 15439 13265 11266 4010 13173 6950 25857 11777 7644 5596 4225 47691 3401 0. 0 1. 0 0. 5 0. 0 12. 1 0. 0 2. 3 2. 0 3. 0 1. 7 1. 5 1. 3 1. 1 1. 6 1. 0 0. 9 13. 0 0. 9 -2. 3 -2. 0 -1. 7 -1. 5 -1. 3 -1. 1 -1. 0 -0. 9 13. 7 33. 5 -19. 8 Total As at 31/12/09 8
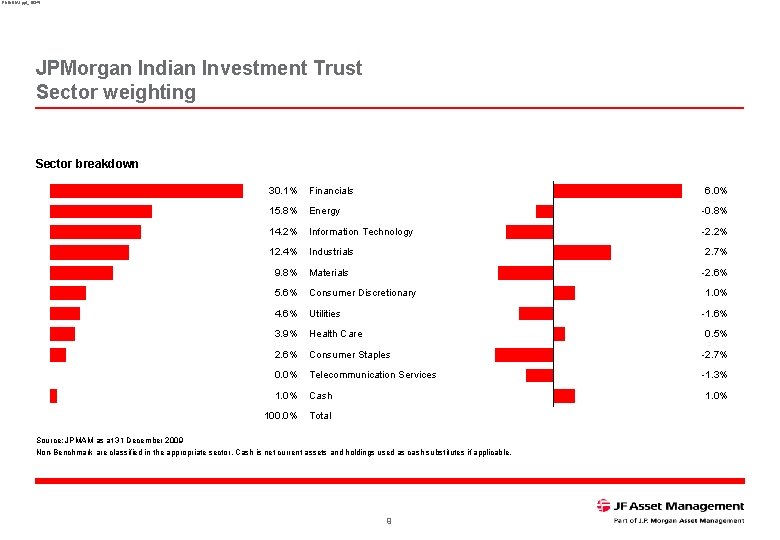
RNINDIA 1. ppt_16345 JPMorgan Indian Investment Trust Sector weighting Sector breakdown 30. 1% Financials 6. 0% 15. 8% Energy -0. 8% 14. 2% Information Technology -2. 2% 12. 4% Industrials 2. 7% 9. 8% Materials -2. 6% 5. 6% Consumer Discretionary 4. 6% Utilities 3. 9% Health Care 2. 6% Consumer Staples -2. 7% 0. 0% Telecommunication Services -1. 3% 1. 0% Cash 100. 0% Total 1. 0% -1. 6% 0. 5% 1. 0% Source: JPMAM as at 31 December 2009 Non-Benchmark are classified in the appropriate sector. Cash is net current assets and holdings used as cash substitutes if applicable. 9
RNINDIA 1. ppt_16345 Big picture view n We think the Indian economy can double in 5 -6 years time to ~US$2 trillion. n The share of investment, historically neglected, will increase as India finally takes infrastructure seriously. n Consumption will continue to grow and remain dominant, driven by favourable demographics. n Corporate earnings could double in ~4 -5 years n Foreign investment + re-allocation of domestic savings pool = positive for equities 10
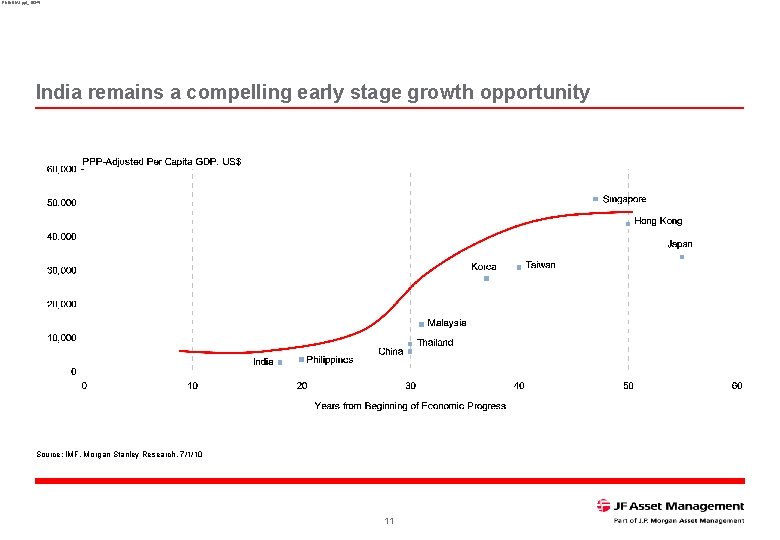
RNINDIA 1. ppt_16345 India remains a compelling early stage growth opportunity Source: IMF, Morgan Stanley Research, 7/1/10 11
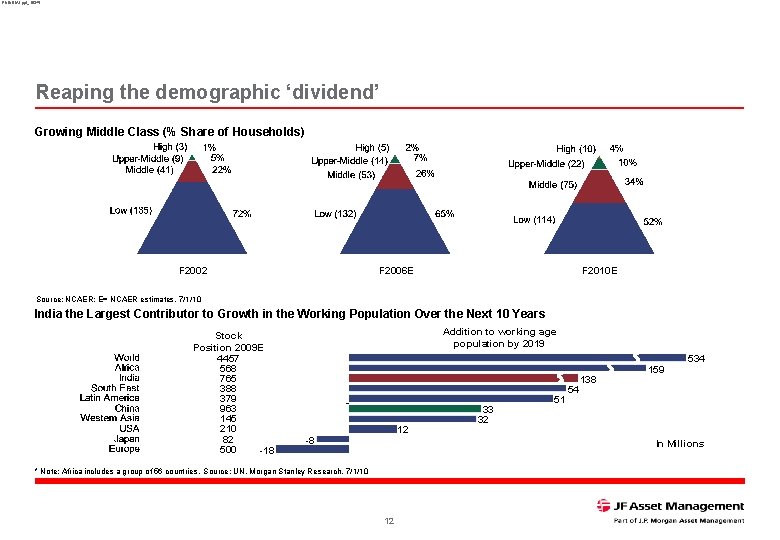
RNINDIA 1. ppt_16345 Reaping the demographic ‘dividend’ Growing Middle Class (% Share of Households) F 2002 F 2006 E F 2010 E Source: NCAER; E= NCAER estimates, 7/1/10 India the Largest Contributor to Growth in the Working Population Over the Next 10 Years Stock Position 2009 E 4457 568 765 388 379 963 145 210 82 500 -18 Addition to working age population by 2019 12 -8 33 32 51 54 138 159 534 In Millions * Note: Africa includes a group of 56 countries. Source: UN, Morgan Stanley Research, 7/1/10 12
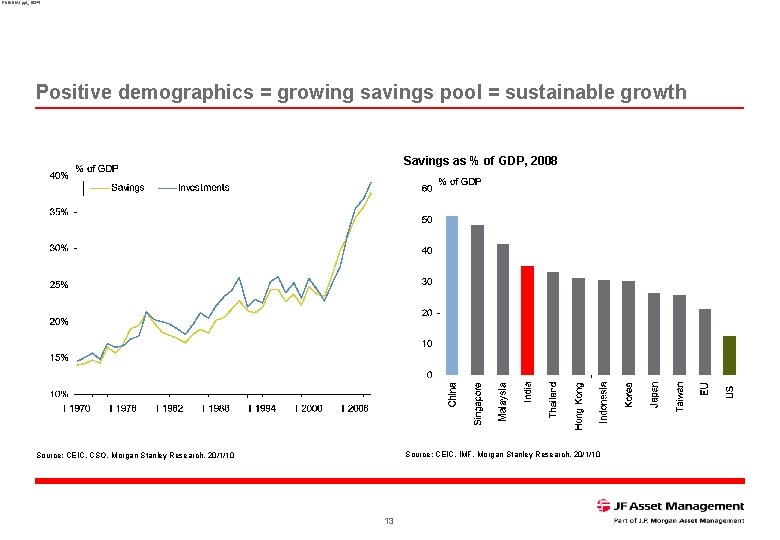
RNINDIA 1. ppt_16345 Positive demographics = growing savings pool = sustainable growth Savings as % of GDP, 2008 Source: CEIC, IMF, Morgan Stanley Research, 20/1/10 Source: CEIC, CSO, Morgan Stanley Research, 20/1/10 13
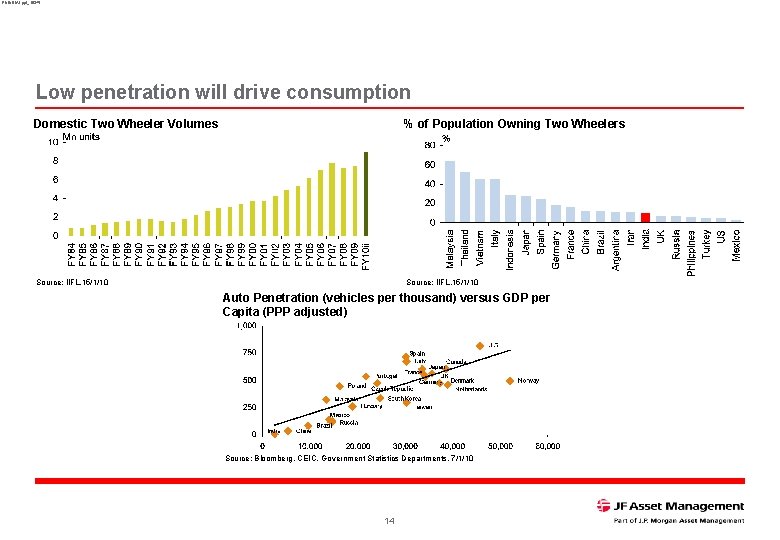
RNINDIA 1. ppt_16345 Low penetration will drive consumption Domestic Two Wheeler Volumes % of Population Owning Two Wheelers Source: IIFL, 15/1/10 Auto Penetration (vehicles per thousand) versus GDP per Capita (PPP adjusted) Source: Bloomberg, CEIC, Government Statistics Departments, 7/1/10 14
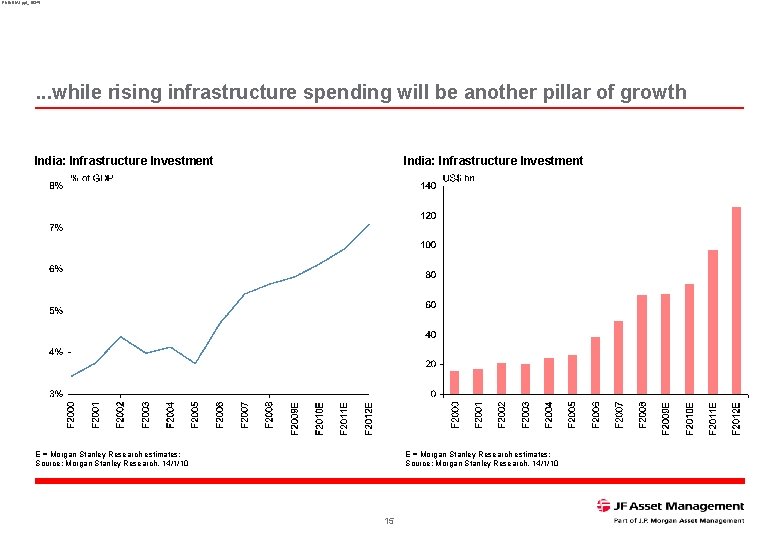
RNINDIA 1. ppt_16345 . . . while rising infrastructure spending will be another pillar of growth India: Infrastructure Investment E = Morgan Stanley Research estimates; Source: Morgan Stanley Research, 14/1/10 15
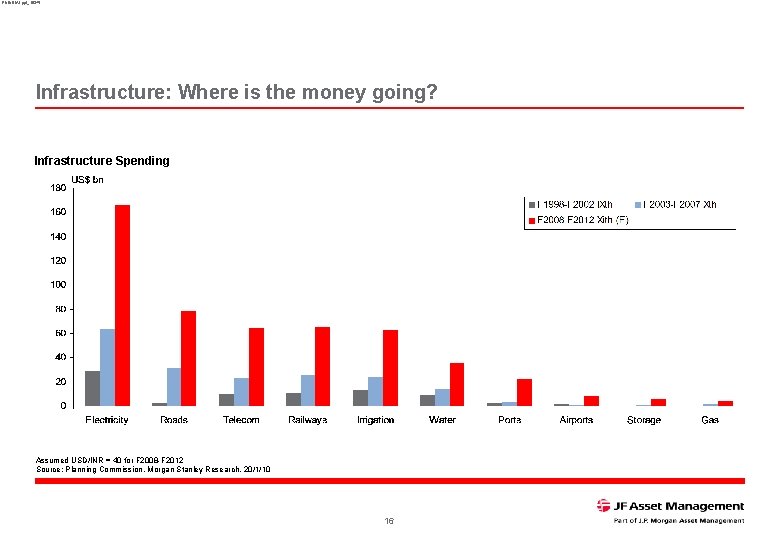
RNINDIA 1. ppt_16345 Infrastructure: Where is the money going? Infrastructure Spending Assumed USD/INR = 40 for F 2008 -F 2012 Source: Planning Commission, Morgan Stanley Research, 20/1/10 16
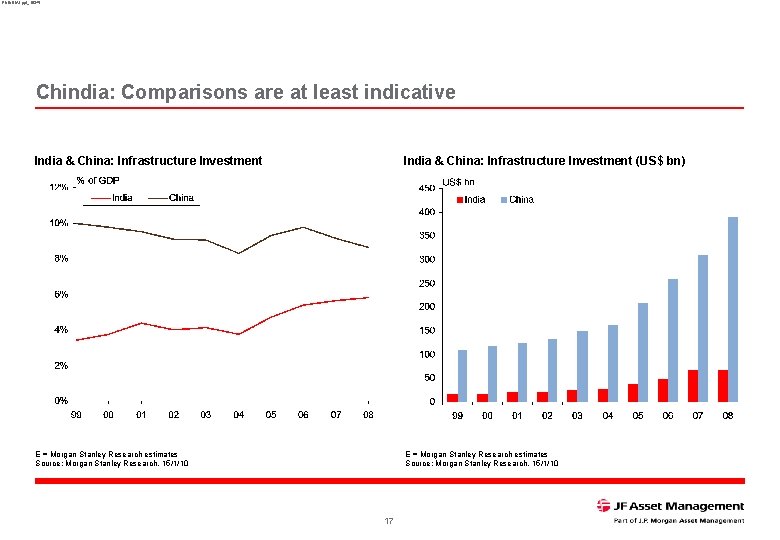
RNINDIA 1. ppt_16345 Chindia: Comparisons are at least indicative India & China: Infrastructure Investment (US$ bn) E = Morgan Stanley Research estimates Source: Morgan Stanley Research, 15/1/10 17
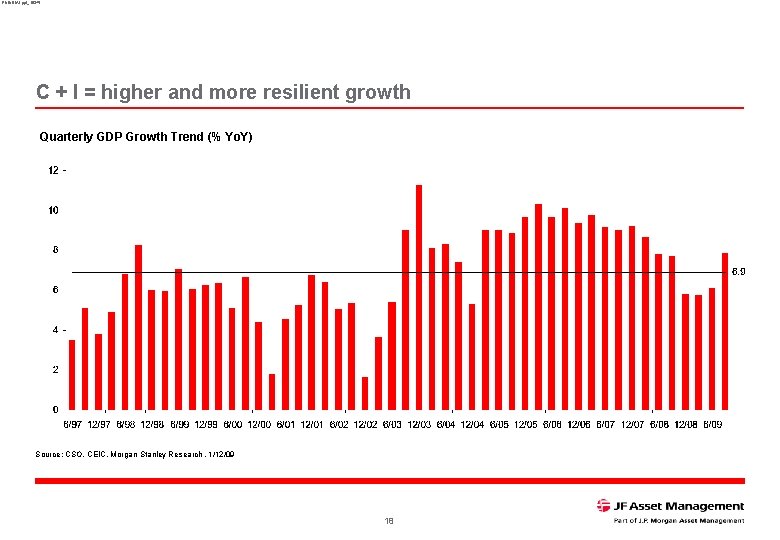
RNINDIA 1. ppt_16345 C + I = higher and more resilient growth Quarterly GDP Growth Trend (% Yo. Y) Source: CSO, CEIC, Morgan Stanley Research , 1/12/09 18
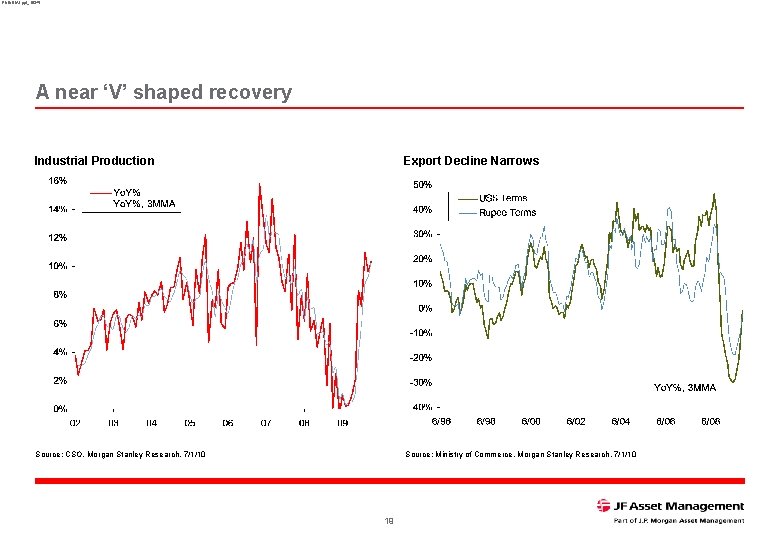
RNINDIA 1. ppt_16345 A near ‘V’ shaped recovery Industrial Production Export Decline Narrows Source: CSO, Morgan Stanley Research, 7/1/10 Source: Ministry of Commerce, Morgan Stanley Research, 7/1/10 19
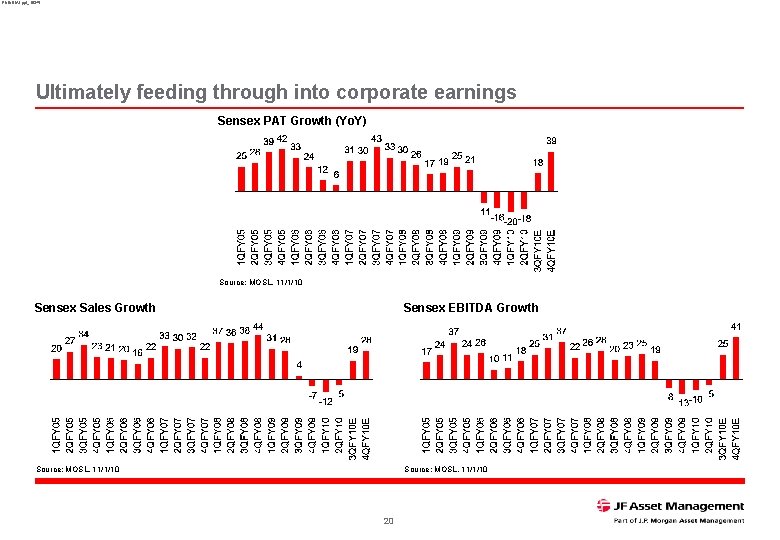
RNINDIA 1. ppt_16345 Ultimately feeding through into corporate earnings Sensex PAT Growth (Yo. Y) Source: MOSL, 11/1/10 Sensex Sales Growth Sensex EBITDA Growth Source: MOSL, 11/1/10 20
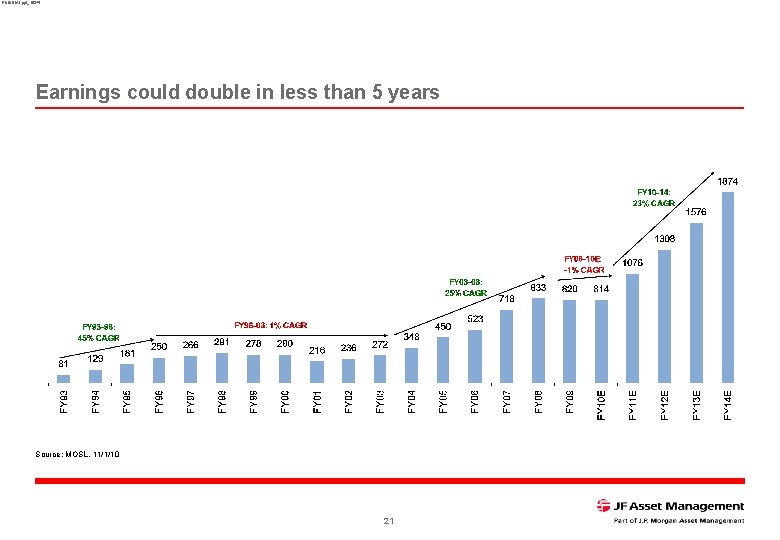
RNINDIA 1. ppt_16345 Earnings could double in less than 5 years Source: MOSL, 11/1/10 21
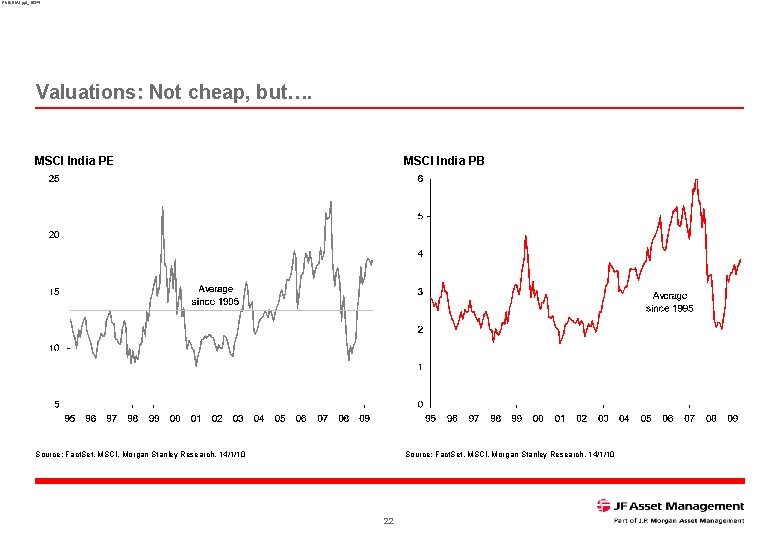
RNINDIA 1. ppt_16345 Valuations: Not cheap, but…. MSCI India PE MSCI India PB Source: Fact. Set, MSCI, Morgan Stanley Research, 14/1/10 22
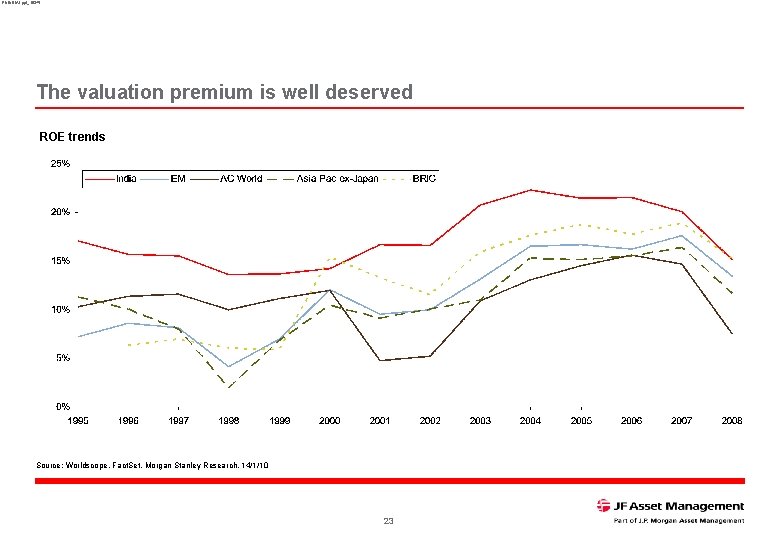
RNINDIA 1. ppt_16345 The valuation premium is well deserved ROE trends Source: Worldscope, Fact. Set, Morgan Stanley Research, 14/1/10 23
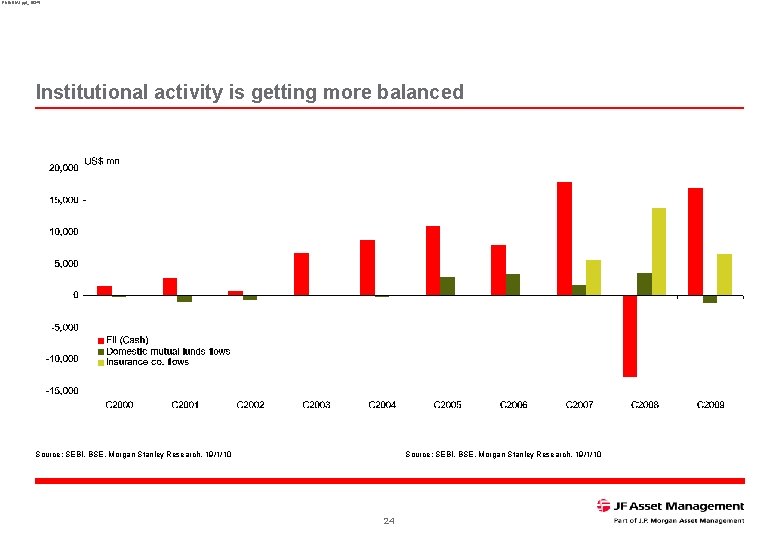
RNINDIA 1. ppt_16345 Institutional activity is getting more balanced Source: SEBI, BSE, Morgan Stanley Research, 19/1/10 24
RNINDIA 1. ppt_16345 Risks n Inflation and interest rates n Global risk appetite n Oil price n Twin deficits n Geopolitics n The unexpected 25
RNINDIA 1. ppt_16345 Summary n India remains a compelling early stage growth opportunity n Infrastructure spending and consumption will drive GDP growth n Which in turn will drive earnings growth and profitability n The opportunity will be punctuated by risks and volatility… n …yet, the market could potentially double in 3 -4 years 26

RNINDIA 1. ppt_16345 Appendix 27
RNINDIA 1. ppt_16345 Investment Process The basic premise of our process is that there are three sources of investment return: n Growth: a bigger and more profitable company adds to investment value and returns. Company contact is key to our process. We conduct hundreds of meetings per annum across countries: we analyse industries in which companies operate, the competitive landscape, management strategy to enhance competitive advantage and returns. As part of our process we not only meet companies but we meet with their competitors, distributors, suppliers and other stake holders. n Valuations: how a company is valued impacts our returns. Our valuation analysis encompasses both absolute methodologies as well as relative (to history, to regional and global comparables). We also use DCF/DDM valuation frameworks, where appropriate. n Sustainable yield: In addition to capital appreciation, dividend yield is an important source of long term returns. Analysing returns involves an analysis of the growth cycle of the business, its capital intensity and financial management. 28
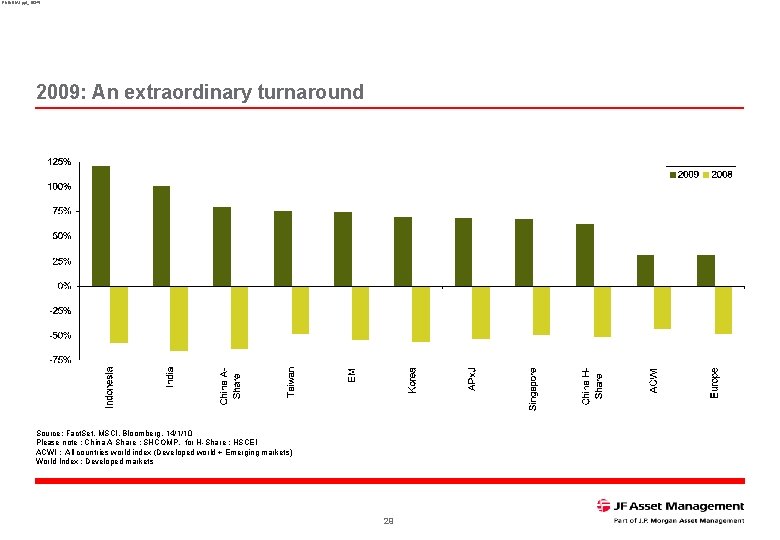
RNINDIA 1. ppt_16345 2009: An extraordinary turnaround Source: Fact. Set, MSCI, Bloomberg, 14/1/10 Please note : China A Share : SHCOMP, for H-Share : HSCEI ACWI : All countries world index (Developed world + Emerging markets) World Index : Developed markets 29
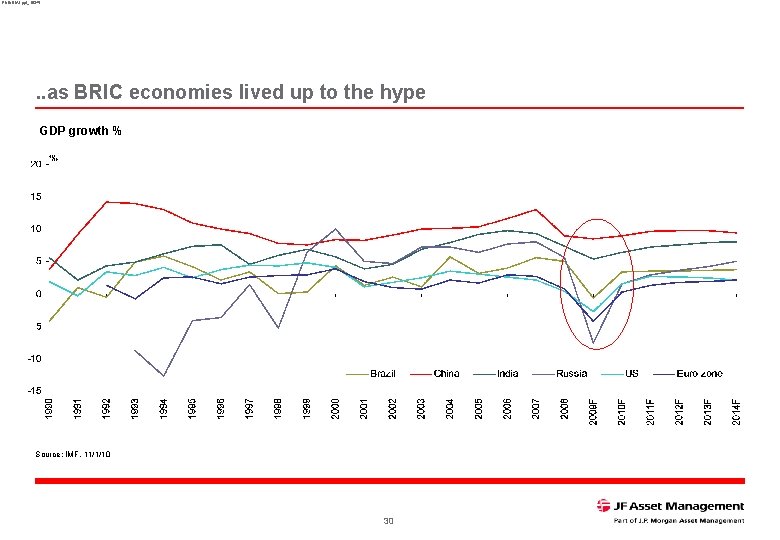
RNINDIA 1. ppt_16345 . . as BRIC economies lived up to the hype GDP growth % Source: IMF, 11/1/10 30
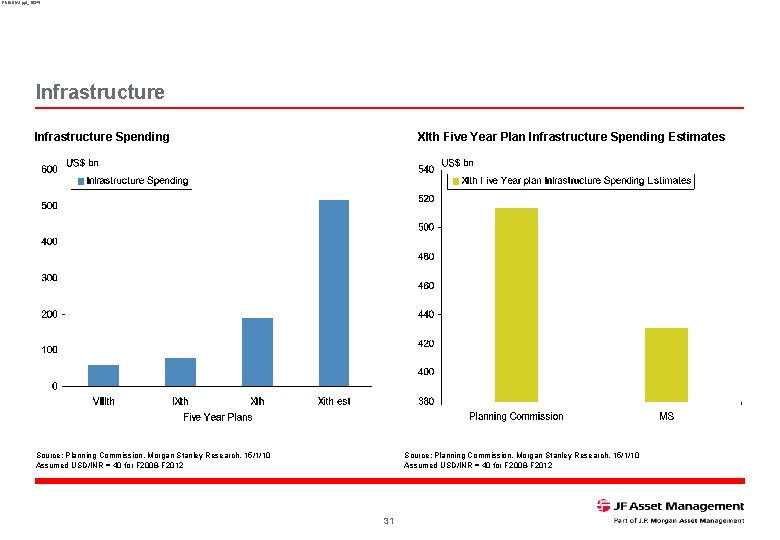
RNINDIA 1. ppt_16345 Infrastructure Spending XIth Five Year Plan Infrastructure Spending Estimates Source: Planning Commission, Morgan Stanley Research, 15/1/10 Assumed USD/INR = 40 for F 2008 -F 2012 31
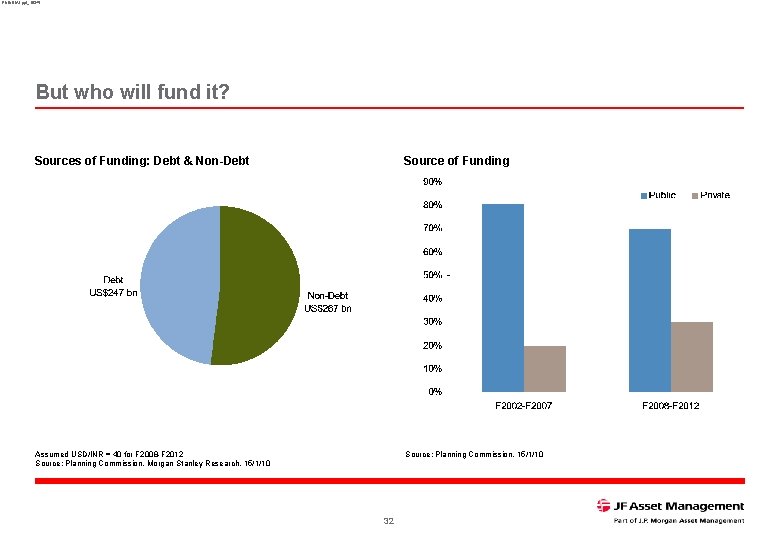
RNINDIA 1. ppt_16345 But who will fund it? Sources of Funding: Debt & Non-Debt Source of Funding Assumed USD/INR = 40 for F 2008 -F 2012 Source: Planning Commission, Morgan Stanley Research, 15/1/10 Source: Planning Commission, 15/1/10 32
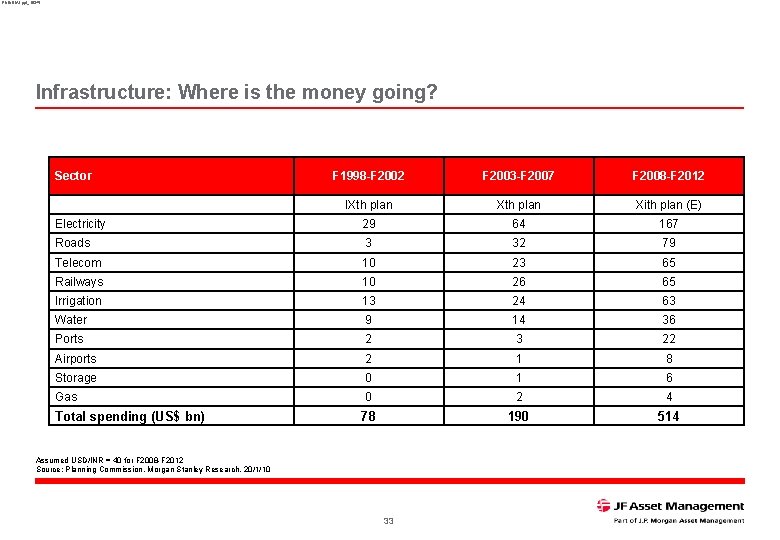
RNINDIA 1. ppt_16345 Infrastructure: Where is the money going? Sector F 1998 -F 2002 F 2003 -F 2007 F 2008 -F 2012 IXth plan Xith plan (E) Electricity 29 64 167 Roads 3 32 79 Telecom 10 23 65 Railways 10 26 65 Irrigation 13 24 63 Water 9 14 36 Ports 2 3 22 Airports 2 1 8 Storage 0 1 6 Gas 0 2 4 78 190 514 Total spending (US$ bn) Assumed USD/INR = 40 for F 2008 -F 2012 Source: Planning Commission, Morgan Stanley Research, 20/1/10 33
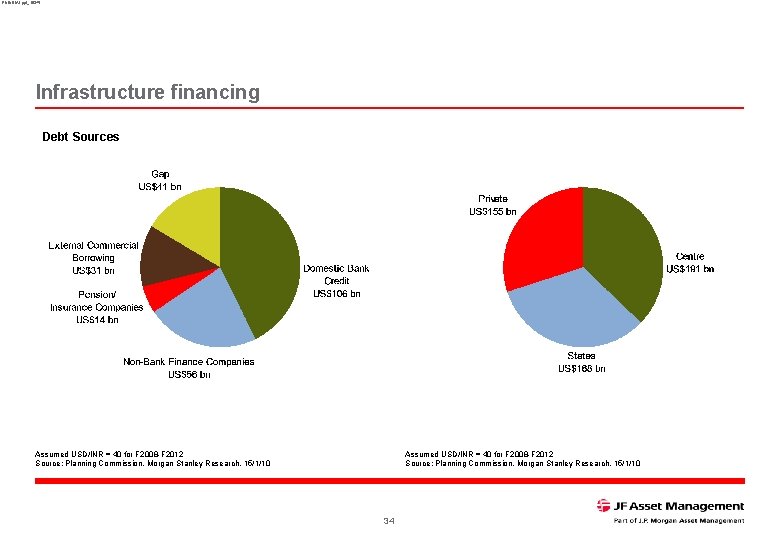
RNINDIA 1. ppt_16345 Infrastructure financing Debt Sources Assumed USD/INR = 40 for F 2008 -F 2012 Source: Planning Commission, Morgan Stanley Research, 15/1/10 34
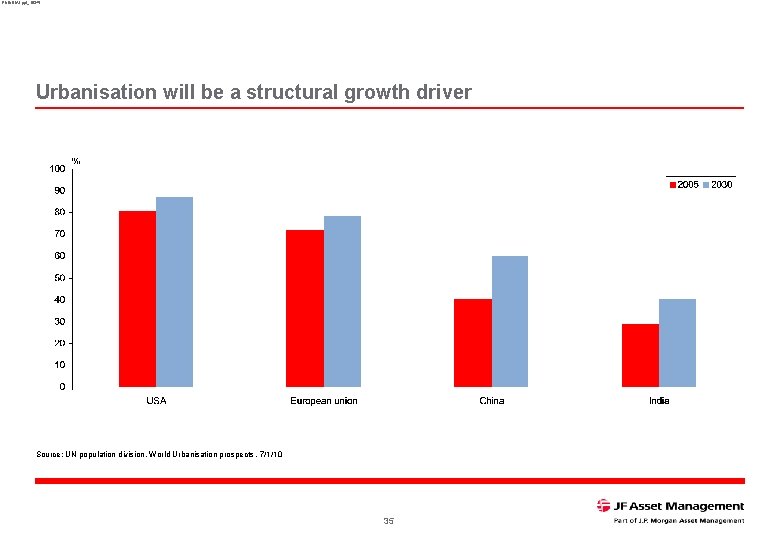
RNINDIA 1. ppt_16345 Urbanisation will be a structural growth driver Source: UN population division, World Urbanisation prospects , 7/1/10 35
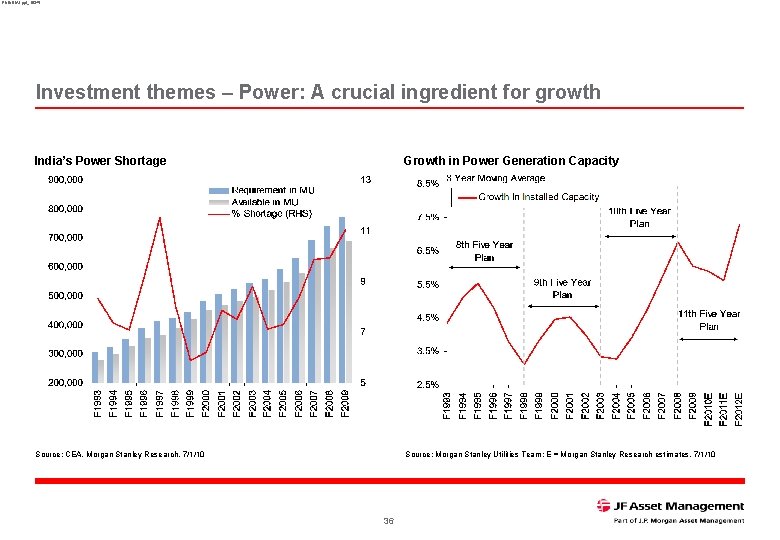
RNINDIA 1. ppt_16345 Investment themes – Power: A crucial ingredient for growth India’s Power Shortage Growth in Power Generation Capacity Source: CEA, Morgan Stanley Research, 7/1/10 Source: Morgan Stanley Utilities Team; E = Morgan Stanley Research estimates, 7/1/10 36
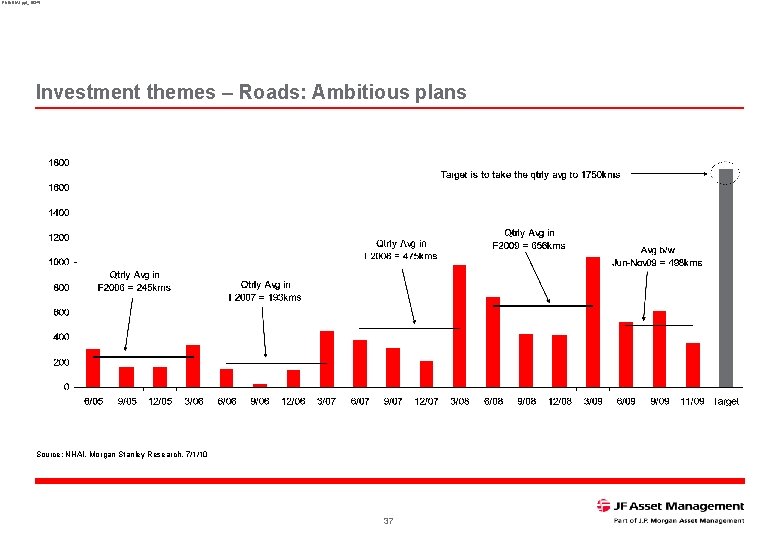
RNINDIA 1. ppt_16345 Investment themes – Roads: Ambitious plans Source: NHAI, Morgan Stanley Research, 7/1/10 37
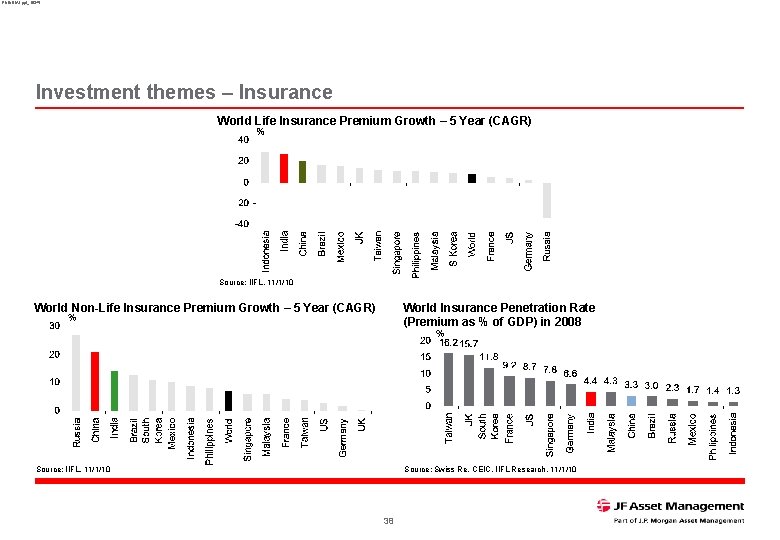
RNINDIA 1. ppt_16345 Investment themes – Insurance World Life Insurance Premium Growth – 5 Year (CAGR) Source: IIFL, 11/1/10 World Non-Life Insurance Premium Growth – 5 Year (CAGR) World Insurance Penetration Rate (Premium as % of GDP) in 2008 Source: IIFL, 11/1/10 Source: Swiss Re, CEIC, IIFL Research, 11/1/10 38
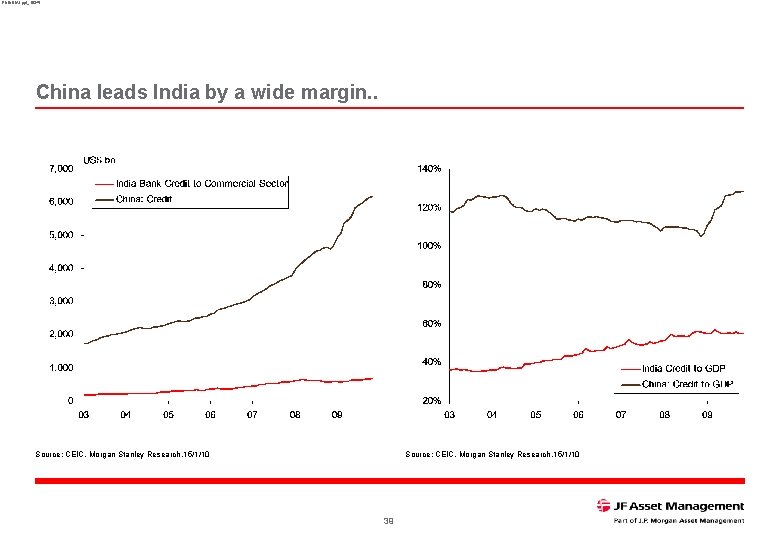
RNINDIA 1. ppt_16345 China leads India by a wide margin. . Source: CEIC, Morgan Stanley Research, 15/1/10 39
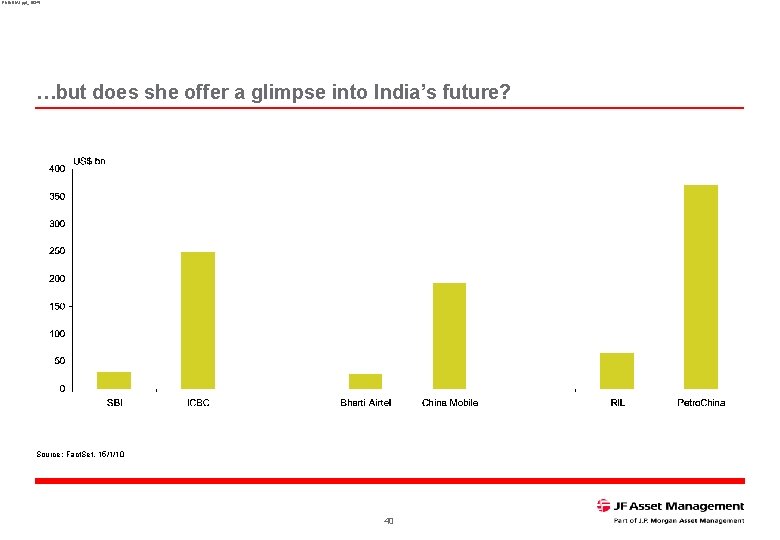
RNINDIA 1. ppt_16345 …but does she offer a glimpse into India’s future? Source: Fact. Set, 15/1/10 40
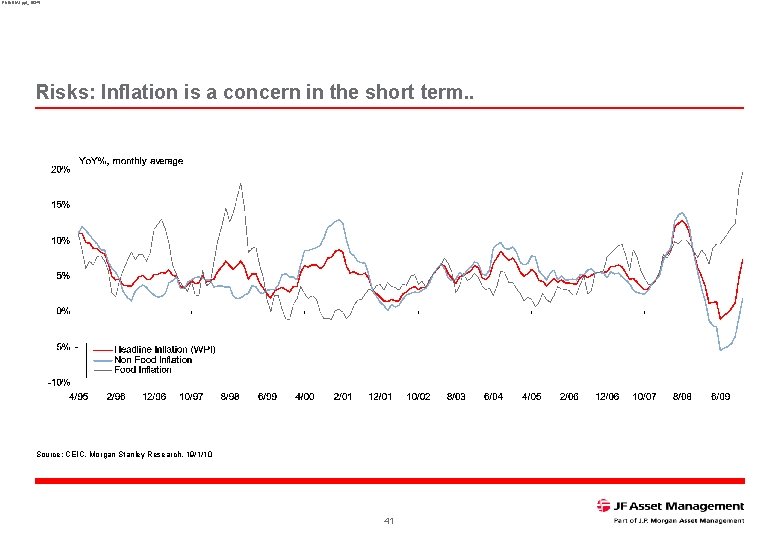
RNINDIA 1. ppt_16345 Risks: Inflation is a concern in the short term. . Source: CEIC, Morgan Stanley Research, 19/1/10 41
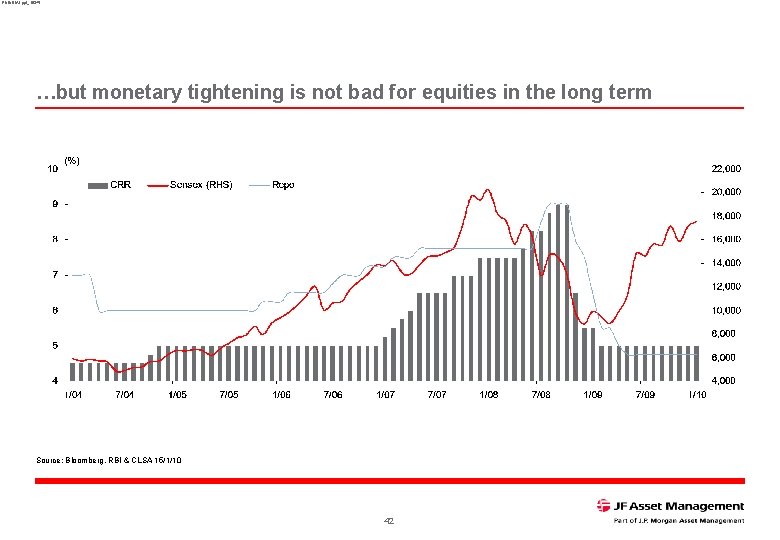
RNINDIA 1. ppt_16345 …but monetary tightening is not bad for equities in the long term Source: Bloomberg, RBI & CLSA 15/1/10 42
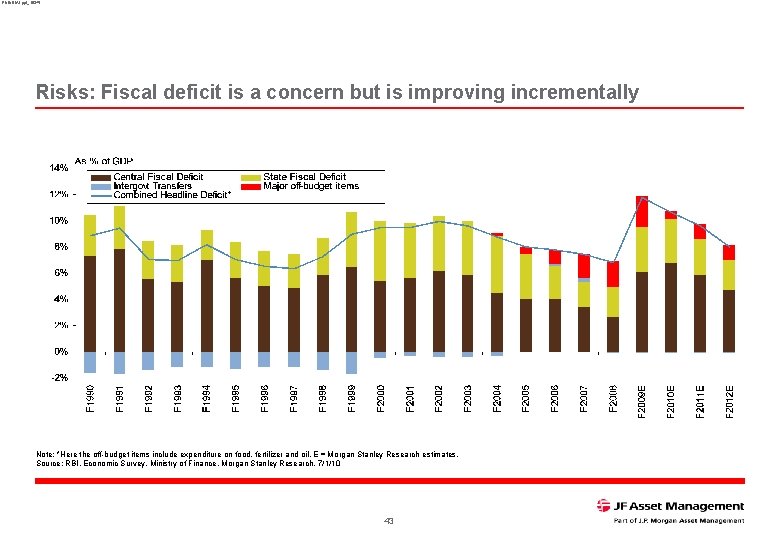
RNINDIA 1. ppt_16345 Risks: Fiscal deficit is a concern but is improving incrementally Note: *Here the off-budget items include expenditure on food, fertilizer and oil. E = Morgan Stanley Research estimates. Source: RBI, Economic Survey, Ministry of Finance, Morgan Stanley Research, 7/1/10 43
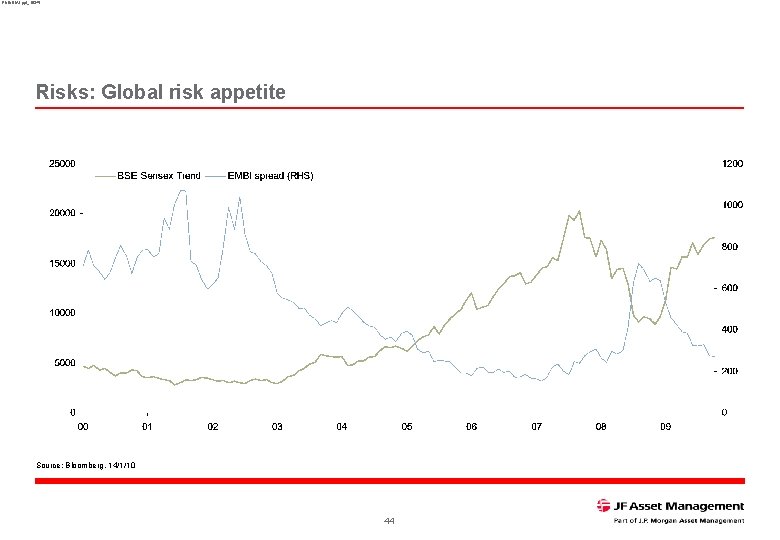
RNINDIA 1. ppt_16345 Risks: Global risk appetite Source: Bloomberg, 14/1/10 44
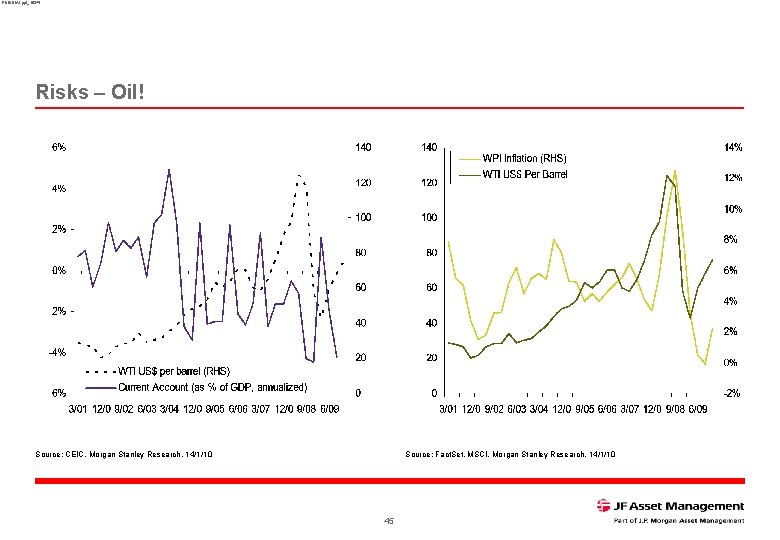
RNINDIA 1. ppt_16345 Risks – Oil! Source: CEIC, Morgan Stanley Research, 14/1/10 Source: Fact. Set, MSCI, Morgan Stanley Research, 14/1/10 45
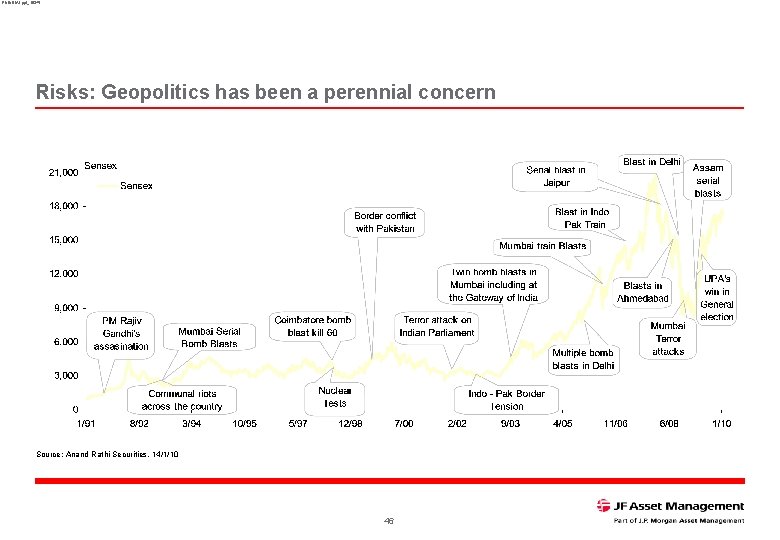
RNINDIA 1. ppt_16345 Risks: Geopolitics has been a perennial concern Source: Anand Rathi Securities, 14/1/10 46
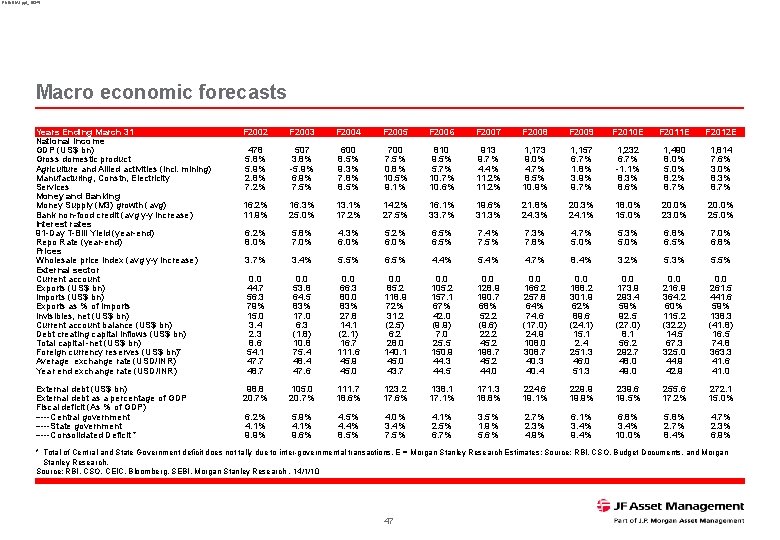
RNINDIA 1. ppt_16345 Macro economic forecasts Years Ending March 31 National Income GDP (US$ bn) Gross domestic product Agriculture and Allied activities (incl. mining) Manufacturing, Constn, Electricity Services Money and Banking Money Supply (M 3) growth (avg) Bank non-food credit (avg y-y increase) Interest rates 91 -Day T-Bill Yield (year-end) Repo Rate (year-end) Prices Wholesale price index (avg y-y increase) External sector Current account Exports (US$ bn) Imports (US$ bn) Exports as % of Imports Invisibles, net (US$ bn) Current account balance (US$ bn) Debt creating capital inflows (US$ bn) Total capital -net (US$ bn) Foreign currency reserves (US$ bn)* Average exchange rate (USD/INR) Year end exchange rate (USD/INR) F 2002 F 2003 F 2004 F 2005 F 2006 F 2007 F 2008 F 2009 F 2010 E F 2011 E F 2012 E 478 5. 8% 5. 9% 2. 8% 7. 2% 507 3. 8% -5. 9% 6. 9% 7. 5% 600 8. 5% 9. 3% 7. 8% 8. 5% 700 7. 5% 0. 8% 10. 5% 9. 1% 810 9. 5% 5. 7% 10. 6% 913 9. 7% 4. 4% 11. 2% 1, 173 9. 0% 4. 7% 8. 5% 10. 9% 1, 157 6. 7% 1. 8% 3. 9% 9. 7% 1, 232 6. 7% -1. 1% 8. 3% 8. 6% 1, 490 8. 0% 5. 0% 8. 2% 8. 7% 1, 814 7. 6% 3. 0% 8. 3% 8. 7% 16. 2% 11. 9% 16. 3% 25. 0% 13. 1% 17. 2% 14. 2% 27. 5% 16. 1% 33. 7% 19. 6% 31. 3% 21. 8% 24. 3% 20. 3% 24. 1% 18. 0% 15. 0% 20. 0% 23. 0% 20. 0% 25. 0% 6. 2% 8. 0% 5. 8% 7. 0% 4. 3% 6. 0% 5. 2% 6. 0% 6. 5% 7. 4% 7. 5% 7. 3% 7. 8% 4. 7% 5. 0% 5. 3% 5. 0% 6. 8% 6. 5% 7. 0% 6. 8% 3. 7% 3. 4% 5. 5% 6. 5% 4. 4% 5. 4% 4. 7% 8. 4% 3. 2% 5. 3% 5. 5% 0. 0 44. 7 56. 3 79% 15. 0 3. 4 2. 3 8. 6 54. 1 47. 7 48. 7 0. 0 53. 8 64. 5 83% 17. 0 6. 3 (1. 8) 10. 8 75. 4 48. 4 47. 6 0. 0 66. 3 80. 0 83% 27. 8 14. 1 (2. 1) 16. 7 111. 6 45. 9 45. 0 0. 0 85. 2 118. 9 72% 31. 2 (2. 5) 6. 2 28. 0 140. 1 45. 0 43. 7 0. 0 105. 2 157. 1 67% 42. 0 (9. 9) 7. 0 25. 5 150. 9 44. 3 44. 5 0. 0 128. 9 190. 7 68% 52. 2 (9. 6) 22. 2 45. 2 198. 7 45. 2 44. 0 0. 0 166. 2 257. 8 64% 74. 6 (17. 0) 24. 9 108. 0 308. 7 40. 3 40. 4 0. 0 188. 2 301. 9 62% 89. 6 (24. 1) 15. 1 2. 4 251. 3 46. 0 51. 3 0. 0 173. 9 293. 4 59% 92. 5 (27. 0) 8. 1 56. 2 292. 7 48. 0 49. 0 0. 0 216. 9 364. 2 60% 115. 2 (32. 2) 14. 5 67. 3 325. 0 44. 9 42. 9 0. 0 261. 5 441. 6 59% 138. 3 (41. 8) 16. 5 74. 8 363. 3 41. 6 41. 0 External debt (US$ bn) External debt as a percentage of GDP Fiscal deficit (As % of GDP) -----Central government -----State government -----Consolidated Deficit * 98. 8 20. 7% 105. 0 20. 7% 111. 7 18. 6% 123. 2 17. 6% 138. 1 17. 1% 171. 3 18. 8% 224. 6 19. 1% 229. 9 19. 9% 239. 6 19. 5% 255. 6 17. 2% 272. 1 15. 0% 6. 2% 4. 1% 9. 9% 5. 9% 4. 1% 9. 6% 4. 5% 4. 4% 8. 5% 4. 0% 3. 4% 7. 5% 4. 1% 2. 5% 6. 7% 3. 5% 1. 9% 5. 6% 2. 7% 2. 3% 4. 9% 6. 1% 3. 4% 9. 4% 6. 8% 3. 4% 10. 0% 5. 8% 2. 7% 8. 4% 4. 7% 2. 3% 6. 9% * Total of Central and State Government deficit does not tally due to inter-governmental transactions. E = Morgan Stanley Research Estimates; Source: RBI, CSO, Budget Documents, and Morgan Stanley Research. Source: RBI, CSO, CEIC, Bloomberg, SEBI, Morgan Stanley Research , 14/1/10 47
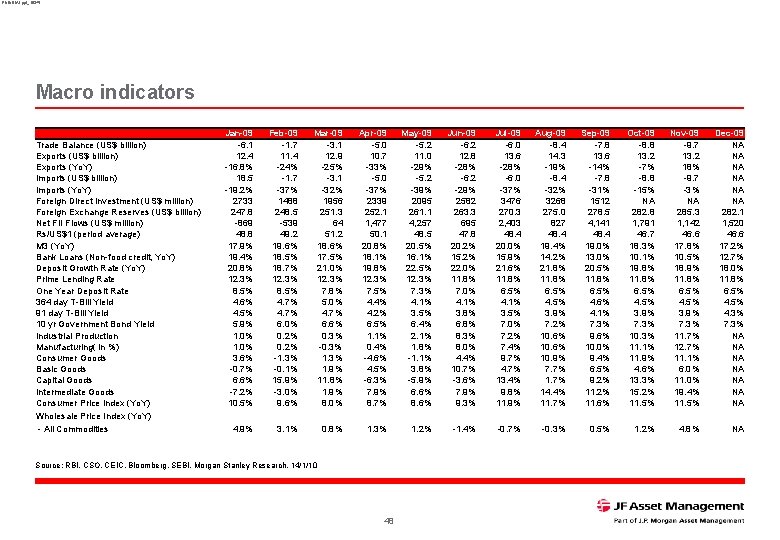
RNINDIA 1. ppt_16345 Macro indicators Trade Balance (US$ billion) Exports (Yo. Y) Imports (US$ billion) Imports (Yo. Y) Foreign Direct Investment (US$ million) Foreign Exchange Reserves (US$ billion) Net FII Flows (US$ million) Rs/US$1 (period average) M 3 (Yo. Y) Bank Loans (Non-food credit, Yo. Y) Deposit Growth Rate (Yo. Y) Prime Lending Rate One Year Deposit Rate 364 day T-Bill Yield 91 day T-Bill Yield 10 yr Government Bond Yield Industrial Production Manufacturing( in %) Consumer Goods Basic Goods Capital Goods Intermediate Goods Consumer Price Index (Yo. Y) Wholesale Price Index (Yo. Y) - All Commodities Jan-09 -6. 1 12. 4 -16. 8% 18. 5 -19. 2% 2733 247. 8 -869 48. 8 17. 9% 19. 4% 20. 8% 12. 3% 8. 5% 4. 6% 4. 5% 5. 9% 1. 0% 3. 6% -0. 7% 6. 6% -7. 2% 10. 5% Feb-09 -1. 7 11. 4 -24% -1. 7 -37% 1488 248. 5 -539 49. 2 19. 6% 18. 5% 18. 7% 12. 3% 8. 5% 4. 7% 6. 0% 0. 2% -1. 3% -0. 1% 15. 9% -3. 0% 9. 6% Mar-09 -3. 1 12. 9 -25% -3. 1 -32% 1956 251. 3 64 51. 2 18. 6% 17. 5% 21. 0% 12. 3% 7. 8% 5. 0% 4. 7% 6. 6% 0. 3% -0. 3% 1. 9% 11. 8% 1. 9% 8. 0% Apr-09 -5. 0 10. 7 -33% -5. 0 -37% 2339 252. 1 1, 477 50. 1 20. 8% 18. 1% 19. 8% 12. 3% 7. 5% 4. 4% 4. 2% 6. 5% 1. 1% 0. 4% -4. 6% 4. 5% -6. 3% 7. 9% 8. 7% May-09 -5. 2 11. 0 -29% -5. 2 -39% 2095 261. 1 4, 257 48. 5 20. 5% 16. 1% 22. 5% 12. 3% 7. 3% 4. 1% 3. 5% 6. 4% 2. 1% 1. 8% -1. 1% 3. 8% -5. 9% 6. 6% 8. 6% Jun-09 -6. 2 12. 8 -28% -6. 2 -29% 2582 263. 3 695 47. 8 20. 2% 15. 2% 22. 0% 11. 8% 7. 0% 4. 1% 3. 8% 6. 8% 8. 3% 8. 0% 4. 4% 10. 7% -3. 6% 7. 9% 9. 3% Jul-09 -6. 0 13. 6 -28% -6. 0 -37% 3476 270. 3 2, 403 48. 4 20. 0% 15. 9% 21. 6% 11. 8% 6. 5% 4. 1% 3. 5% 7. 0% 7. 2% 7. 4% 9. 7% 4. 7% 13. 4% 9. 8% 11. 9% Aug-09 -8. 4 14. 3 -19% -8. 4 -32% 3268 275. 0 827 48. 4 19. 4% 14. 2% 21. 8% 11. 8% 6. 5% 4. 5% 3. 9% 7. 2% 10. 6% 10. 9% 7. 7% 14. 4% 11. 7% Sep-09 -7. 8 13. 6 -14% -7. 8 -31% 1512 278. 5 4, 141 48. 4 19. 0% 13. 0% 20. 5% 11. 8% 6. 5% 4. 6% 4. 1% 7. 3% 9. 6% 10. 0% 9. 4% 6. 5% 9. 2% 11. 6% Oct-09 -8. 8 13. 2 -7% -8. 8 -15% NA 282. 8 1, 791 46. 7 18. 3% 10. 1% 19. 8% 11. 8% 6. 5% 4. 5% 3. 9% 7. 3% 10. 3% 11. 1% 11. 9% 4. 6% 13. 3% 15. 2% 11. 5% Nov-09 -9. 7 13. 2 18% -9. 7 -3% NA 285. 3 1, 142 46. 6 17. 8% 10. 5% 18. 9% 11. 8% 6. 5% 4. 5% 3. 9% 7. 3% 11. 7% 12. 7% 11. 1% 6. 0% 11. 0% 19. 4% 11. 5% Dec-09 NA NA NA 282. 1 1, 520 46. 6 17. 2% 12. 7% 18. 0% 11. 8% 6. 5% 4. 3% 7. 3% NA NA 4. 9% 3. 1% 0. 8% 1. 3% 1. 2% -1. 4% -0. 7% -0. 3% 0. 5% 1. 2% 4. 8% NA Source: RBI, CSO, CEIC, Bloomberg, SEBI, Morgan Stanley Research, 14/1/10 48

RNINDIA 1. ppt_16345 J. P. Morgan Asset Management THIS DOCUMENT IS FOR PROFESSIONAL ADVISERS ONLY- NOT FOR ONWARD DISTRIBUTION Any forecasts or opinions expressed are J. P. Morgan’s own at the date of this document and may be subject to change. The value of investments and the income from them may fluctuate and your investment is not guaranteed and investors may not get back the full amount invested. Past performance is not a guide to future performance. Exchange rates may cause the value of underlying overseas investments to go down or up. Investments in smaller companies may involve a higher degree of risk as they are usually more sensitive to market movements. Investments in emerging markets may be more volatile than other markets and the risk to your capital is therefore greater. Also, the economic and political situations may be more volatile than in established economies and these may adversely influence the value of investments made. Telephone lines are recorded and may be monitored for security and training purposes. Issued in the UK by JPMorgan Asset Management Marketing Limited which is authorised and regulated by the Financial Services Authority. Registered in England No. 288553. Registered Office: 125 London Wall, London EC 2 Y 5 AJ 49
- Slides: 50