
FOOD WEBS TROPHIC LEVELS ECOLOGICAL PYRAMIDS http www
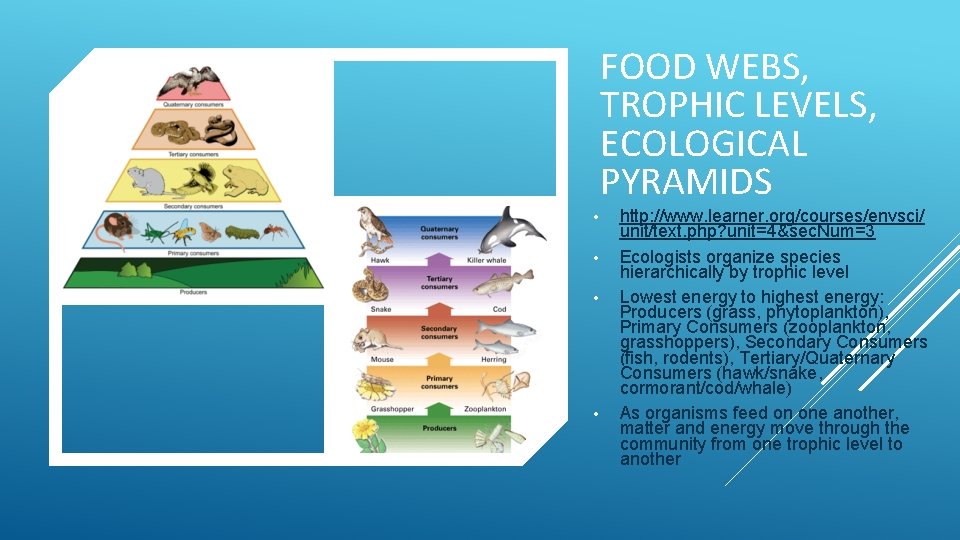
FOOD WEBS, TROPHIC LEVELS, ECOLOGICAL PYRAMIDS • • http: //www. learner. org/courses/envsci/ unit/text. php? unit=4&sec. Num=3 Ecologists organize species hierarchically by trophic level Lowest energy to highest energy: Producers (grass, phytoplankton), Primary Consumers (zooplankton, grasshoppers), Secondary Consumers (fish, rodents), Tertiary/Quaternary Consumers (hawk/snake, cormorant/cod/whale) As organisms feed on one another, matter and energy move through the community from one trophic level to another
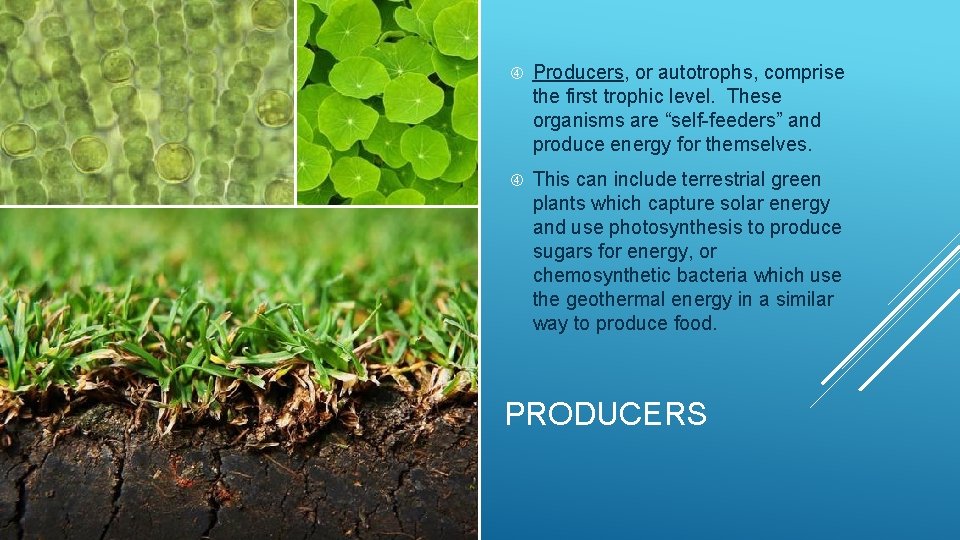
Producers, or autotrophs, comprise the first trophic level. These organisms are “self-feeders” and produce energy for themselves. This can include terrestrial green plants which capture solar energy and use photosynthesis to produce sugars for energy, or chemosynthetic bacteria which use the geothermal energy in a similar way to produce food. PRODUCERS
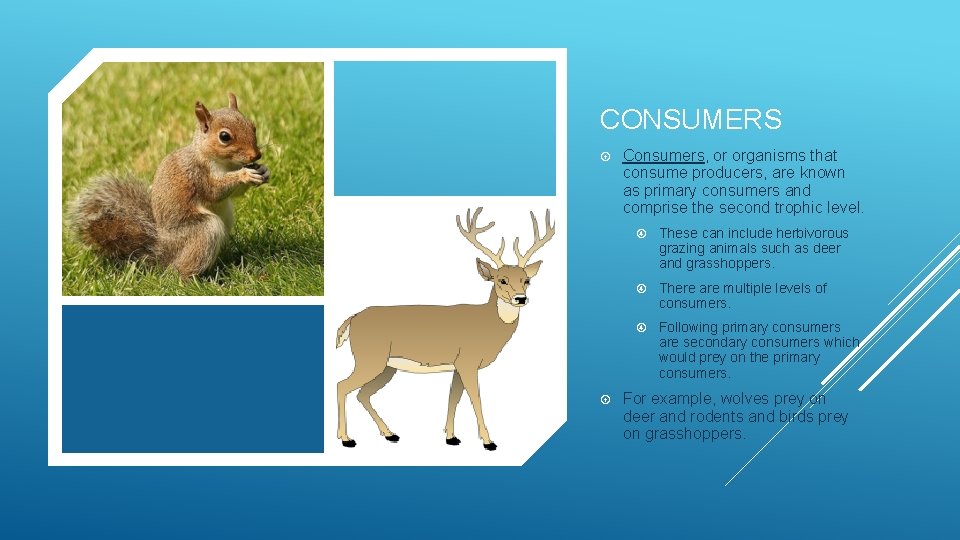
CONSUMERS Consumers, or organisms that consume producers, are known as primary consumers and comprise the second trophic level. These can include herbivorous grazing animals such as deer and grasshoppers. There are multiple levels of consumers. Following primary consumers are secondary consumers which would prey on the primary consumers. For example, wolves prey on deer and rodents and birds prey on grasshoppers.

The next level would be tertiary consumers. Following in the same example, a hawk or owl would eat the rodent which had eaten the grasshopper. Of note is that primary consumers are herbivores but secondary, tertiary (and possibly higher) consumers are carnivores (or omnivores). TERTIARY CONSUMERS
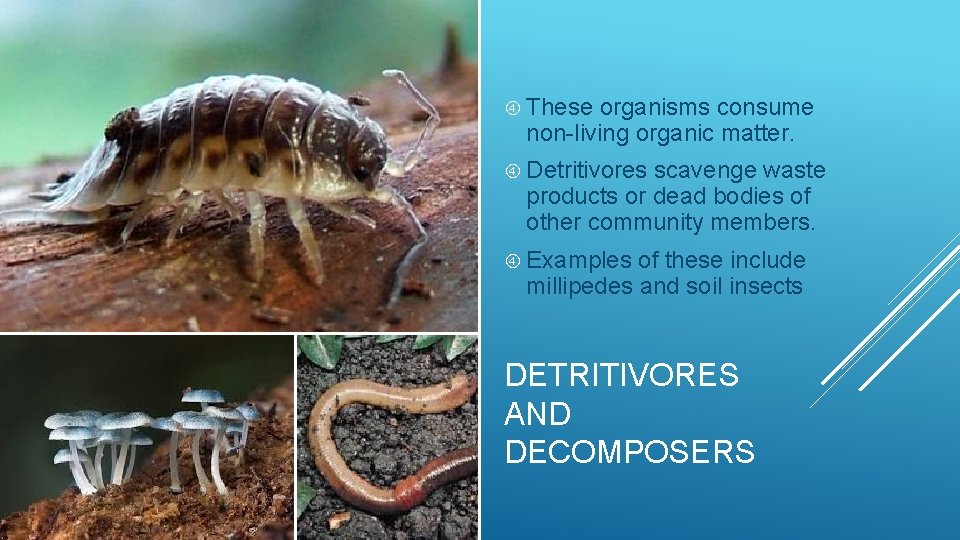
These organisms consume non-living organic matter. Detritivores scavenge waste products or dead bodies of other community members. Examples of these include millipedes and soil insects DETRITIVORES AND DECOMPOSERS
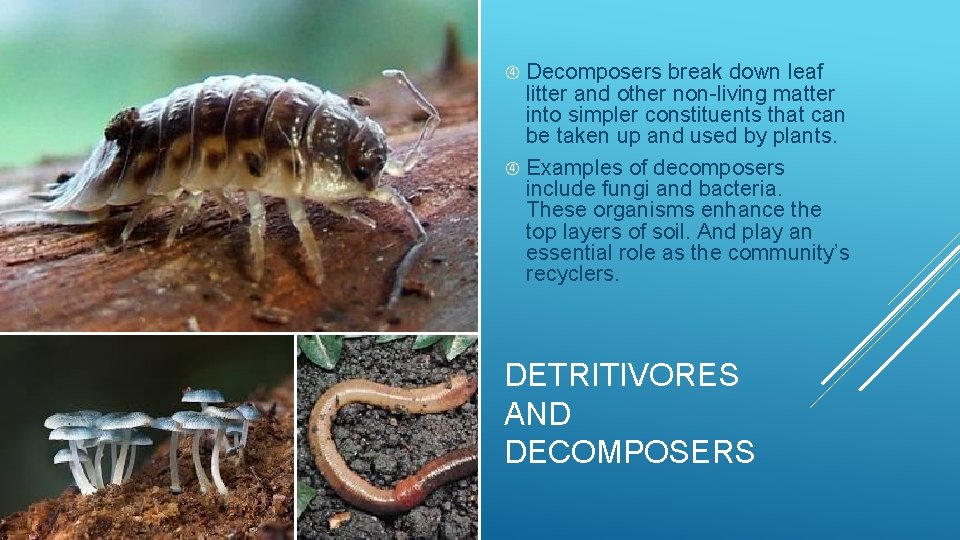
Decomposers break down leaf litter and other non-living matter into simpler constituents that can be taken up and used by plants. Examples of decomposers include fungi and bacteria. These organisms enhance the top layers of soil. And play an essential role as the community’s recyclers. DETRITIVORES AND DECOMPOSERS
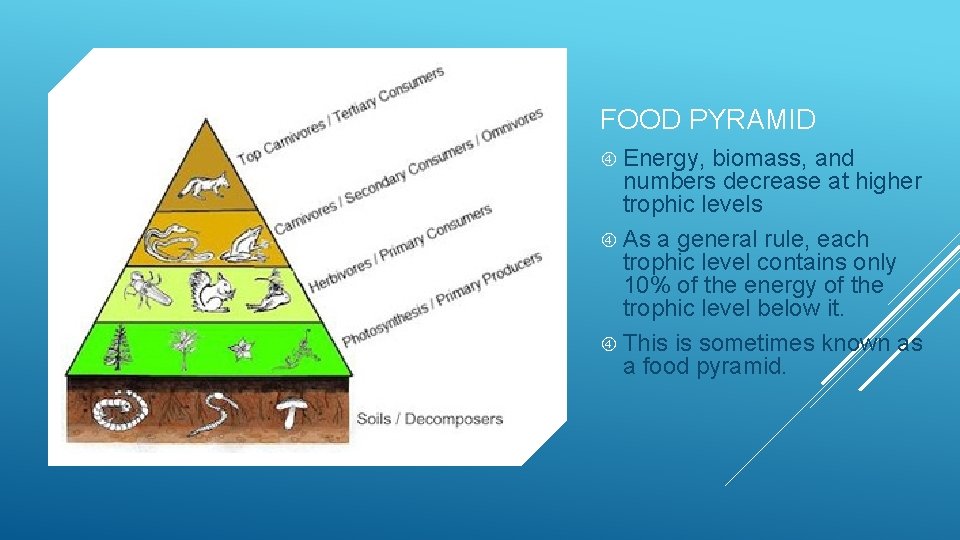
FOOD PYRAMID Energy, biomass, and numbers decrease at higher trophic levels As a general rule, each trophic level contains only 10% of the energy of the trophic level below it. This is sometimes known as a food pyramid.
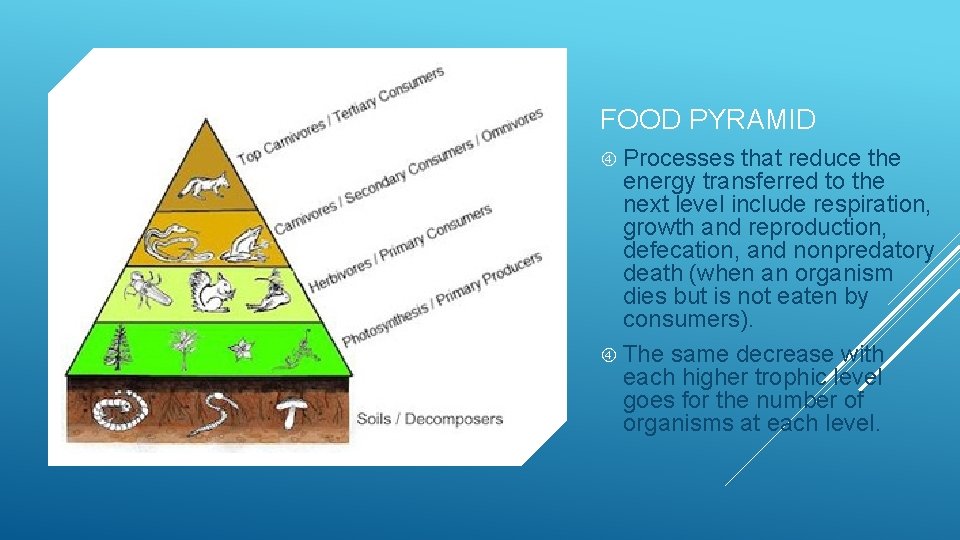
FOOD PYRAMID Processes that reduce the energy transferred to the next level include respiration, growth and reproduction, defecation, and nonpredatory death (when an organism dies but is not eaten by consumers). The same decrease with each higher trophic level goes for the number of organisms at each level.
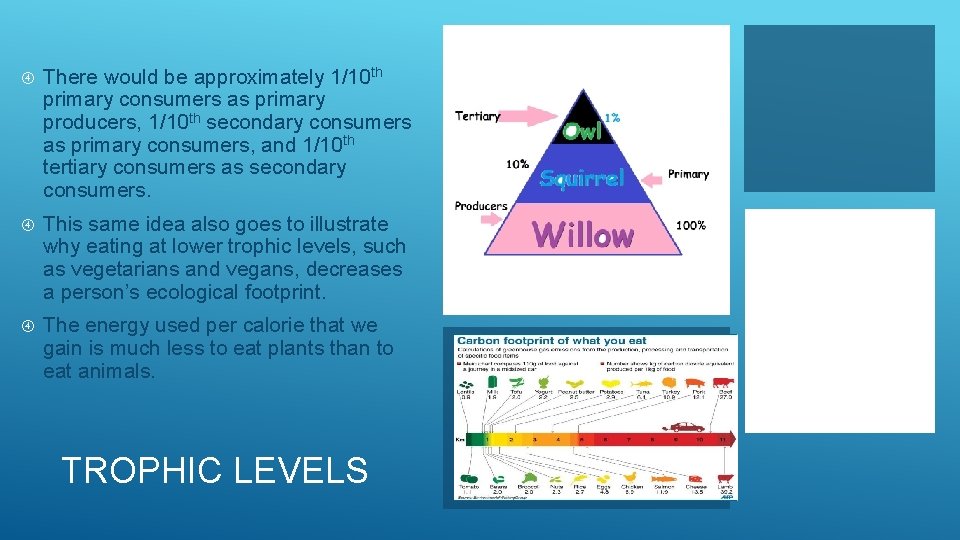
There would be approximately 1/10 th primary consumers as primary producers, 1/10 th secondary consumers as primary consumers, and 1/10 th tertiary consumers as secondary consumers. This same idea also goes to illustrate why eating at lower trophic levels, such as vegetarians and vegans, decreases a person’s ecological footprint. The energy used per calorie that we gain is much less to eat plants than to eat animals. TROPHIC LEVELS
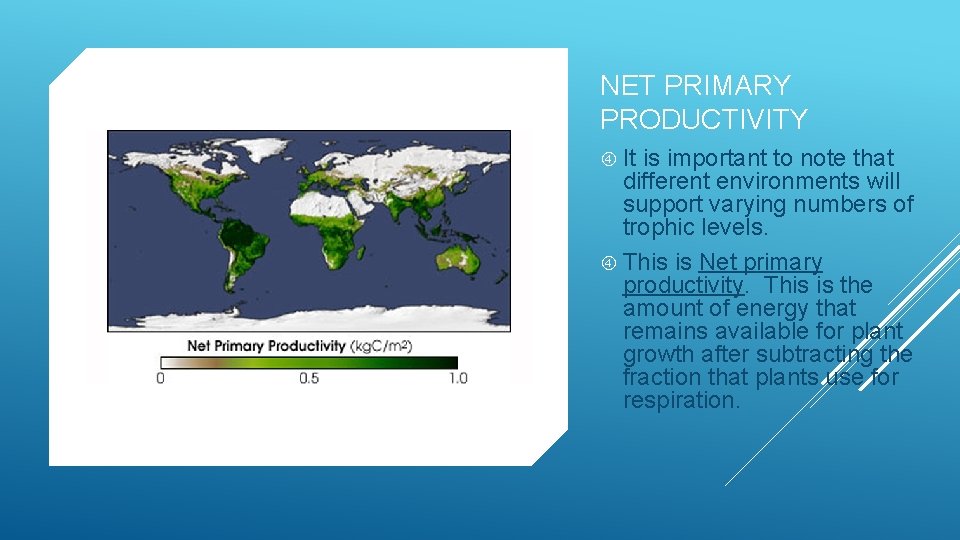
NET PRIMARY PRODUCTIVITY It is important to note that different environments will support varying numbers of trophic levels. This is Net primary productivity. This is the amount of energy that remains available for plant growth after subtracting the fraction that plants use for respiration.
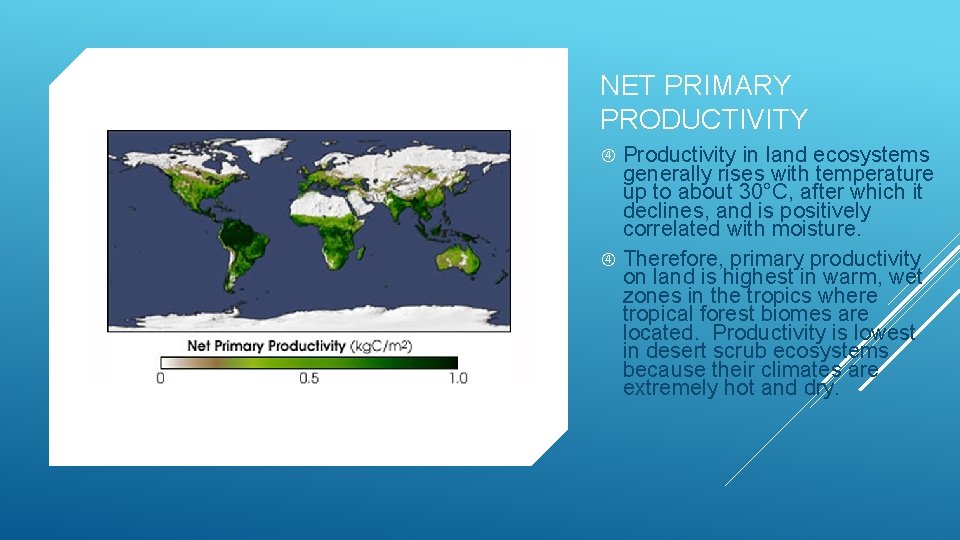
NET PRIMARY PRODUCTIVITY Productivity in land ecosystems generally rises with temperature up to about 30°C, after which it declines, and is positively correlated with moisture. Therefore, primary productivity on land is highest in warm, wet zones in the tropics where tropical forest biomes are located. Productivity is lowest in desert scrub ecosystems because their climates are extremely hot and dry.
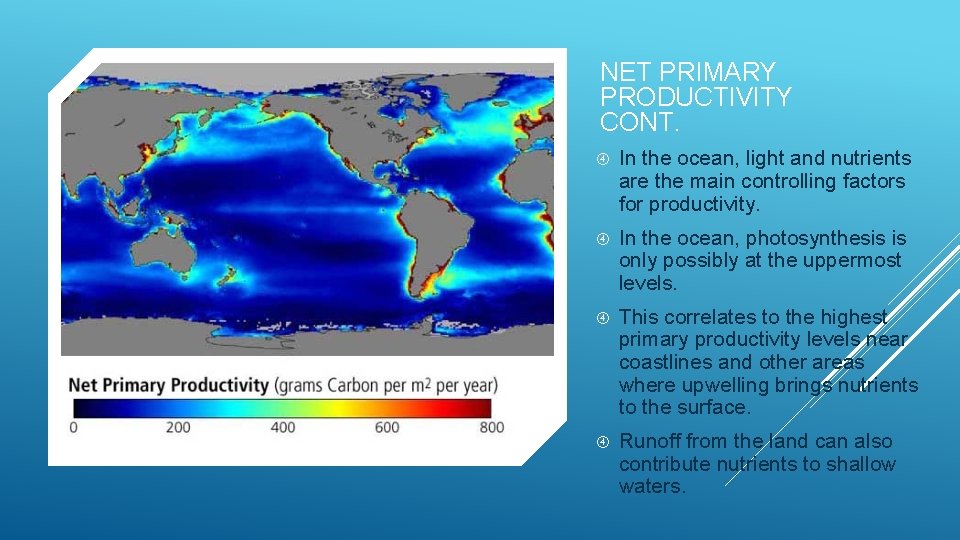
NET PRIMARY PRODUCTIVITY CONT. In the ocean, light and nutrients are the main controlling factors for productivity. In the ocean, photosynthesis is only possibly at the uppermost levels. This correlates to the highest primary productivity levels near coastlines and other areas where upwelling brings nutrients to the surface. Runoff from the land can also contribute nutrients to shallow waters.
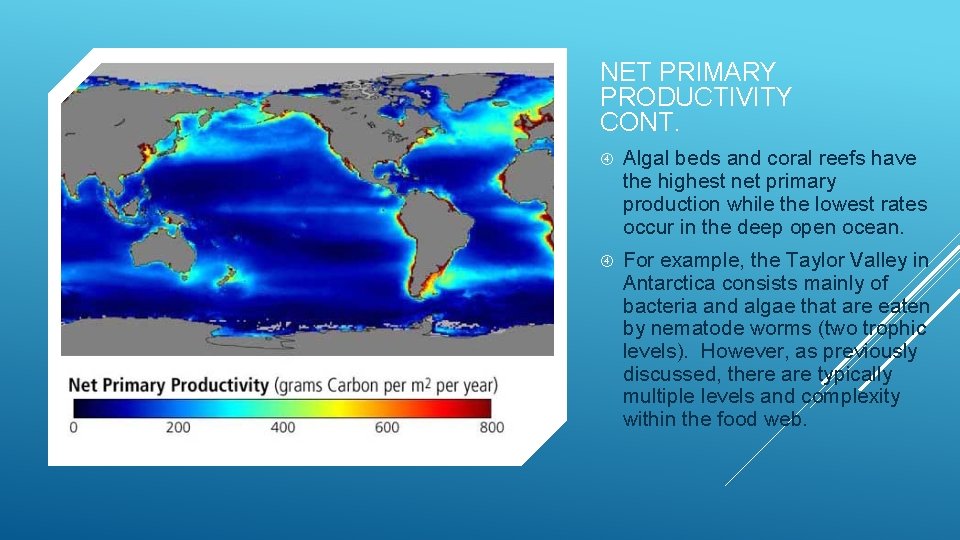
NET PRIMARY PRODUCTIVITY CONT. Algal beds and coral reefs have the highest net primary production while the lowest rates occur in the deep open ocean. For example, the Taylor Valley in Antarctica consists mainly of bacteria and algae that are eaten by nematode worms (two trophic levels). However, as previously discussed, there are typically multiple levels and complexity within the food web.
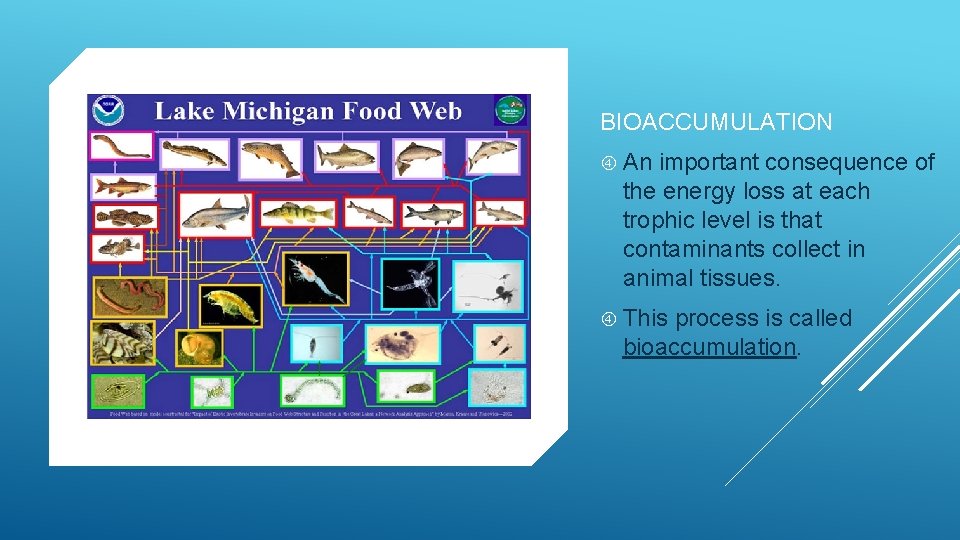
BIOACCUMULATION An important consequence of the energy loss at each trophic level is that contaminants collect in animal tissues. This process is called bioaccumulation.
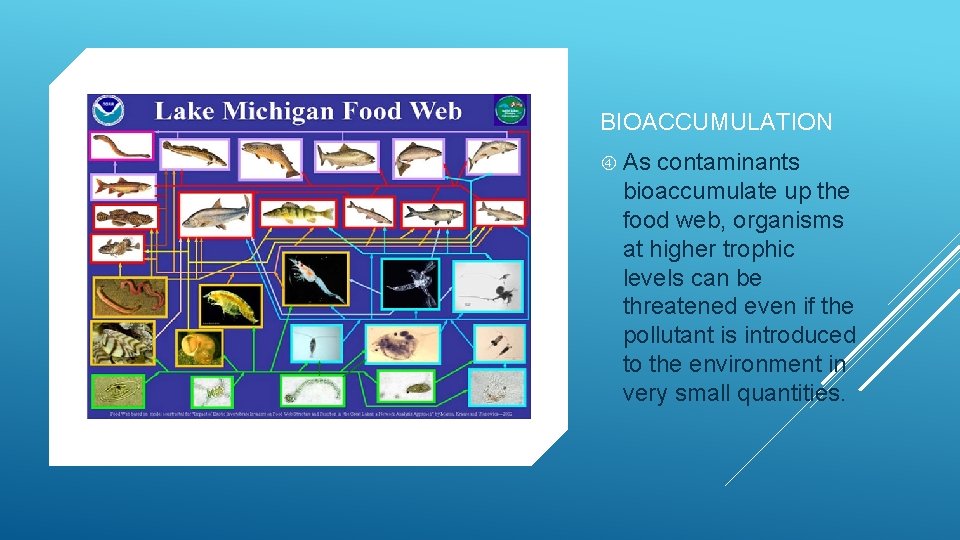
BIOACCUMULATION As contaminants bioaccumulate up the food web, organisms at higher trophic levels can be threatened even if the pollutant is introduced to the environment in very small quantities.
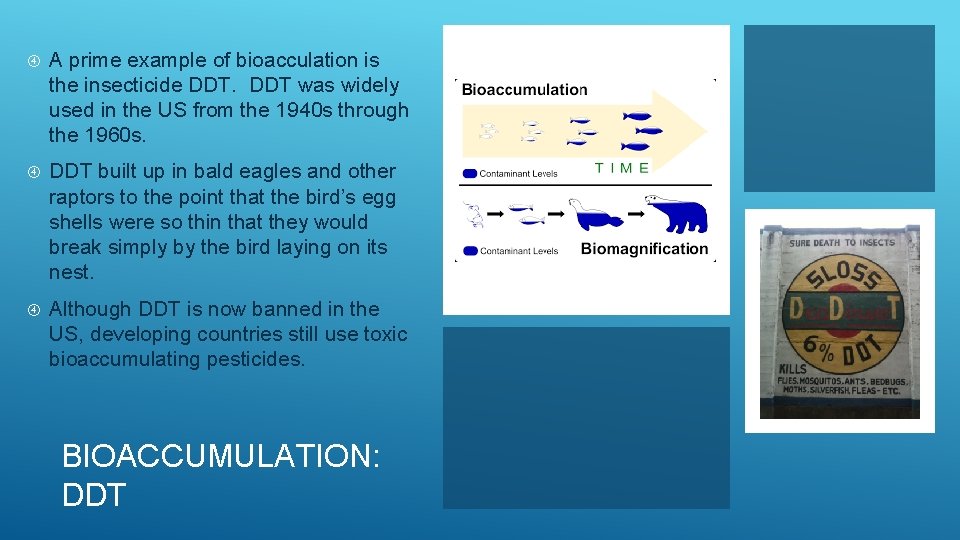
A prime example of bioacculation is the insecticide DDT was widely used in the US from the 1940 s through the 1960 s. DDT built up in bald eagles and other raptors to the point that the bird’s egg shells were so thin that they would break simply by the bird laying on its nest. Although DDT is now banned in the US, developing countries still use toxic bioaccumulating pesticides. BIOACCUMULATION: DDT
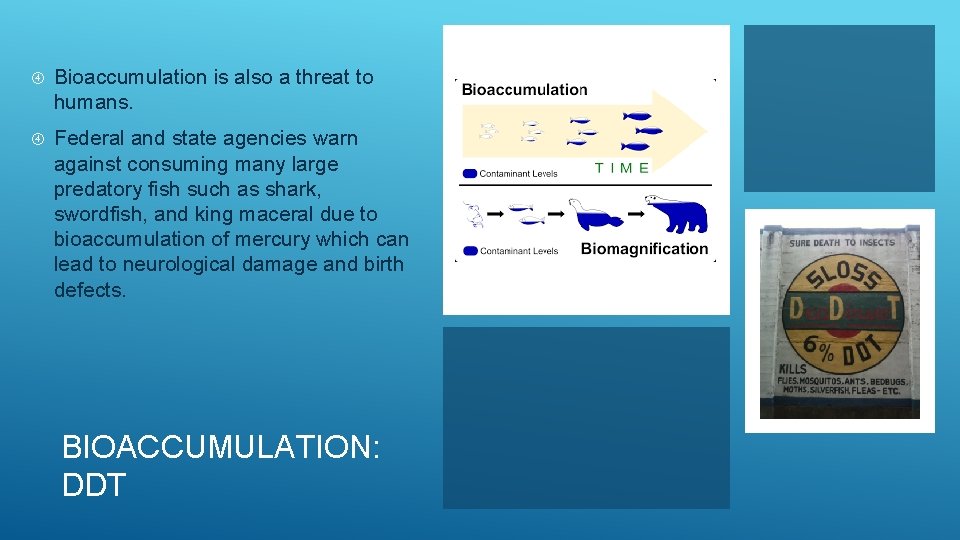
Bioaccumulation is also a threat to humans. Federal and state agencies warn against consuming many large predatory fish such as shark, swordfish, and king maceral due to bioaccumulation of mercury which can lead to neurological damage and birth defects. BIOACCUMULATION: DDT
- Slides: 17