Food Microbiology Spring 2018 LECTURE Microbial Growth Kinetics

Food Microbiology Spring 2018 LECTURE Microbial Growth -Kinetics First Order

Optical Density Log CFU/ml Growth Curve Lag

First Order Kinetics Food microbiology is concerned with all phases Of microbial growth (lag, log, stationary, death phase). Growth curves are normally plotted as the number of cells on a log scale or log 10 cell number versus time.

Growth of bacterial population

One generation

Growth Terminology and the concept of exponential growth • The interval for the formation of two cells from one is called a generation • The time required for this to occur is called the generation time. • Generation time is the time required for the cell population to double (the cell mass doubles during this period as well). • Because of this, the generation time is also called the doubling time.

• In nature, microbial doubling times may be much longer than those obtained in laboratory culture. • This is because in nature, ideal growth conditions for a given organism may exist only intermittently. • Depending on resource availability, physiochemical conditions (temperature, p. H, and the like), moisture availability, and seasonal changes, bacterial populations in nature double only once every few weeks, or even longer.

A mathematical relationship exists between the number of cells present in a culture initially and the number present after a period of exponential growth: N = N 02 n where N is the final cell number, No is the initial cell number, n is the number of generations that have occurred during the period of exponential growth.

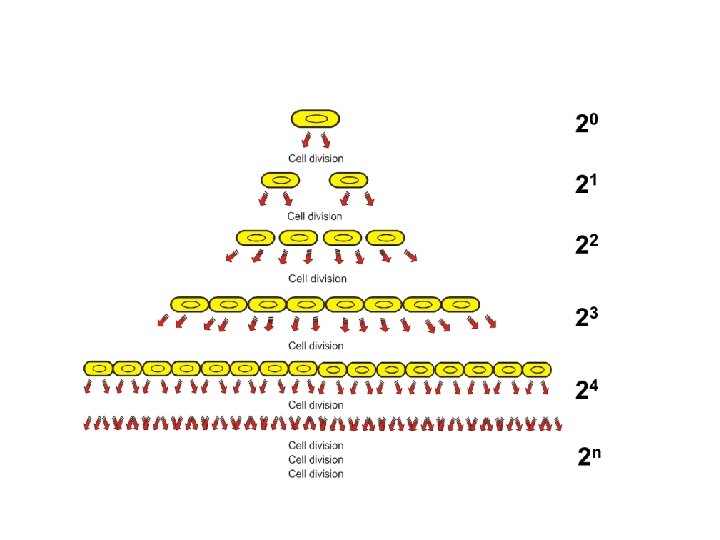
The Mathematics of Exponential Growth • As one cell divides to become two cells, 2° --'> 21. • As two cells become four, 21 --'> 22, and so on
 of the exponentially growing population is (t / n), where")
The generation time (g) of the exponentially growing population is (t / n), where t is the duration of exponential growth expressed in days, hours, or minutes, depending on the organism and the growth conditions. From a knowledge of the initial and final cell numbers in an exponentially growing cell population, it is possible to calculate n, and from n and knowledge of t, the generation time g.

Relation equation of N and No to n The equation N = No 2 n can be expressed in terms of n as follows: N = N o 2 n log N = log No + n log 2 log N – log No = n log 2 n = log N – log No log 2 0. 301 = 3. 3 (log N – log No)

example N = 108, No = 5 X 10⁷, and t = 2 n = 3. 3 (log N – log No) n = 3. 3 [log(108) - log(5 X 10⁷)] = 3. 3(8 - 7. 69) = 3. 3(0. 301) =1 generation time, g = t/n = 2 / 1 = 2 h

Related growth parameter • The generation time g of an exponentially growing culture can also be calculated from the slope of the line obtained in the semilogarithmic plot of exponential growth. • The slope is equal to 0. 301 n/t (log 2 n/t) and in the above example would be 0. 301(1)/2, or 0. 15. • Since g is equal 0. 301/slope, we arrive at the same value of 2 for g. • The term 0. 301 nlt is called the specific growth rate, abbreviated k.

The Growth cycle or phases of microbial growth • observed when microorganisms are cultivated in batch culture – culture incubated in a closed vessel with a single batch of medium • usually plotted as logarithm of cell number versus time • usually has four distinct phases

Table First order kinetics to describe exponential growth and inactivation Growth 2 1 a. N=N 0 eµt Irradiation N=N 0 e-Dd/D 0 2 a. 2. 3 log(N/N 0)=µt 2 b. 2. 3 log(N/N 0)=-kt 3 a. ∆t=2. 3 log(N/N 0)/µ 3 b. ∆t=-2. 3 log(N/N 0)/k 4. a. g=0. 693/µ 4 b. D=2. 3/k N=Final cell number(CFU/ml) N 0=Initial cell number t=time (h) µ=Specific growth rate (h-1) g=Doubling time(generation time)(h) k=rate constant (h-1) D=Decimal reduction time(h) Ea=Activation energy(kcal/mol) T 1 and T 2, reference and test temperature(K) D 0=Rate constant (h-1) Dd=Dose(Gy)

The rate of growth is directly proportional to cell concentration or biomassi. e. dx/dt α dx/dt = μX X -----1 Where, X is the concentration of microbial biomass, t is time, in hours μ is the specific growth rate, in hours -1
 from t=0 to t=t , we have:")
• On integration of equation (1) from t=0 to t=t , we have: xt = xo e μt ----- 2 Where, • Xo is the original biomass concentration, • Xt is the biomass concentration after the time interval, t hours, • e is the base of the natural logarithm.
 we have : In Xt")
• On taking natural logarithms of equation (2) we have : In Xt = In Xo + μt (3)

• Therefore, a plot of the natural logarithm of biomass concentration against time should yield a straight line, the slope of which would equal to μ. • During the exponential phase nutrients are in excess and the organism is growing at its maximum specific growth rate, ‘μmax ‘ for the prevailing conditions.

• Typical values of μmax for a range of microorganisms are given below in the Table.
 absent")
Lag phase Three causes for lag: physiological lag low initial numbers appropriate gene(s) absent growth approx. = 0 (d. X/dt = 0)

Exponential phase Nutrients and conditions are not limiting growth = 2 n or X = 2 n X 0 Where X 0 = initial number of cells X = final number of cells n = number of generations 20 20 21 21 22 22 23 23 24 24 n 2 2 n

Example: An experiment was performed in a lab flask growing cells on 0. 1% salicylate and starting with 2. 2 x 10⁴ cells. As the experiment below shows, at the end there were 3. 8 x 10⁹ cells. This is an increase is 5 orders of magnitude!! How many doublings or generations occurred? X = 2 n X 0 3. 8 x 109 = 2 n(2. 2 x 10⁴) 1. 73 x 105 = 2 n log(1. 73 x 105) = nlog 2 17. 4 = n Cells grown on salicylate, 0. 1%

Calculating growth rate during exponential growth d. X/dt = u. X where u = specific growth rate (h-1) Rearrange: d. X/X = udt Integrate: ln. X = ut + C, where C = ln. X 0 d. X/dt = u. X where u = specific growth rate (h-1) ln. X = ut + ln X 0 or X = X 0 eut y = mx + b (equation for a straight line) Note that u, the growth rate, is the slope of this straight line

Calculating growth rate during exponential growth d. X/dt = u. X where u = specific growth rate (h-1) Rearrange: d. X/X = udt Integrate: ln. X = ut + C, where C = ln. X 0 ln. X = ut + ln X 0 or X = X 0 eut y = mx + b (equation for a straight line) Note that u, the growth rate, is the slope of this straight line

Find the slope of this growth curve ln. X = ut + ln X 0 or u = ln. X – ln. X 0 t – t 0 u = ln 5. 5 x 10⁸ – ln 1. 7 x 10⁵ 8. 2 - 4. 2 = 2 hr-1

Growth Kinetics •

Ex: Ground meat manufactured with N 0=1. 2*104 CFU/g. How long it be held at 7°C before reaching a level of 108 CFU/g (for µ=0. 025 h-1) N=N 0 eµt 108 =1. 2*104 e 0. 025 t t=361. 12 h

Death Kinetics. Killing can be by heat, radiation, acid, bacteriocin and other lethal agents is also governed by first order kinetics. D value=amount of time required to reduce N 0 by 90% is the most frequently used constant. The relationship between k and temperature is explained by arrhenius equation Ea/RT

Z value= a number of degrees required to change in the D values by a factor 10, or It is the temperature required for one log 10 reduction in the D-value.

z-value is used to determine the time values with different D-values at different temperatures with its equation shown below: where T is temperature in °F or °C. This D-value is affected by p. H of the product where low p. H has faster D values on various foods. The D-value at an unknown temperature can be calculated knowing the D-value at a given temperature provided the Z-value is known.

For example: If D vaue at 121 °C is 1. 5 min and z value is 10 °C. The D value at 131 °C will be 0. 15 min. Example: if it takes an increase of 10°F to move the curve one log, then our z-value is 10. Given a D-value of 4. 5 minutes at 150°F, the D-value can be calculated for 160°F by reducing the time by 1 log. The new D-value for 160°F given the z-value is 0. 45 minutes. This means that each 10°F increase in temperature will reduce our D-value by 1 log. Conversely, a 10°F decrease in temperature will increase our D-value by 1 log. So, the D-value for a temperature of 140°F would be 45 minutes.

Microbial Growth Characteristics in Foods 1. Competition 2. Metabiotic Growth 3. Symbiotic Growth 4. Synergistic Growth 5. Commensalism 6. Antagonistic Growth 7. Predation

1. Competition Energy and nutrient sources are often present in limiting concentrations; microorganisms compete each other for nutrients and results in exclusion of slower growing species. Foods contain a mixed population of microorganisms. Competition among the different kinds of microorganisms in food determines which one will outgrow the others and cause its characteristics types of changes.
Growth Different types of microorganism present normally in foods, but the predominant")
2. Metabiotic (Sequential)Growth Different types of microorganism present normally in foods, but the predominant types can change with time during storage. Ex: If the food is packaged in a bag with a little bit of air(e. g. ground meat), the aerobes will grow first and utilize O 2. The environment will become anaerobic, in which anaerobes grow favorably. Ex: In most food fermentations metabiotic growth is observed. In Sauerkraut fermentation, 4 different bacterial species grow in succession, one creating the favorable conditions for the next one. First , coliform grow produce acid and activate the growth of lactic acid bacteria. second, Leuconoctoc mesenteroides ; third Lb. plantarum Last, acid tolerant Lb. brevis

3. Symbiotic Growth Two or more microorganisms help one another during growth in food. In yogurt; there are two types of lactic acid bacteria. 1. S. thermophilus 2. Lb. bulgaricus S. thermophilus produces small quantities of formic acid and stimulates Lb. bulgaricus produce aminoacid inturn these products stimulate the growth Str. thermophilus

4. Synergistic Growth When two types of microorganism grow together and may able to bring changes which could not produce alone. Acetaldehyde is desirable flavor component in yogurt. S. thermophilus produce 8 ppm Acetaldehyde Lb. bulgaricus produce 10 ppm Acetaldehyde in milk independently, when they grow together, they produce 30 ppm Acetaldehyde.

5. Commensalism Microorganisms may not effect each other but one organisms uses the substrate whic is produced by other. For ex: cellulose hydrolyzing microorganisms produce glucose and cellulose non hydrolyzing micoorganims use this glucose. One population benefits while latter remain unaffected.

6. Antagonistic Growth Microorganisms can adversely affect each other, one kill the other. Some Gr(+) bacteria produce antimicrobial components that can kill many other types. For ex: L. lactis ssp. lactis produce bacteriocin called nisin and inhibits Gr(-)bacteria. 6. Predation Growth The example for predatory growth is the attachment of bacteria of the genus Bdellovibrio, Daptobacter and Stenotrphomonas maltophilia to Gr(-) bacteria, penetrating the cell wall, and subsequently multipying witin the periplasmic space.

III. Chemical Changes Caused my microorganisms 1. Changes in nitrogenous organic compounds 2. Changes in organic carbon compounds a) Carbohydrates b)Organic acids c)Other compounds d)Lipids e)Pectic substances
- Slides: 41