
Follow the conversation on Twitter using Econ Forecast





- Slides: 50
Follow the conversation on Twitter using: #Econ. Forecast
Major Sponsors
A Special Thanks To
Follow the conversation on Twitter using: #Econ. Forecast
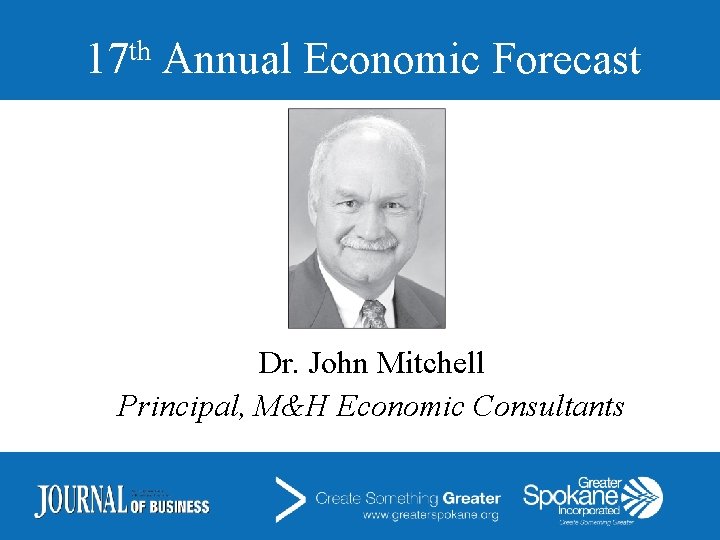
th 17 Annual Economic Forecast Dr. John Mitchell Principal, M&H Economic Consultants
th 17 Economic Forecast (Yellen For More or Decent Data/Scary Headlines) Greater Spokane Incorporated November 17, 2014 John W. Mitchell
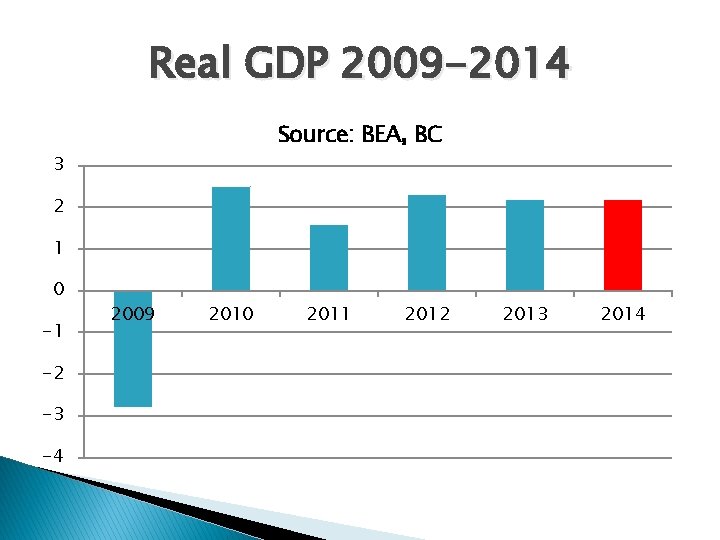
Real GDP 2009 -2014 Source: BEA, BC 3 2 1 0 -1 -2 -3 -4 2009 2010 2011 2012 2013 2014
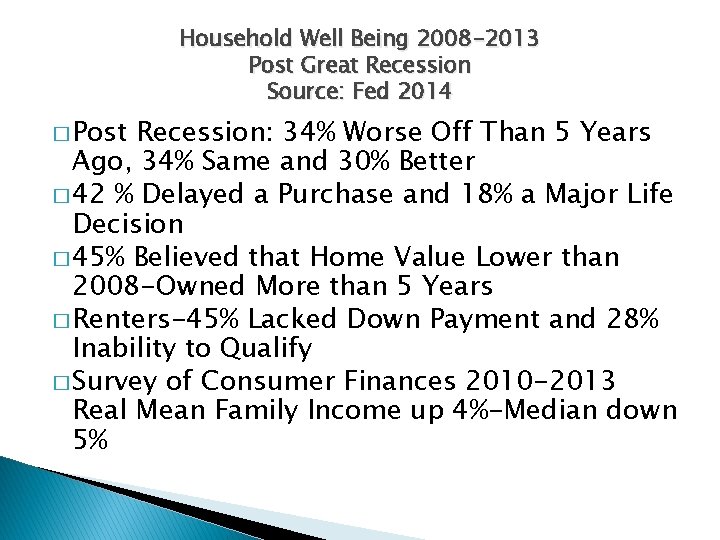
Household Well Being 2008 -2013 Post Great Recession Source: Fed 2014 � Post Recession: 34% Worse Off Than 5 Years Ago, 34% Same and 30% Better � 42 % Delayed a Purchase and 18% a Major Life Decision � 45% Believed that Home Value Lower than 2008 -Owned More than 5 Years � Renters-45% Lacked Down Payment and 28% Inability to Qualify � Survey of Consumer Finances 2010 -2013 Real Mean Family Income up 4%-Median down 5%
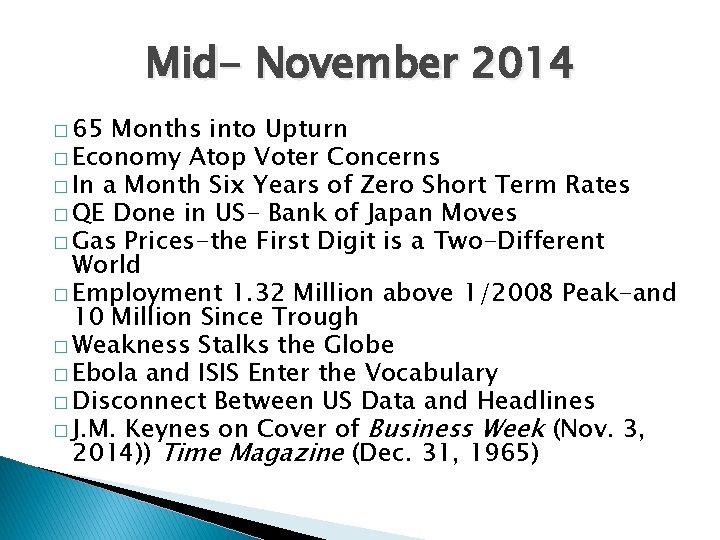
Mid- November 2014 � 65 Months into Upturn � Economy Atop Voter Concerns � In a Month Six Years of Zero Short Term Rates � QE Done in US- Bank of Japan Moves � Gas Prices-the First Digit is a Two-Different World � Employment 1. 32 Million above 1/2008 Peak-and 10 Million Since Trough � Weakness Stalks the Globe � Ebola and ISIS Enter the Vocabulary � Disconnect Between US Data and Headlines � J. M. Keynes on Cover of Business Week (Nov. 3, 2014)) Time Magazine (Dec. 31, 1965)
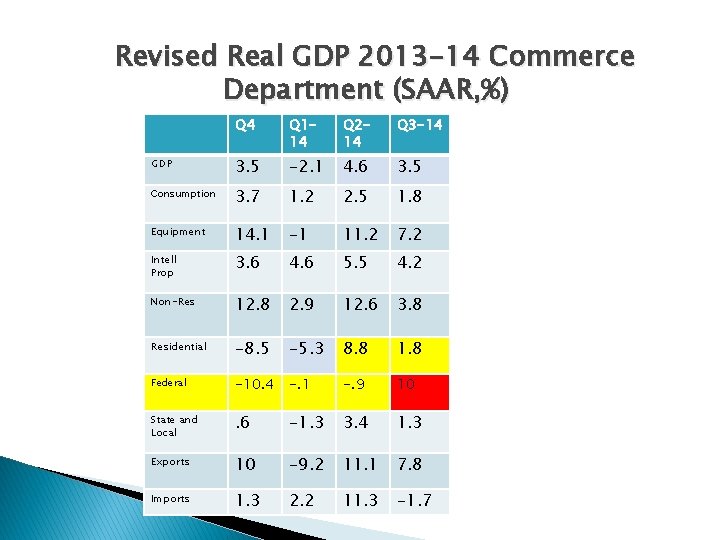
Revised Real GDP 2013 -14 Commerce Department (SAAR, %) Q 4 Q 114 Q 214 Q 3 -14 GDP 3. 5 -2. 1 4. 6 3. 5 Consumption 3. 7 1. 2 2. 5 1. 8 Equipment 14. 1 -1 11. 2 7. 2 Intell Prop 3. 6 4. 6 5. 5 4. 2 Non-Res 12. 8 2. 9 12. 6 3. 8 Residential -8. 5 -5. 3 8. 8 1. 8 Federal -10. 4 -. 1 -. 9 10 State and Local . 6 -1. 3 3. 4 1. 3 Exports 10 -9. 2 11. 1 7. 8 Imports 1. 3 2. 2 11. 3 -1. 7
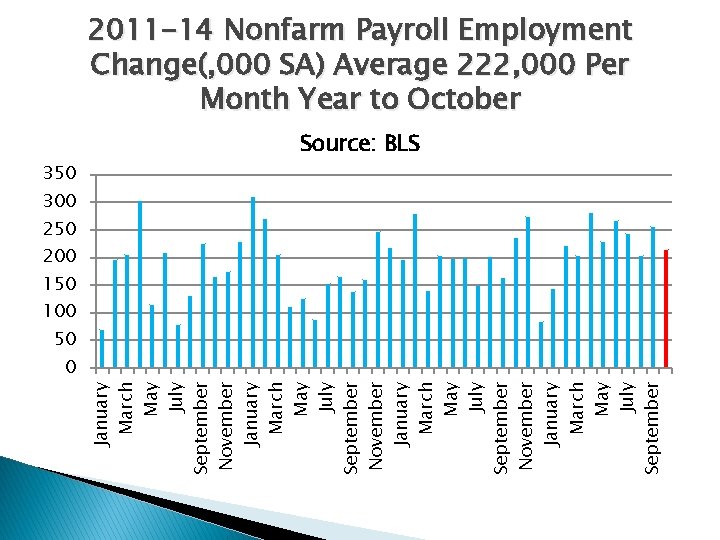
350 January March May July September November January March May July September 2011 -14 Nonfarm Payroll Employment Change(, 000 SA) Average 222, 000 Per Month Year to October Source: BLS 300 250 200 150 100 50 0
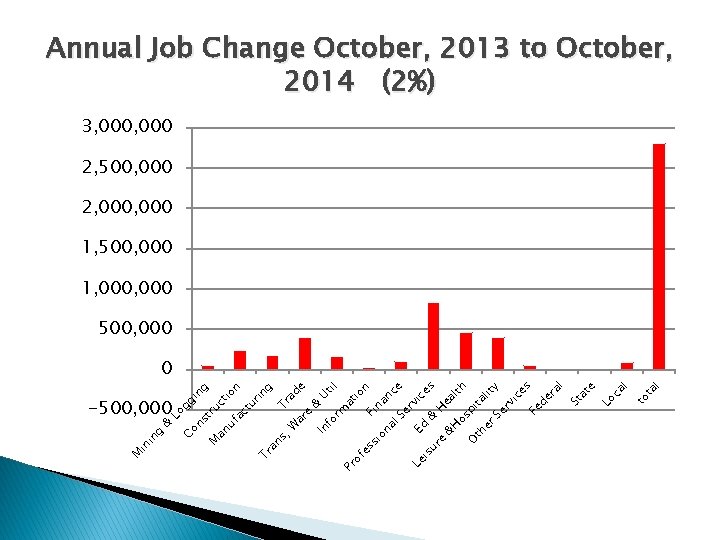
& Lo -500, 000 l to ta gg Co in ns g t ru M c an uf tion ac tu rin Tr g an Tr s, ad W ar e e & In Ut fo rm il Pr at io of n es F si i n on an al ce Se r Le Ed vic es is & ur H e &H ea os lth pi O ta th lit er y Se rv ic es Fe de ra l St at e Lo ca l g in in M Annual Job Change October, 2013 to October, 2014 (2%) 3, 000 2, 500, 000 2, 000 1, 500, 000 1, 000 500, 000 0
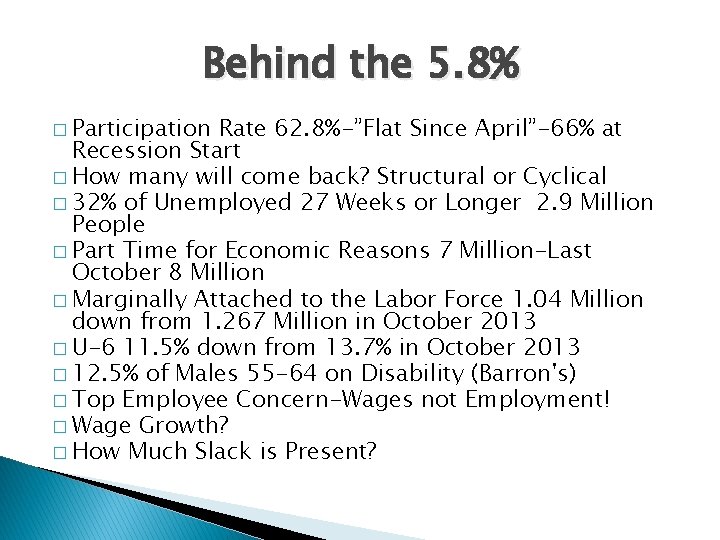
Behind the 5. 8% � Participation Rate 62. 8%-”Flat Since April”-66% at Recession Start � How many will come back? Structural or Cyclical � 32% of Unemployed 27 Weeks or Longer 2. 9 Million People � Part Time for Economic Reasons 7 Million-Last October 8 Million � Marginally Attached to the Labor Force 1. 04 Million down from 1. 267 Million in October 2013 � U-6 11. 5% down from 13. 7% in October 2013 � 12. 5% of Males 55 -64 on Disability (Barron's) � Top Employee Concern-Wages not Employment! � Wage Growth? � How Much Slack is Present?
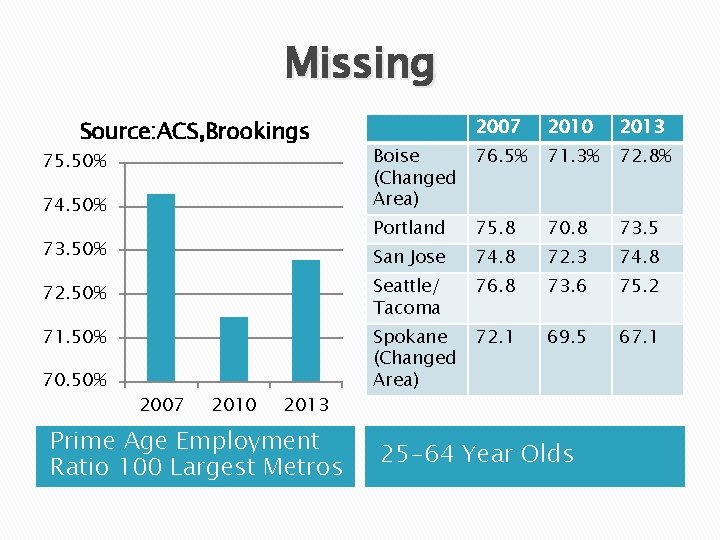
Missing 2007 2010 2013 76. 5% 71. 3% 72. 8% 74. 50% Boise (Changed Area) 73. 50% Portland 75. 8 70. 8 73. 5 San Jose 74. 8 72. 3 74. 8 72. 50% Seattle/ Tacoma 76. 8 73. 6 75. 2 71. 50% Spokane (Changed Area) 72. 1 69. 5 67. 1 Source: ACS, Brookings 75. 50% 70. 50% 2007 2010 2013 Prime Age Employment Ratio 100 Largest Metros 25 -64 Year Olds
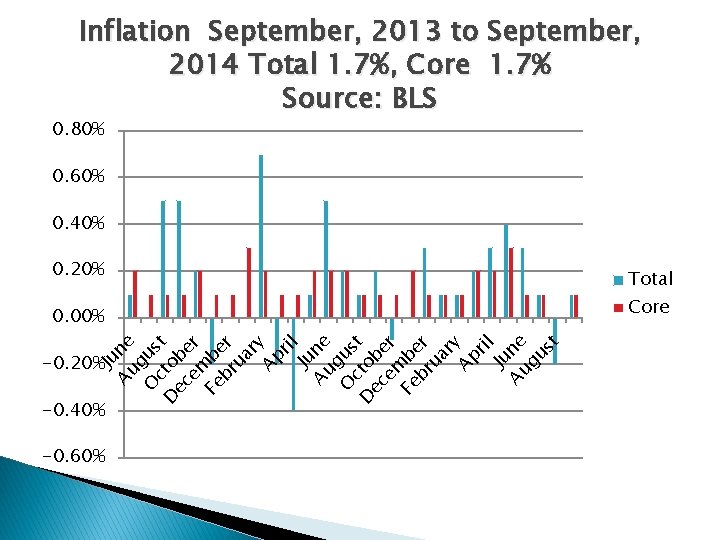
Inflation September, 2013 to September, 2014 Total 1. 7%, Core 1. 7% Source: BLS 0. 80% 0. 60% 0. 40% 0. 20% Ju Au ne g O us c D to t ec be em r Fe be br r ua ry Ap ril Ju Au ne gu st 0. 00% -0. 20% -0. 40% -0. 60% Total Core
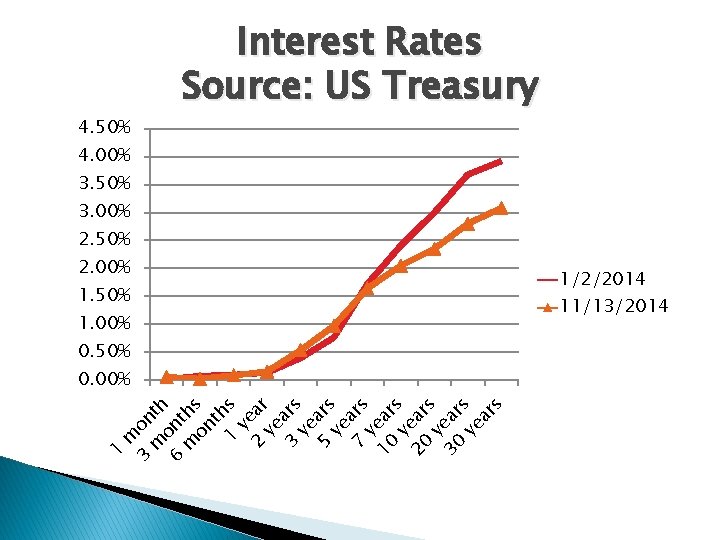
4. 50% Interest Rates Source: US Treasury 4. 00% 3. 50% 3. 00% 2. 50% 2. 00% 1. 50% 1. 00% 0. 50% 1 m 3 on m th o 6 nt m hs on th 1 s ye 2 ar ye 3 ars ye 5 ars ye 7 ars ye 10 ar ye s 20 ar ye s 30 ar ye s ar s 0. 00% 1/2/2014 11/13/2014
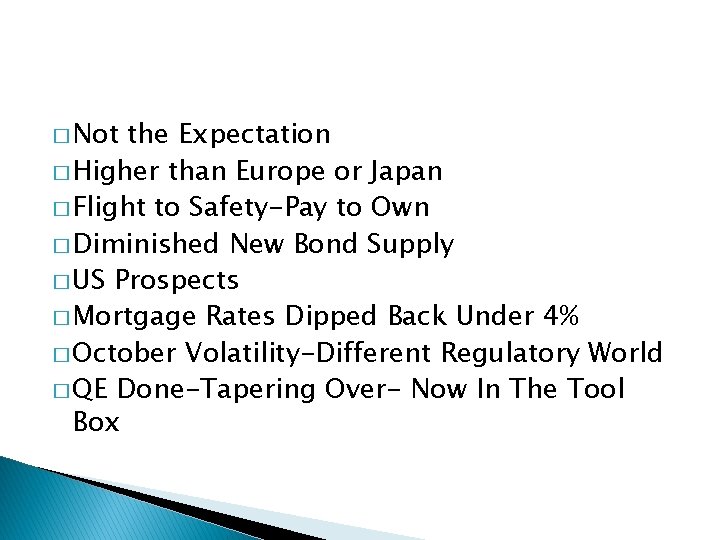
� Not the Expectation � Higher than Europe or Japan � Flight to Safety-Pay to Own � Diminished New Bond Supply � US Prospects � Mortgage Rates Dipped Back Under 4% � October Volatility-Different Regulatory World � QE Done-Tapering Over- Now In The Tool Box
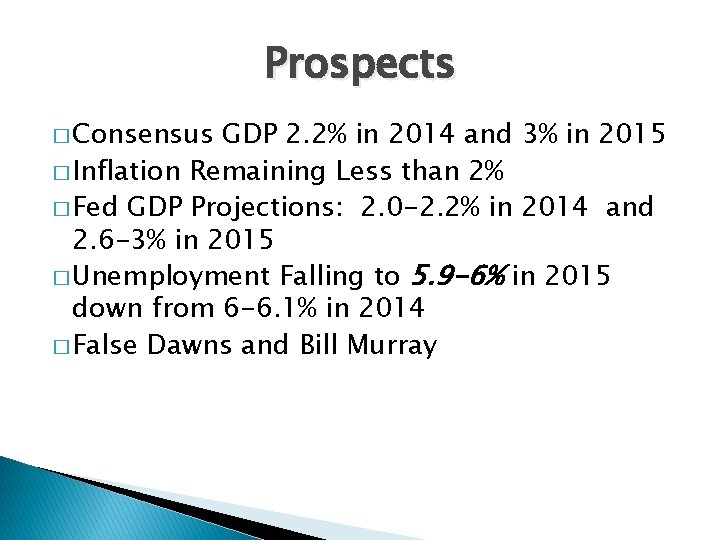
Prospects � Consensus GDP 2. 2% in 2014 and 3% in 2015 � Inflation Remaining Less than 2% � Fed GDP Projections: 2. 0 -2. 2% in 2014 and 2. 6 -3% in 2015 � Unemployment Falling to 5. 9 -6% in 2015 down from 6 -6. 1% in 2014 � False Dawns and Bill Murray
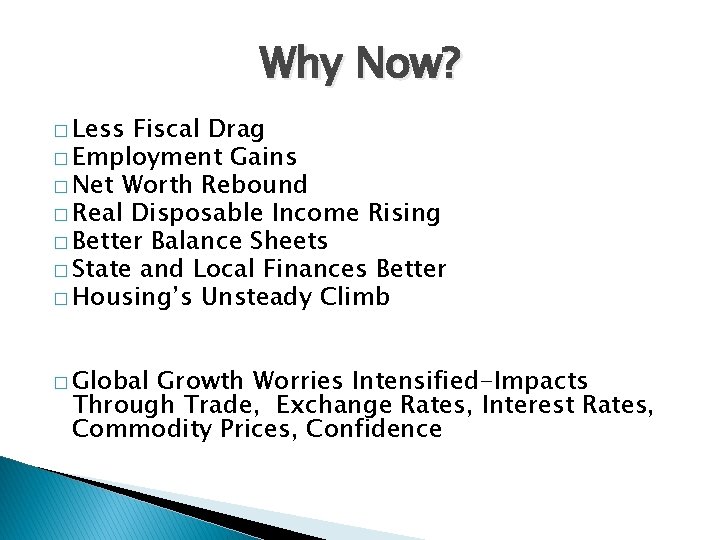
Why Now? � Less Fiscal Drag � Employment Gains � Net Worth Rebound � Real Disposable Income Rising � Better Balance Sheets � State and Local Finances Better � Housing’s Unsteady Climb � Global Growth Worries Intensified-Impacts Through Trade, Exchange Rates, Interest Rates, Commodity Prices, Confidence
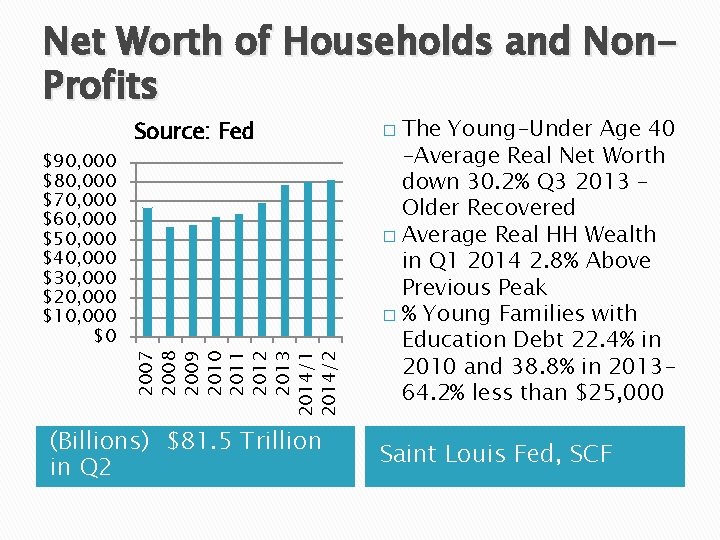
Net Worth of Households and Non. Profits 2007 2008 2009 2010 2011 2012 2013 2014/1 2014/2 $90, 000 $80, 000 $70, 000 $60, 000 $50, 000 $40, 000 $30, 000 $20, 000 $10, 000 $0 Source: Fed (Billions) $81. 5 Trillion in Q 2 The Young-Under Age 40 -Average Real Net Worth down 30. 2% Q 3 2013 – Older Recovered � Average Real HH Wealth in Q 1 2014 2. 8% Above Previous Peak � % Young Families with Education Debt 22. 4% in 2010 and 38. 8% in 201364. 2% less than $25, 000 � Saint Louis Fed, SCF
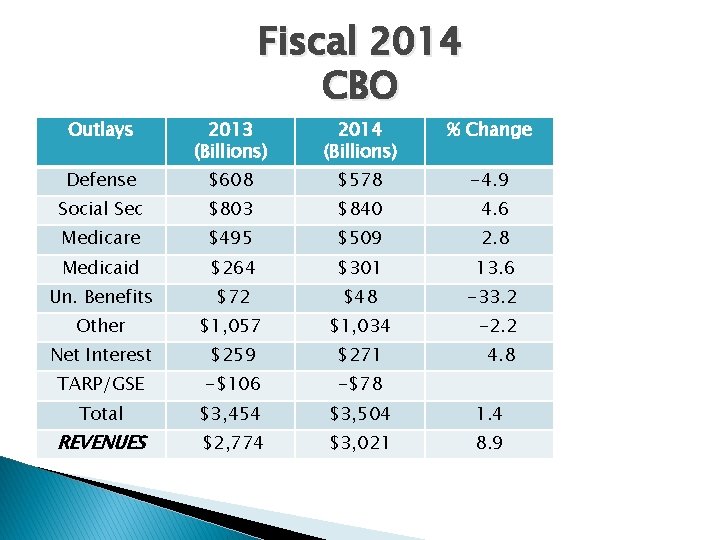
Fiscal 2014 CBO Outlays 2013 (Billions) 2014 (Billions) % Change Defense $608 $578 -4. 9 Social Sec $803 $840 4. 6 Medicare $495 $509 2. 8 Medicaid $264 $301 13. 6 Un. Benefits $72 $48 -33. 2 Other $1, 057 $1, 034 -2. 2 Net Interest $259 $271 4. 8 TARP/GSE -$106 -$78 Total $3, 454 $3, 504 1. 4 REVENUES $2, 774 $3, 021 8. 9
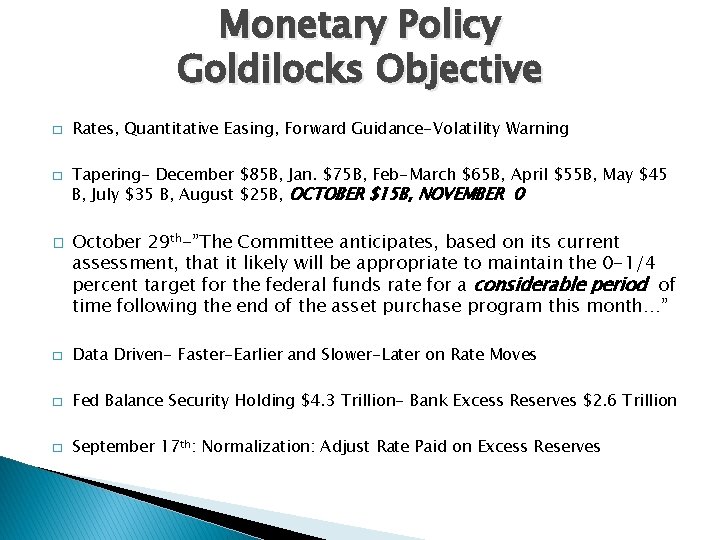
Monetary Policy Goldilocks Objective � � � Rates, Quantitative Easing, Forward Guidance-Volatility Warning Tapering- December $85 B, Jan. $75 B, Feb-March $65 B, April $55 B, May $45 B, July $35 B, August $25 B, OCTOBER $15 B, NOVEMBER 0 October 29 th-”The Committee anticipates, based on its current assessment, that it likely will be appropriate to maintain the 0 -1/4 percent target for the federal funds rate for a considerable period of time following the end of the asset purchase program this month…” � Data Driven- Faster-Earlier and Slower-Later on Rate Moves � Fed Balance Security Holding $4. 3 Trillion- Bank Excess Reserves $2. 6 Trillion � September 17 th: Normalization: Adjust Rate Paid on Excess Reserves
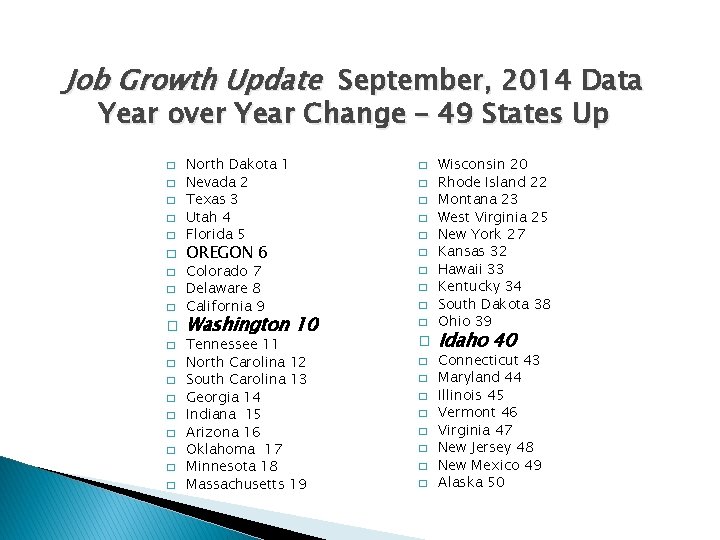
Job Growth Update September, 2014 Data Year over Year Change – 49 States Up � � � � � North Dakota 1 Nevada 2 Texas 3 Utah 4 Florida 5 OREGON 6 Colorado 7 Delaware 8 California 9 Washington 10 Tennessee 11 North Carolina 12 South Carolina 13 Georgia 14 Indiana 15 Arizona 16 Oklahoma 17 Minnesota 18 Massachusetts 19 � � � � � Wisconsin 20 Rhode Island 22 Montana 23 West Virginia 25 New York 27 Kansas 32 Hawaii 33 Kentucky 34 South Dakota 38 Ohio 39 Idaho 40 Connecticut 43 Maryland 44 Illinois 45 Vermont 46 Virginia 47 New Jersey 48 New Mexico 49 Alaska 50
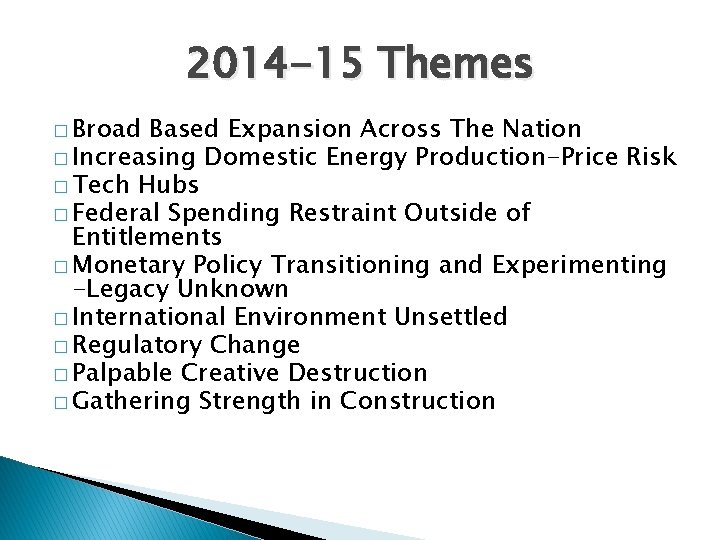
2014 -15 Themes � Broad Based Expansion Across The Nation � Increasing Domestic Energy Production-Price Risk � Tech Hubs � Federal Spending Restraint Outside of Entitlements � Monetary Policy Transitioning and Experimenting -Legacy Unknown � International Environment Unsettled � Regulatory Change � Palpable Creative Destruction � Gathering Strength in Construction
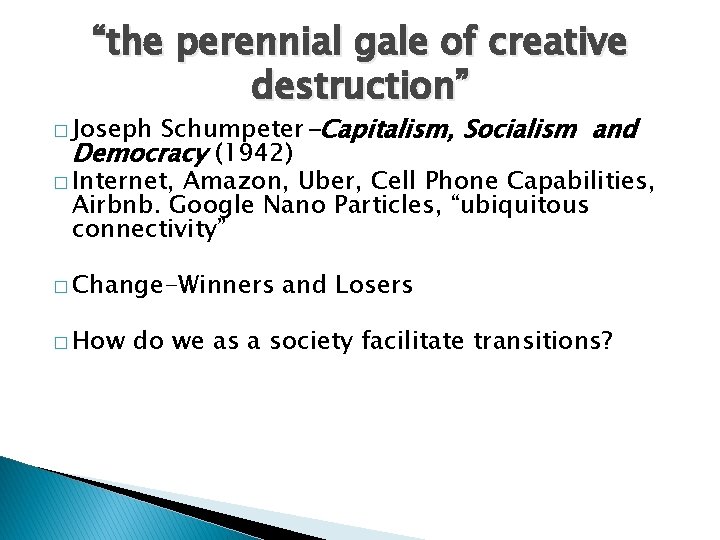
“the perennial gale of creative destruction” Schumpeter-Capitalism, Socialism and Democracy (1942) � Internet, Amazon, Uber, Cell Phone Capabilities, Airbnb. Google Nano Particles, “ubiquitous connectivity” � Joseph � Change-Winners � How and Losers do we as a society facilitate transitions?
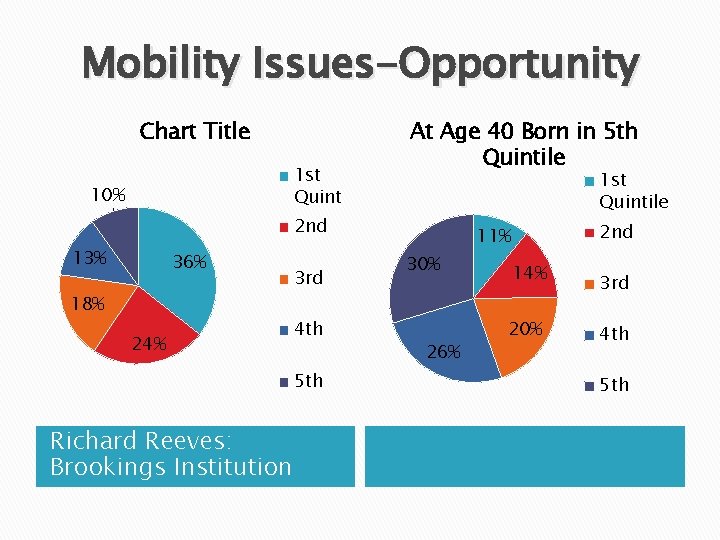
Mobility Issues-Opportunity Chart Title 1 st Quint 10% At Age 40 Born in 5 th Quintile 1 st Quintile 2 nd 13% 36% 18% 24% 3 rd 4 th 5 th Richard Reeves: Brookings Institution 2 nd 11% 30% 26% 14% 20% 3 rd 4 th 5 th
2014 -2015 Things to Ponder � What are the Leftovers of the Great Recession? � What � After Are the Incentives? 5 Years of About 2 percent, Is This The Best That We Can Do?
Follow the conversation on Twitter using: #Econ. Forecast
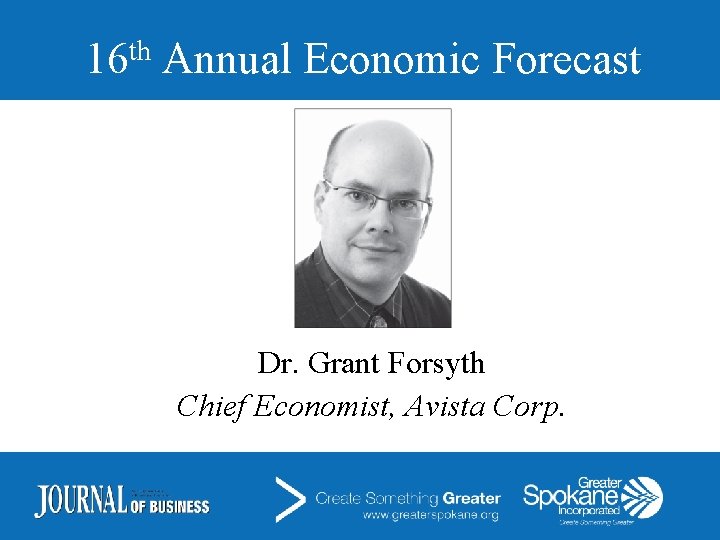
th 16 Annual Economic Forecast Dr. Grant Forsyth Chief Economist, Avista Corp.
2015 Regional Economic Outlook Grant D. Forsyth, Ph. D. Chief Economist Grant. Forsyth@avistacorp. com
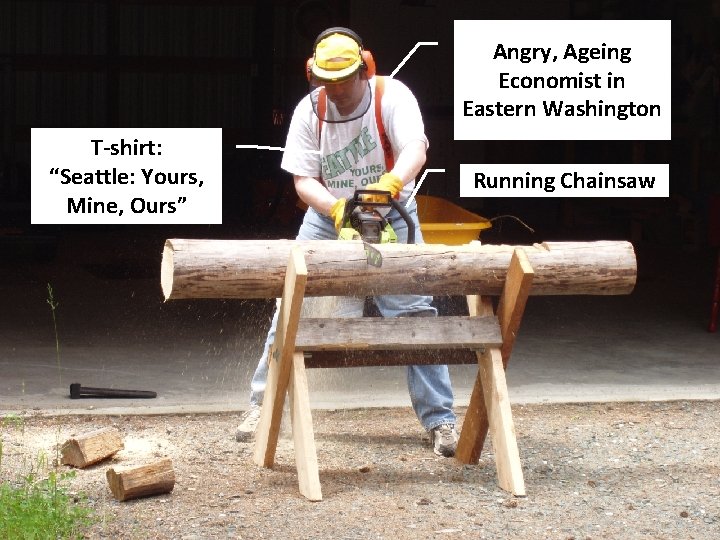
Angry, Ageing Economist in Eastern Washington T-shirt: “Seattle: Yours, Mine, Ours” Running Chainsaw
M d d l O , r e o l S e w n a r, e r o b n U n a al d e c
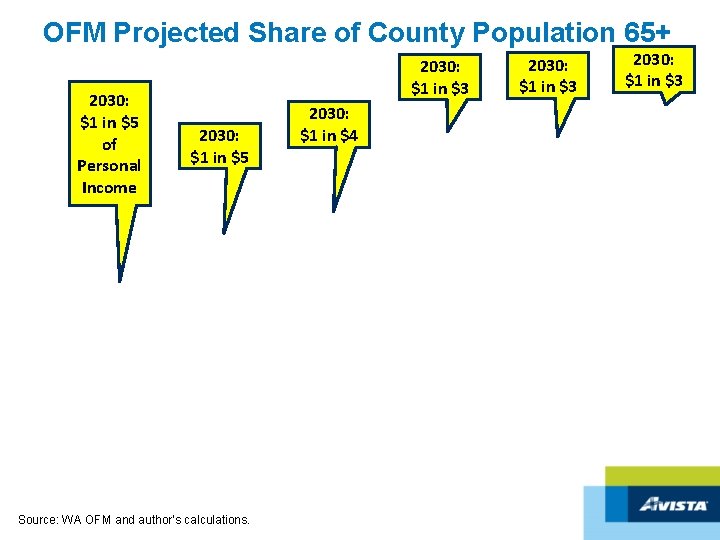
OFM Projected Share of County Population 65+ 2030: $1 in $5 of Personal Income 2030: $1 in $3 2030: $1 in $5 Source: WA OFM and author’s calculations. 2030: $1 in $4 2030: $1 in $3
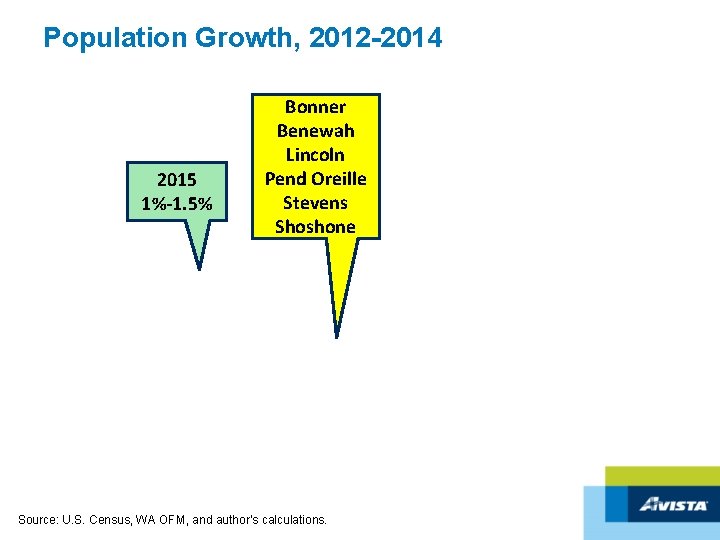
Population Growth, 2012 -2014 2015 1%-1. 5% Bonner Benewah Lincoln Pend Oreille Stevens Shoshone Source: U. S. Census, WA OFM, and author’s calculations.
Non-Farm Employment Growth, 2013 -2014 2015 1%-1. 5% Source: BLS and author’s calculations.
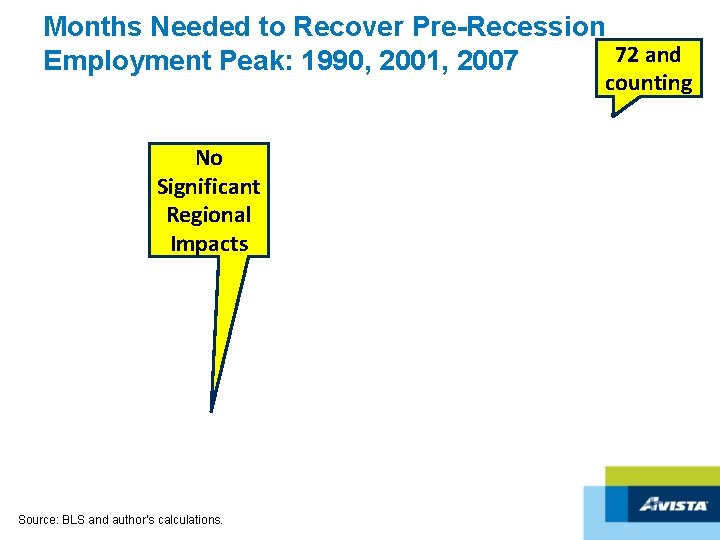
Months Needed to Recover Pre-Recession 72 and Employment Peak: 1990, 2001, 2007 counting No Significant Regional Impacts Source: BLS and author’s calculations.
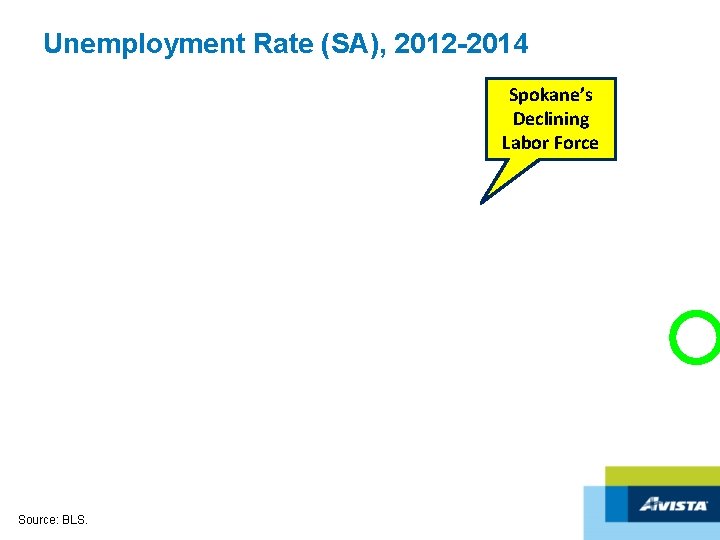
Unemployment Rate (SA), 2012 -2014 Spokane’s Declining Labor Force Source: BLS.
Spokane+Kootenai Initial Unemployment Claims (SA), 2004 -2014 Source: WA and ID Employment Security and author’s calculations.
Average Annual Real Wage Growth by Recovery Source: BLS QCEW and inflation indexes and author’s calculations.
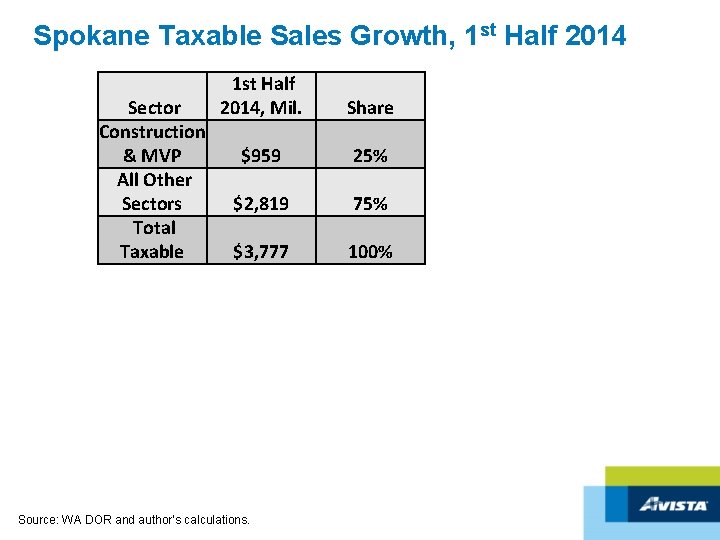
Spokane Taxable Sales Growth, 1 st Half 2014 Sector Construction & MVP All Other Sectors Total Taxable 1 st Half 2014, Mil. Share $959 25% $2, 819 75% $3, 777 100% Source: WA DOR and author’s calculations.
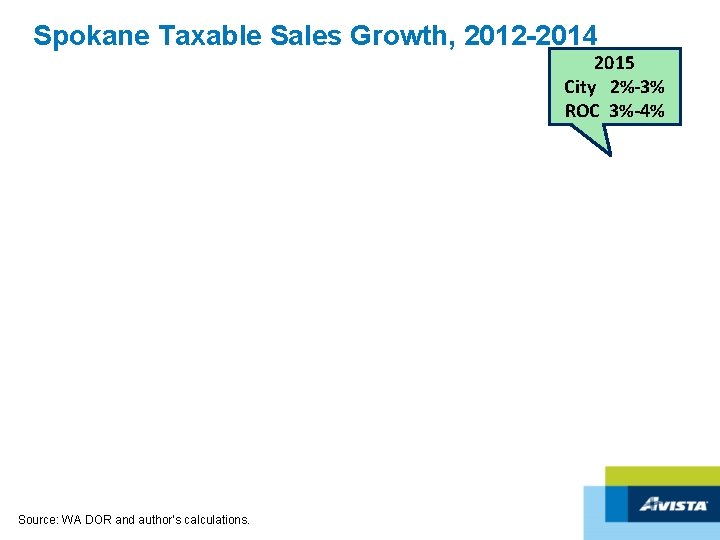
Spokane Taxable Sales Growth, 2012 -2014 2015 City 2%-3% ROC 3%-4% Source: WA DOR and author’s calculations.
Spokane and Kootenai Gas Prices, Current = November 14, 2014 Source: AAA.
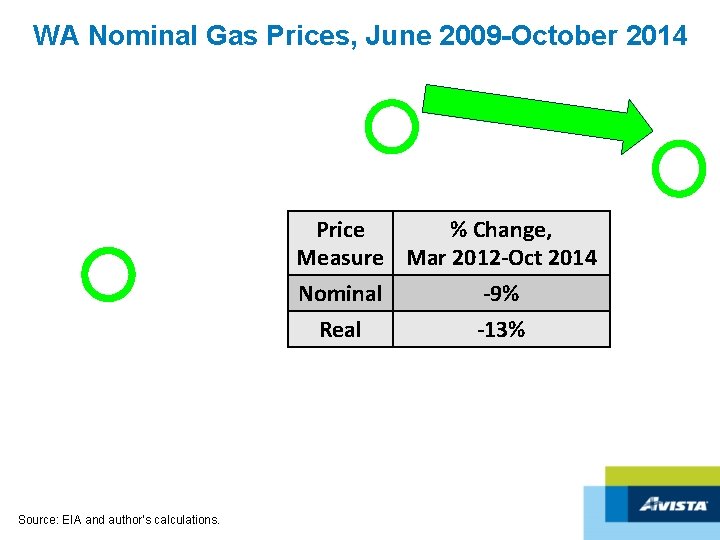
WA Nominal Gas Prices, June 2009 -October 2014 Price % Change, Measure Mar 2012 -Oct 2014 Nominal Real Source: EIA and author’s calculations. -9% -13%
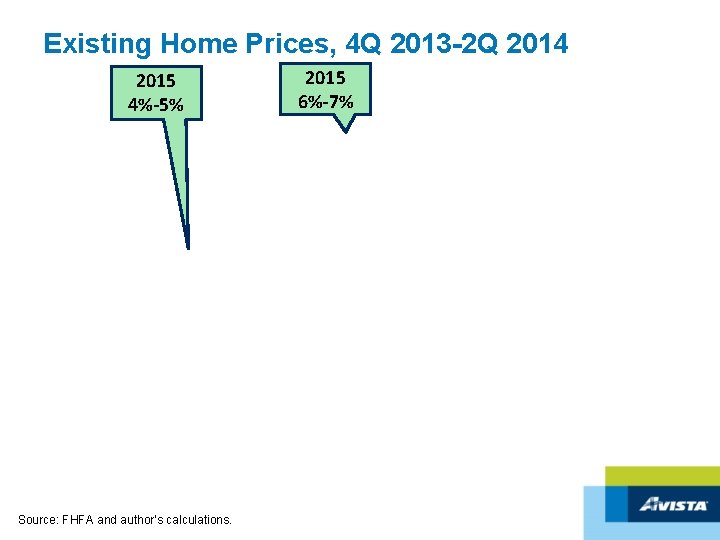
Existing Home Prices, 4 Q 2013 -2 Q 2014 2015 4%-5% Source: FHFA and author’s calculations. 2015 6%-7%
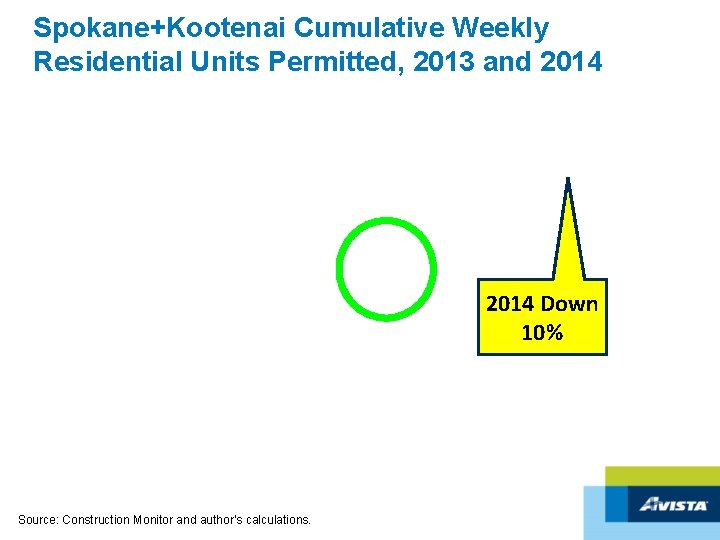
Spokane+Kootenai Cumulative Weekly Residential Units Permitted, 2013 and 2014 Down 10% Source: Construction Monitor and author’s calculations.
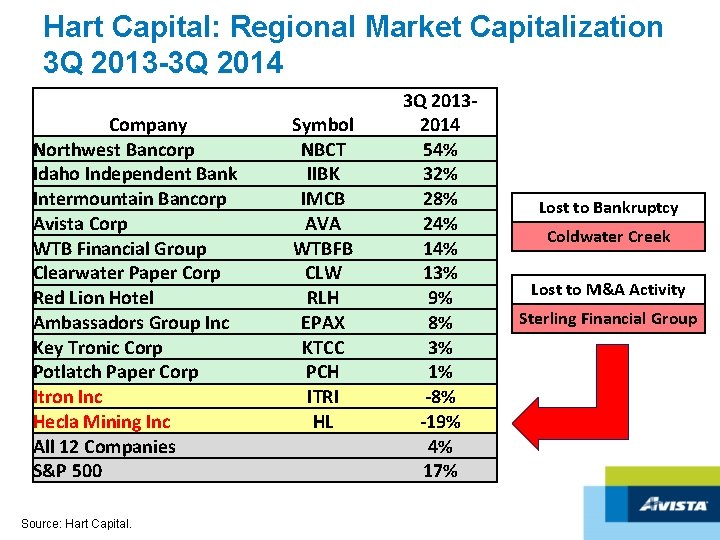
Hart Capital: Regional Market Capitalization 3 Q 2013 -3 Q 2014 Company Northwest Bancorp Idaho Independent Bank Intermountain Bancorp Avista Corp WTB Financial Group Clearwater Paper Corp Red Lion Hotel Ambassadors Group Inc Key Tronic Corp Potlatch Paper Corp Itron Inc Hecla Mining Inc All 12 Companies S&P 500 Source: Hart Capital. Symbol NBCT IIBK IMCB AVA WTBFB CLW RLH EPAX KTCC PCH ITRI HL 3 Q 20132014 54% 32% 28% 24% 13% 9% 8% 3% 1% -8% -19% 4% 17% Lost to Bankruptcy Coldwater Creek Lost to M&A Activity Sterling Financial Group
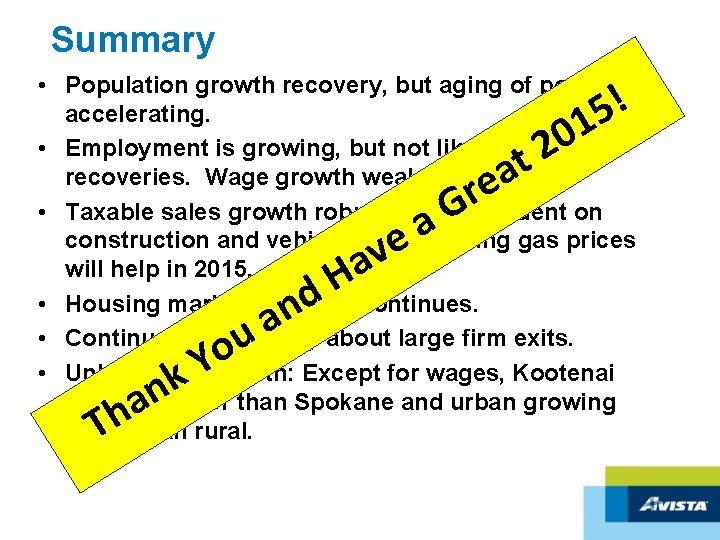
Summary • Population growth recovery, but aging of population accelerating. • Employment is growing, but not like previous recoveries. Wage growth weak. • Taxable sales growth robust, but dependent on construction and vehicle sales. Falling gas prices will help in 2015. • Housing market recovery continues. • Continued uncertainty about large firm exits. • Unbalanced growth: Except for wages, Kootenai growing faster than Spokane and urban growing faster than rural. e v a H d Th k n a u o Y G a a e r 0 2 t ! 5 1
Follow the conversation on Twitter using: #Econ. Forecast
Major Sponsors
Follow the conversation on Twitter using: #Econ. Forecast