Focus You have 10 minutes to finish gluing


 and limited economic")
 and varied economies.")


 Rates:")


 Rates:")


- Slides: 22
Focus You have 10 minutes to finish gluing items on your poster. We are starting class immediately after the buzzer sounds. Any work done after that is considered late, which is a deduction of 10 points.
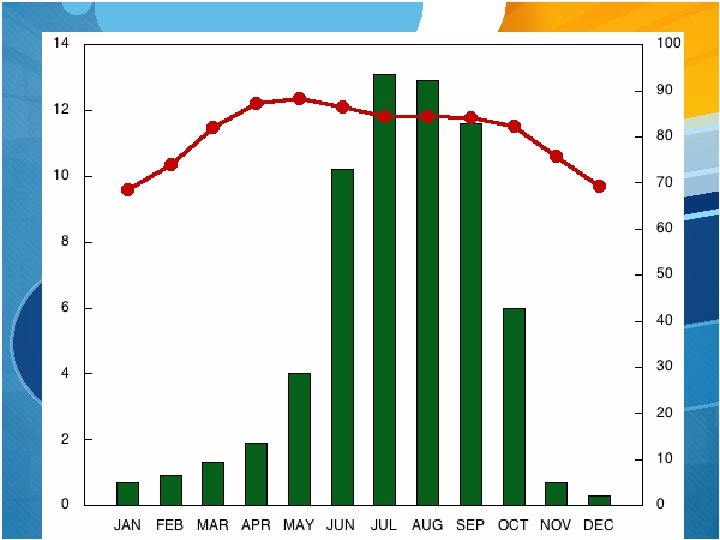
Climographs are used to depict the climate of a given place over a year’s worth of time. Precipitation is found on the y axis on the left. It is represented by a bar graph. Temperature is found on the y axis on the right. It is represented by a line graph. You can interpret a climograph to tell about a place’s location, climate zone, and etc.
Climographs 1. You can tell which hemisphere a place is. How? 2. Answer: look for summer/winter. Summer is in June – August in the Northern Hemisphere. 3. You can tell a place’s latitude. How? 4. Answer: Temperature differences & precipitation differences. 5. You can see how close it is to water. How? 6. The amount of precipitation it receives.
Calcutta, India
Capetown, South Africa
s d i m a r y P n o i t a l u Pop Graphic s n o i t a t n ese r p e R l a
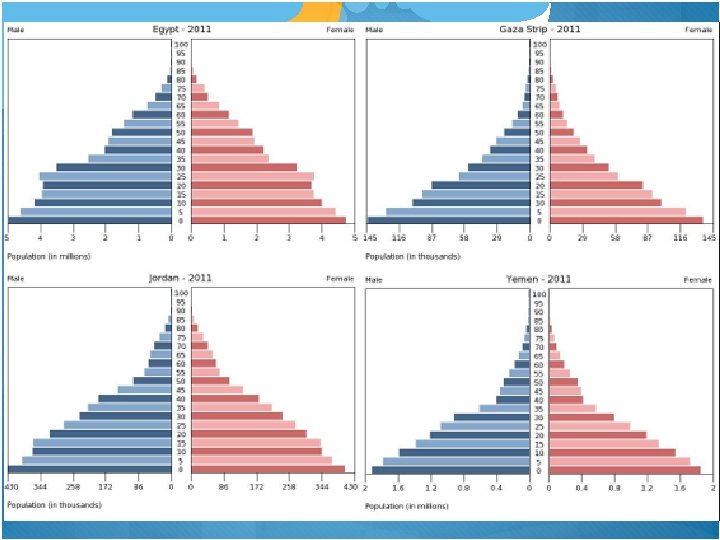
What is a population pyramid? A population pyramid is a graphical representation of a country’s population distribution by age and sex.
What is a developing nation? Developing nations are poorer (low GDP) and limited economic development.
What is a developed nation? Countries that are richer (high GDP) and varied economies.
Which is developing? Which is developed?
Triangle High birth rate Low life expectancy Equal gender distribution
Developing Nation 1. Birth Rates: High 5. Literacy Rate: Low 2. Death (Mortality) Rates: High 6. Urban Population: Low 3. Infant Mortality Rates: High 7. Medical Care and Technology: Low 4. Life Expectancy: Low 8. Per Capita GDP: Low
Diamond Low birth rate Declining death rate
House Medium birth rate Generation boom at middle ages High life expectancy
Skewed Gender distribution
Developed Nation 1. Birth Rates: Low 5. Literacy Rate: High 2. Death (Mortality) Rates: Low 6. Urban Population: High 3. Infant Mortality Rates: Low 7. Medical Care and Technology: High 4. Life Expectancy: High 8. Per Capita GDP: High
What do population pyramids describe? Hint! It describes _______ & _______ distribution
A B C D
Life Expectancy th ea D e at R Most of the population is under the age of 20 Birth Rate
Life Expectancy Most of the population is centered between 20 – 55 De ath Ra te Death Rate Birth Rate