Flowmon Probe The most powerful Net Flow IPFIX

Flowmon Probe The most powerful Net. Flow / IPFIX Exporter for Network Monitoring
Gaining Network Visibility Why do I need network monitoring? Without visibility into the network traffic, it is impossible to effectively manage and protect any network.

Network Traffic Monitoring § Different technologies for monitoring: § SNMP (monitoring) § Basic, counter level, detailed information is missing § Flow monitoring (Net. Flow/IPFIX monitoring) § Detailed overview of all communications in network § Packet analysis § Very detailed, resource consuming, sometimes necessary
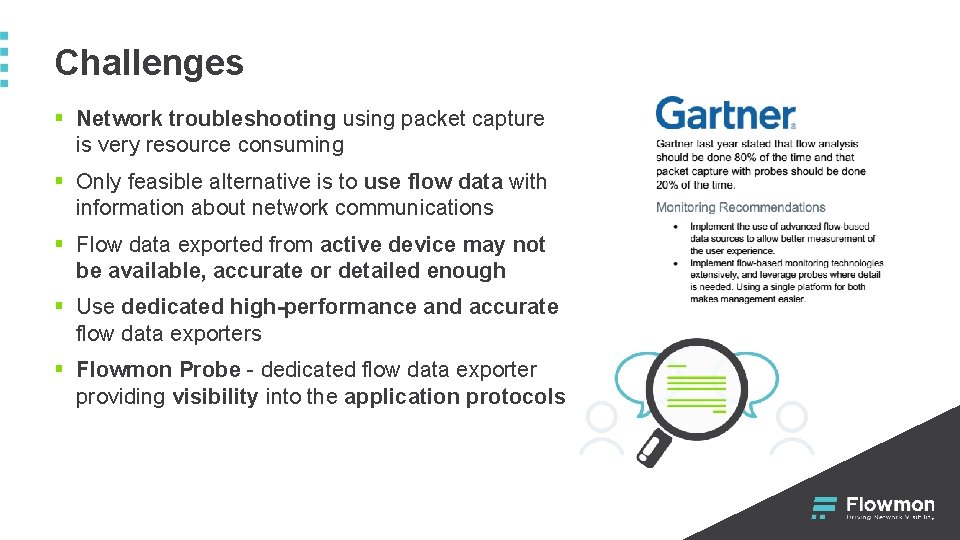
Challenges § Network troubleshooting using packet capture is very resource consuming § Only feasible alternative is to use flow data with information about network communications § Flow data exported from active device may not be available, accurate or detailed enough § Use dedicated high-performance and accurate flow data exporters § Flowmon Probe - dedicated flow data exporter providing visibility into the application protocols

Flowmon Probe Ultimate performance and application layer visibility
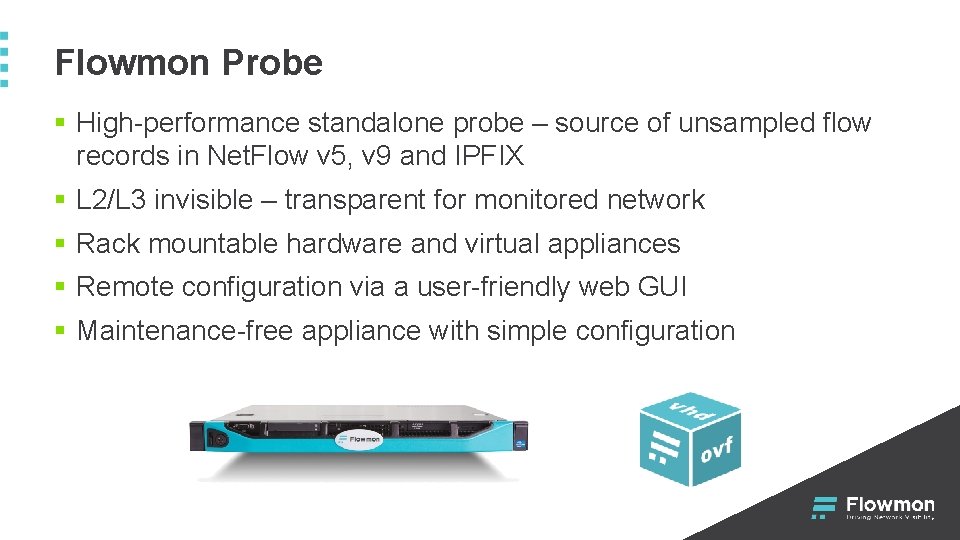
Flowmon Probe § High-performance standalone probe – source of unsampled flow records in Net. Flow v 5, v 9 and IPFIX § L 2/L 3 invisible – transparent for monitored network § Rack mountable hardware and virtual appliances § Remote configuration via a user-friendly web GUI § Maintenance-free appliance with simple configuration
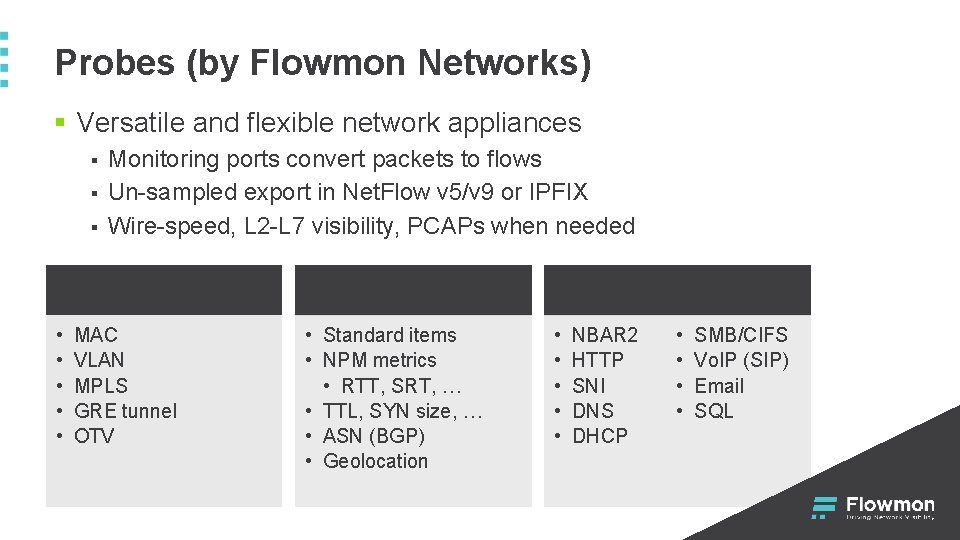
Probes (by Flowmon Networks) § Versatile and flexible network appliances § § § Monitoring ports convert packets to flows Un-sampled export in Net. Flow v 5/v 9 or IPFIX Wire-speed, L 2 -L 7 visibility, PCAPs when needed L 2 • • • MAC VLAN MPLS GRE tunnel OTV L 3/L 4 • Standard items • NPM metrics • RTT, SRT, … • TTL, SYN size, … • ASN (BGP) • Geolocation L 7 • • • NBAR 2 HTTP SNI DNS DHCP • • SMB/CIFS Vo. IP (SIP) Email SQL
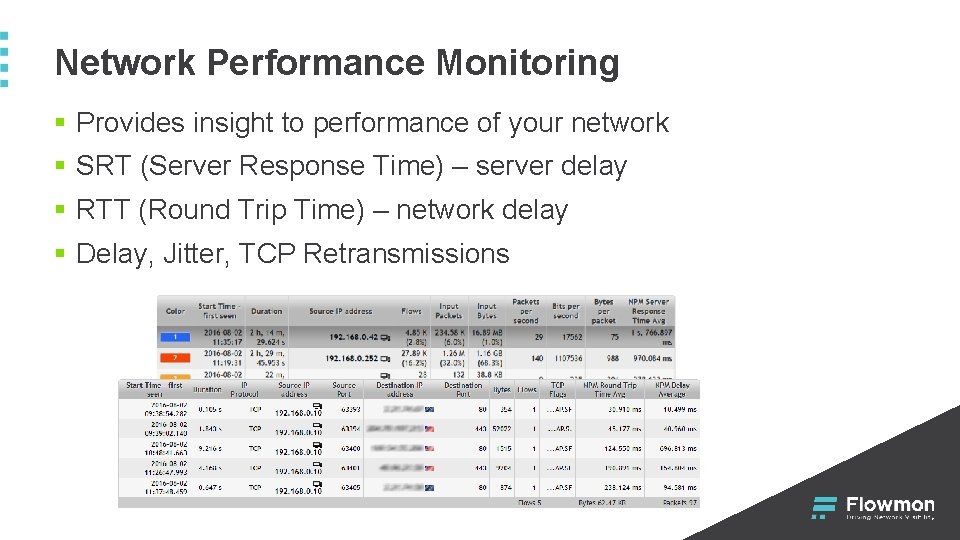
Network Performance Monitoring § Provides insight to performance of your network § SRT (Server Response Time) – server delay § RTT (Round Trip Time) – network delay § Delay, Jitter, TCP Retransmissions
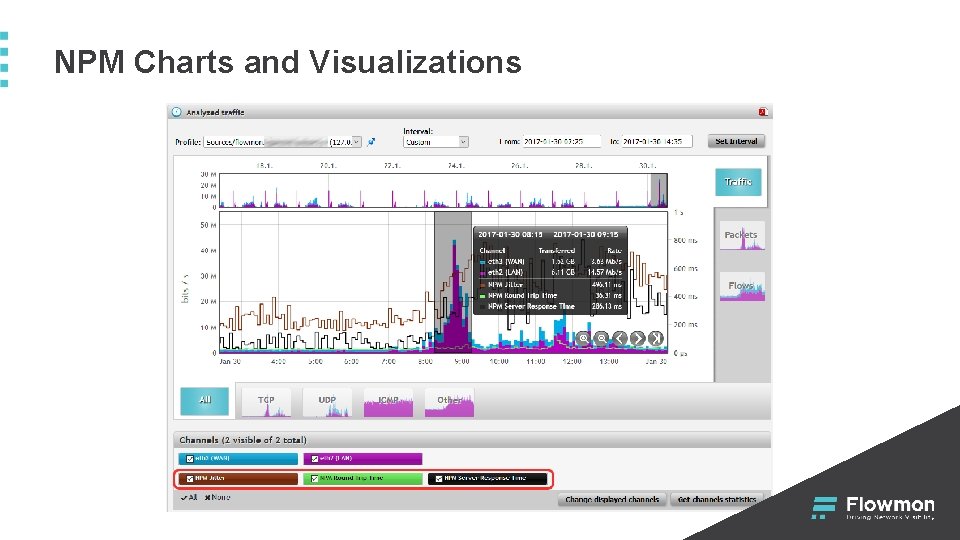
NPM Charts and Visualizations
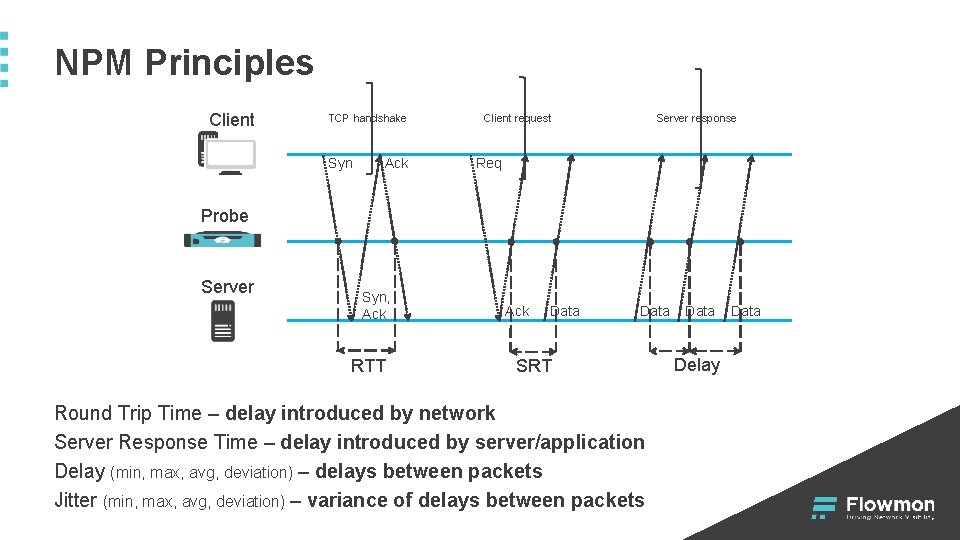
NPM Principles Client TCP handshake Syn Ack Client request Server response Req Probe Server Syn, Ack RTT Ack Data SRT Round Trip Time – delay introduced by network Server Response Time – delay introduced by server/application Delay (min, max, avg, deviation) – delays between packets Jitter (min, max, avg, deviation) – variance of delays between packets Data Delay Data
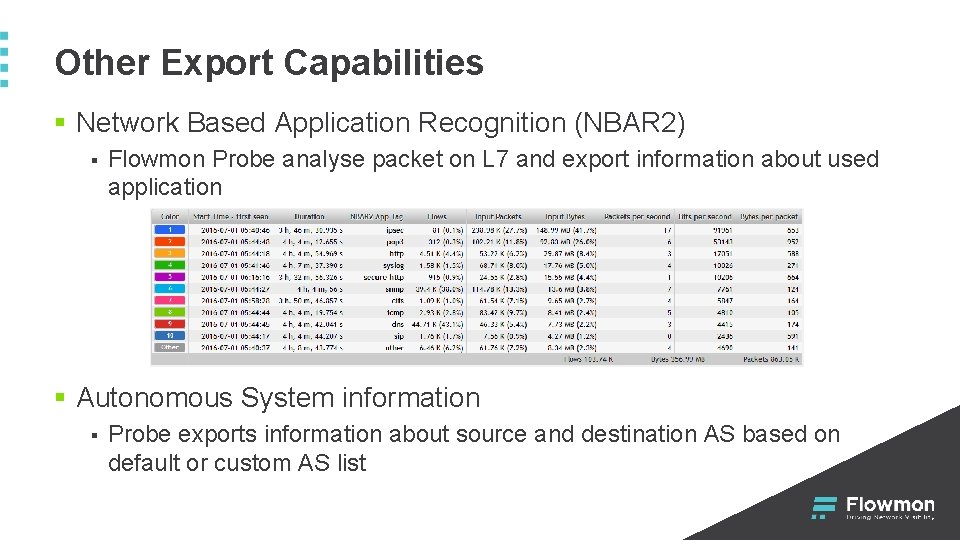
Other Export Capabilities § Network Based Application Recognition (NBAR 2) § Flowmon Probe analyse packet on L 7 and export information about used application § Autonomous System information § Probe exports information about source and destination AS based on default or custom AS list
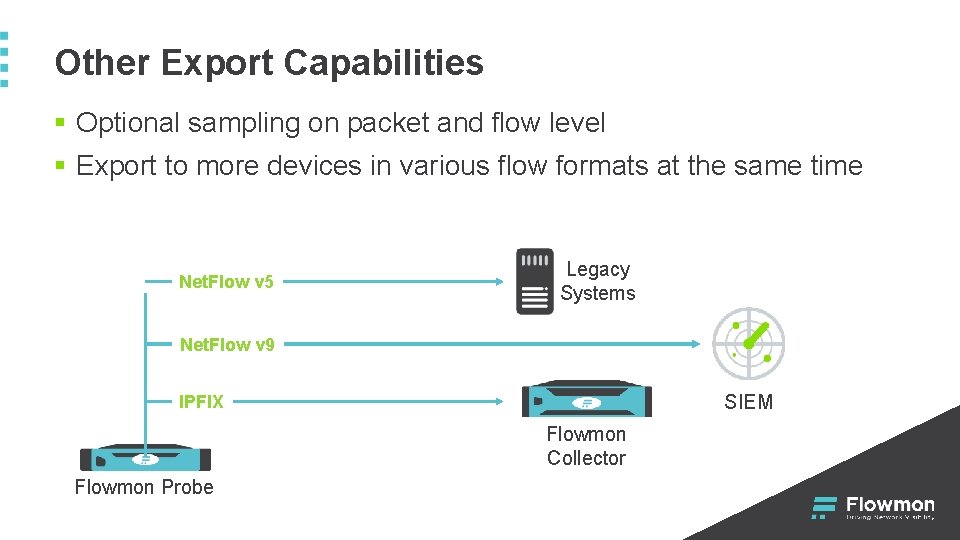
Other Export Capabilities § Optional sampling on packet and flow level § Export to more devices in various flow formats at the same time Net. Flow v 5 Legacy Systems Net. Flow v 9 SIEM IPFIX Flowmon Collector Flowmon Probe
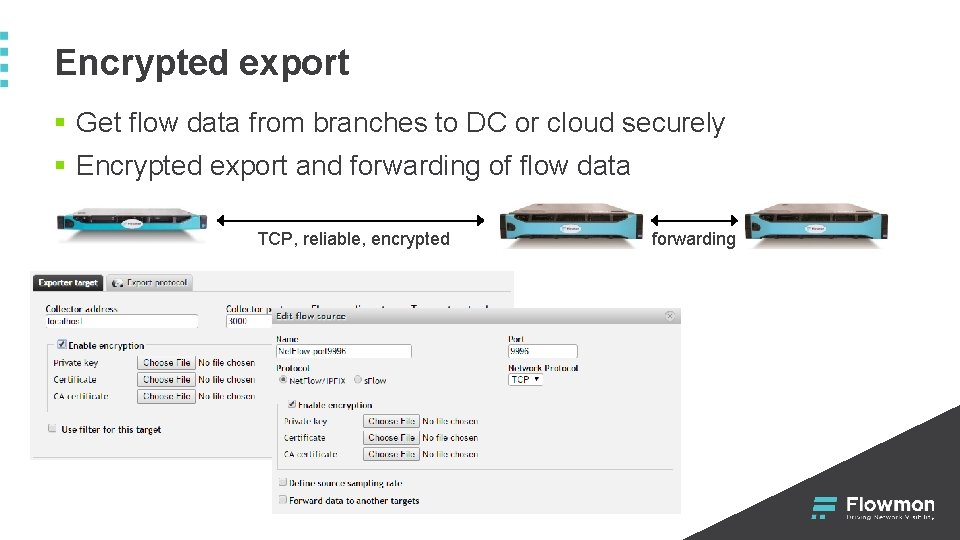
Encrypted export § Get flow data from branches to DC or cloud securely § Encrypted export and forwarding of flow data TCP, reliable, encrypted forwarding
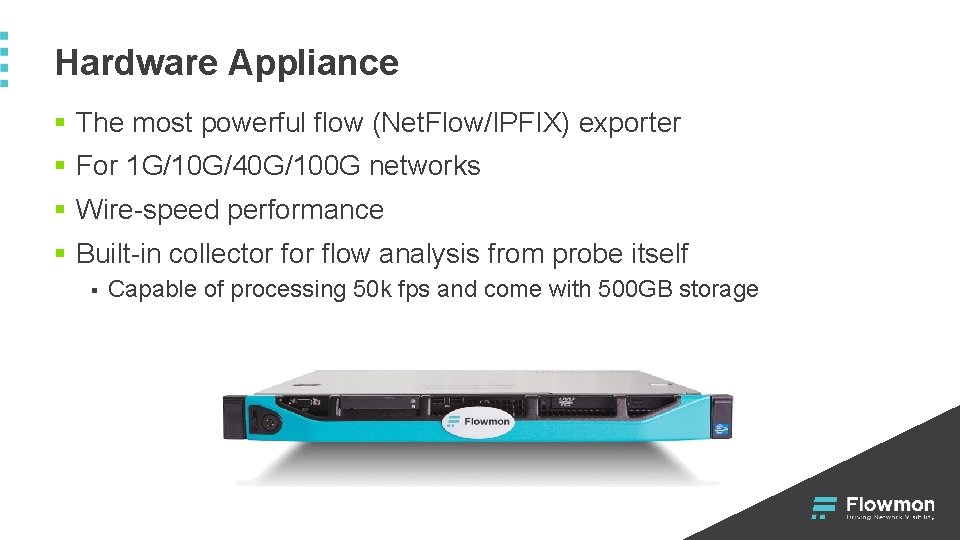
Hardware Appliance § The most powerful flow (Net. Flow/IPFIX) exporter § For 1 G/10 G/40 G/100 G networks § Wire-speed performance § Built-in collector flow analysis from probe itself § Capable of processing 50 k fps and come with 500 GB storage
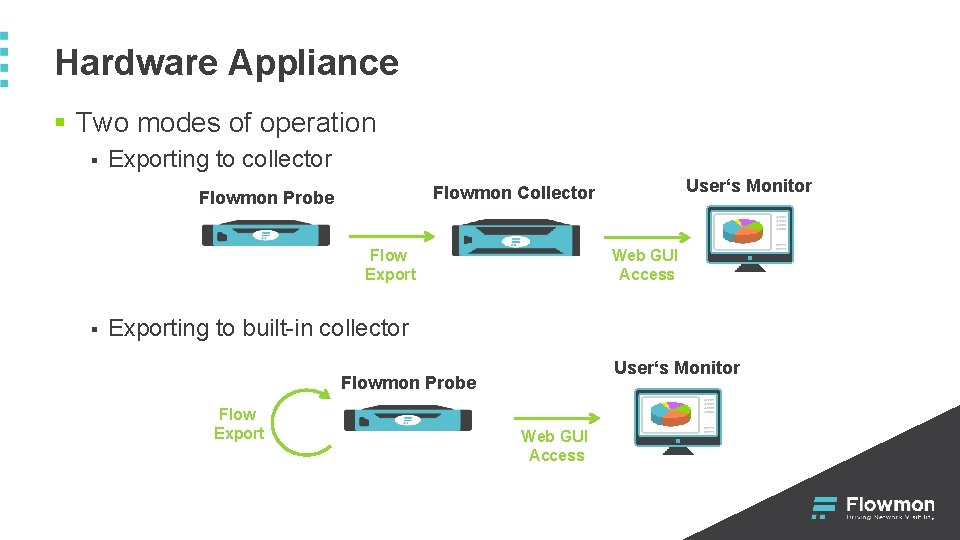
Hardware Appliance § Two modes of operation § Exporting to collector Flowmon Probe Flow Export § User‘s Monitor Flowmon Collector Web GUI Access Exporting to built-in collector User‘s Monitor Flowmon Probe Flow Export Web GUI Access
Virtual Appliance § Enables to monitor virtual switch or physical network § For 1 G and 10 G networks § Available for VMware (4. 1+), Microsoft Hyper -V (2012) and KVM § Does not contain built-in collector § Minimum configuration of VA § § 2 GB RAM 2 virtual cores 300 IOPS 6 GB of disk space
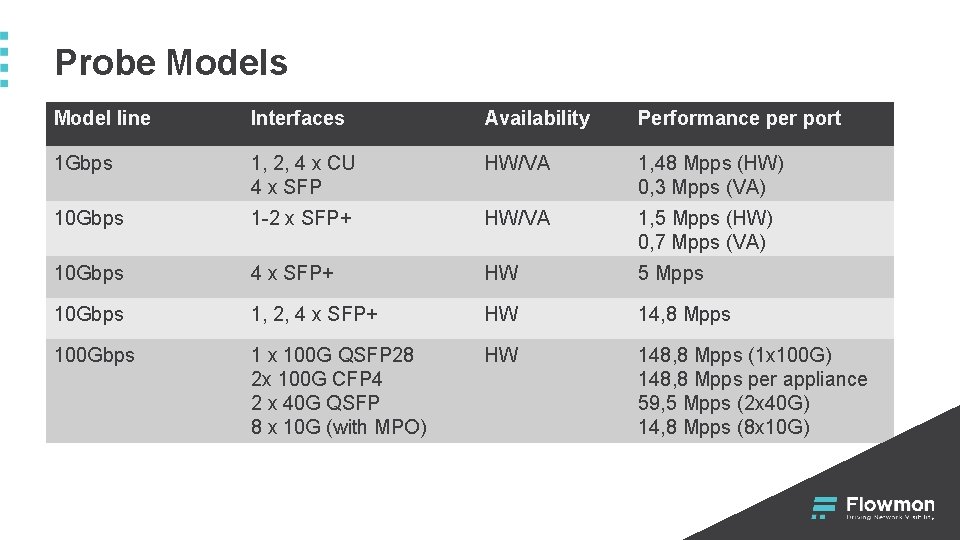
Probe Models Model line Interfaces Availability Performance per port 1 Gbps 1, 2, 4 x CU 4 x SFP HW/VA 1, 48 Mpps (HW) 0, 3 Mpps (VA) 10 Gbps 1 -2 x SFP+ HW/VA 1, 5 Mpps (HW) 0, 7 Mpps (VA) 10 Gbps 4 x SFP+ HW 5 Mpps 10 Gbps 1, 2, 4 x SFP+ HW 14, 8 Mpps 100 Gbps 1 x 100 G QSFP 28 2 x 100 G CFP 4 2 x 40 G QSFP 8 x 10 G (with MPO) HW 148, 8 Mpps (1 x 100 G) 148, 8 Mpps per appliance 59, 5 Mpps (2 x 40 G) 14, 8 Mpps (8 x 10 G)
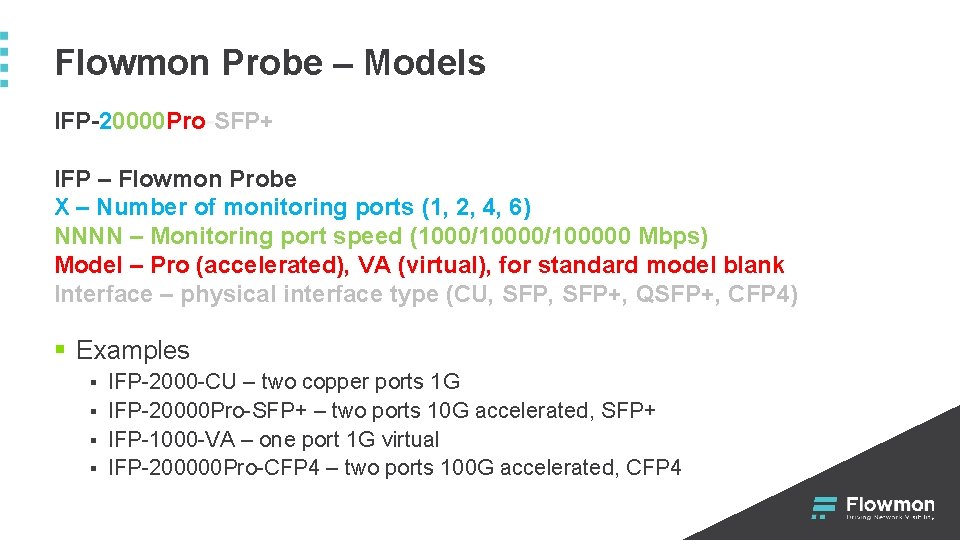
Flowmon Probe – Models IFP-20000 Pro-SFP+ IFP – Flowmon Probe X – Number of monitoring ports (1, 2, 4, 6) NNNN – Monitoring port speed (1000/100000 Mbps) Model – Pro (accelerated), VA (virtual), for standard model blank Interface – physical interface type (CU, SFP+, QSFP+, CFP 4) § Examples § § IFP-2000 -CU – two copper ports 1 G IFP-20000 Pro-SFP+ – two ports 10 G accelerated, SFP+ IFP-1000 -VA – one port 1 G virtual IFP-200000 Pro-CFP 4 – two ports 100 G accelerated, CFP 4
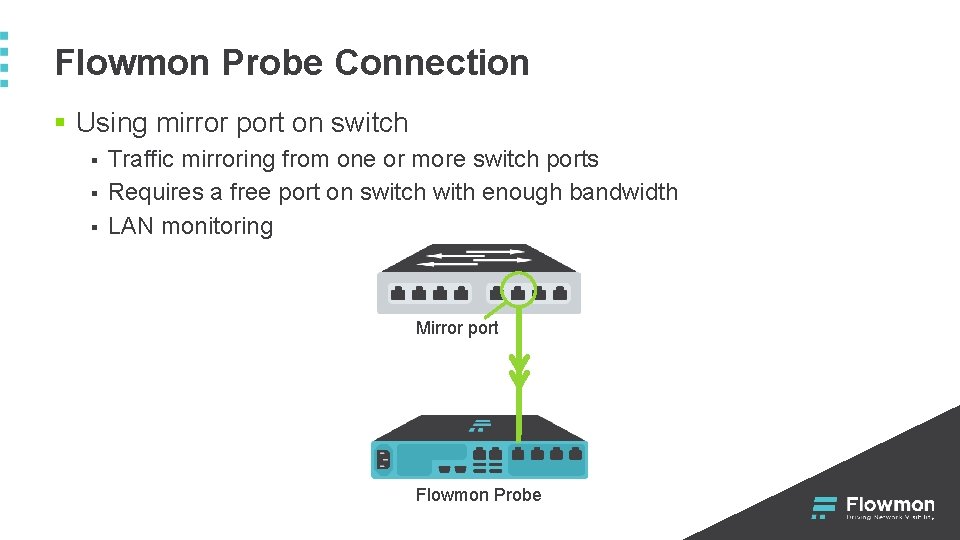
Flowmon Probe Connection § Using mirror port on switch § § § Traffic mirroring from one or more switch ports Requires a free port on switch with enough bandwidth LAN monitoring Mirror port Flowmon Probe
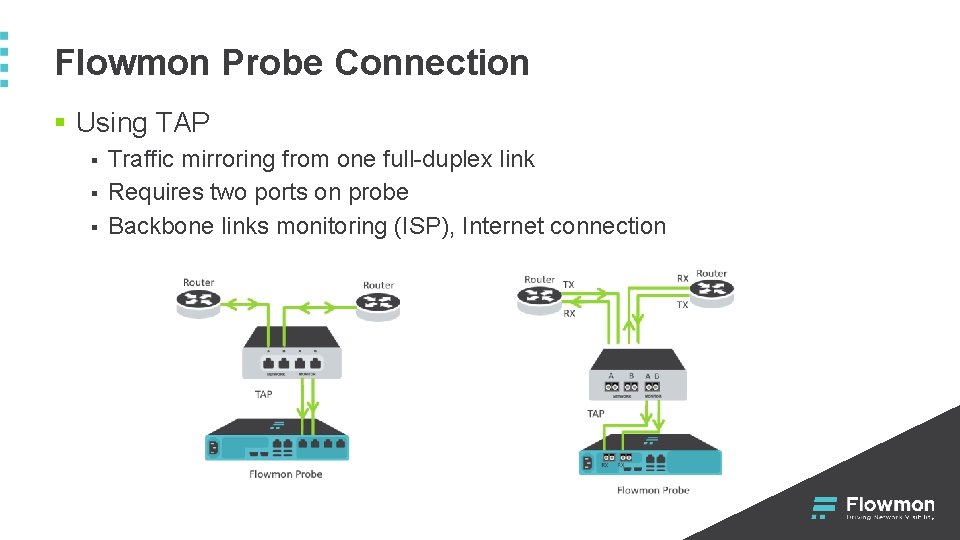
Flowmon Probe Connection § Using TAP § § § Traffic mirroring from one full-duplex link Requires two ports on probe Backbone links monitoring (ISP), Internet connection
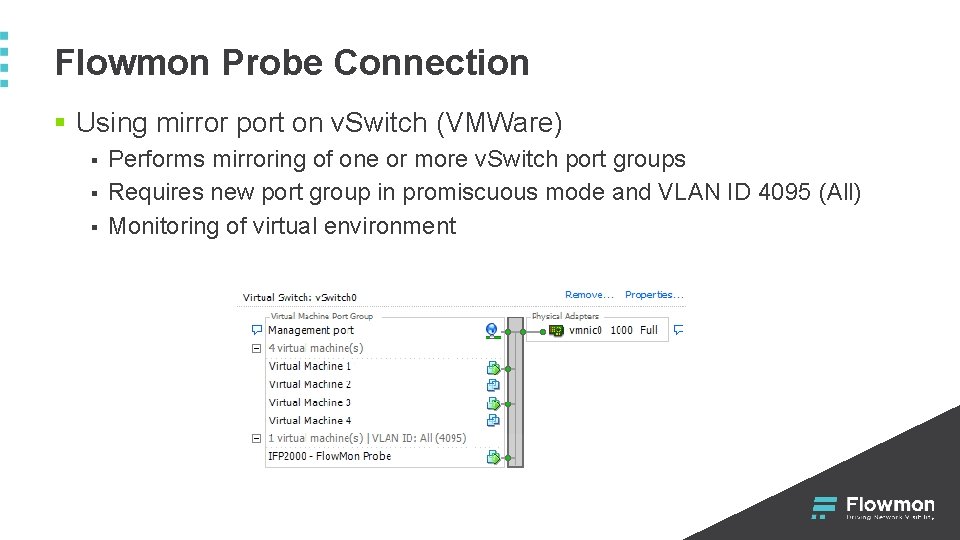
Flowmon Probe Connection § Using mirror port on v. Switch (VMWare) § § § Performs mirroring of one or more v. Switch port groups Requires new port group in promiscuous mode and VLAN ID 4095 (All) Monitoring of virtual environment
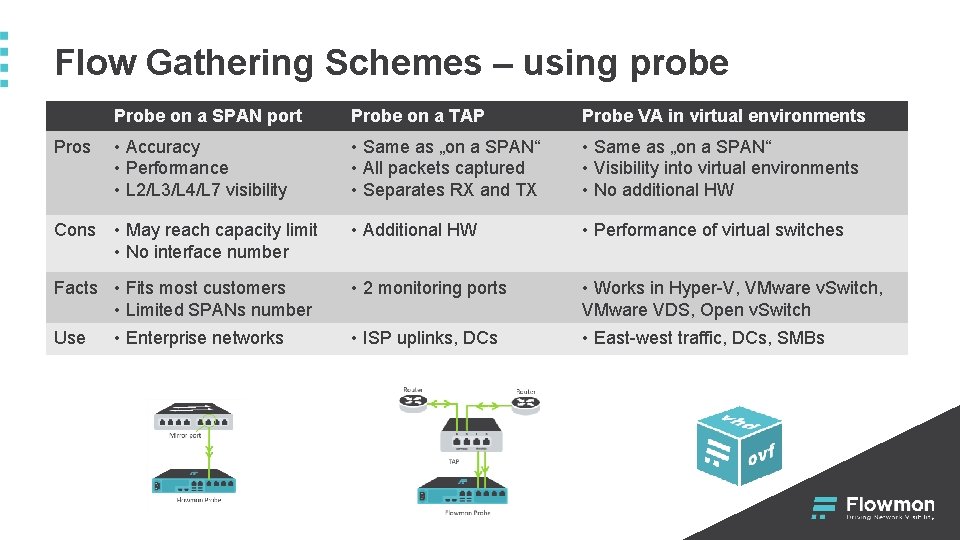
Flow Gathering Schemes – using probe Probe on a SPAN port Probe on a TAP Probe VA in virtual environments Pros • Accuracy • Performance • L 2/L 3/L 4/L 7 visibility • Same as „on a SPAN“ • All packets captured • Separates RX and TX • Same as „on a SPAN“ • Visibility into virtual environments • No additional HW Cons • May reach capacity limit • No interface number • Additional HW • Performance of virtual switches • 2 monitoring ports • Works in Hyper-V, VMware v. Switch, VMware VDS, Open v. Switch • ISP uplinks, DCs • East-west traffic, DCs, SMBs Facts • Fits most customers • Limited SPANs number Use • Enterprise networks
Flowmon IPFIX Extensions Detailed Visibility into Network Traffic
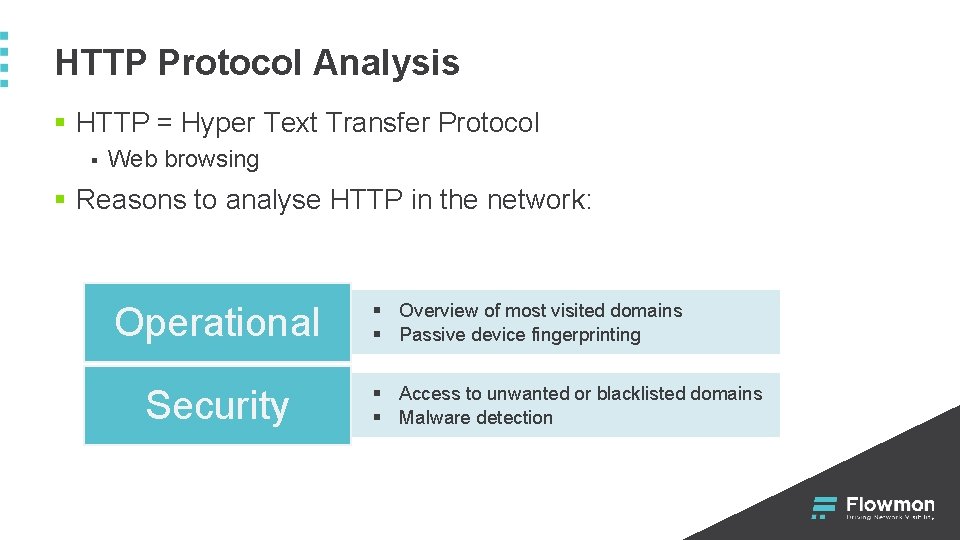
HTTP Protocol Analysis § HTTP = Hyper Text Transfer Protocol § Web browsing § Reasons to analyse HTTP in the network: Operational Security § Overview of most visited domains § Passive device fingerprinting § Access to unwanted or blacklisted domains § Malware detection
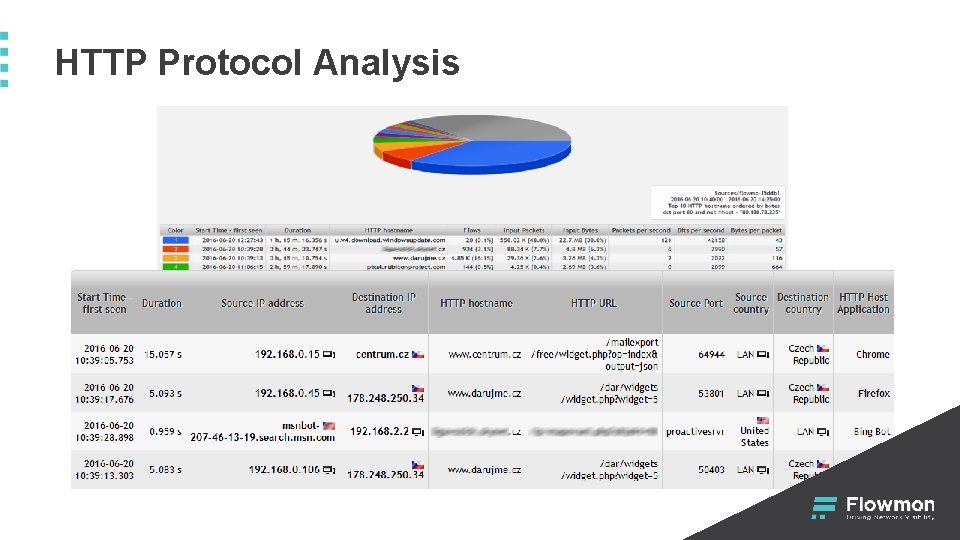
HTTP Protocol Analysis
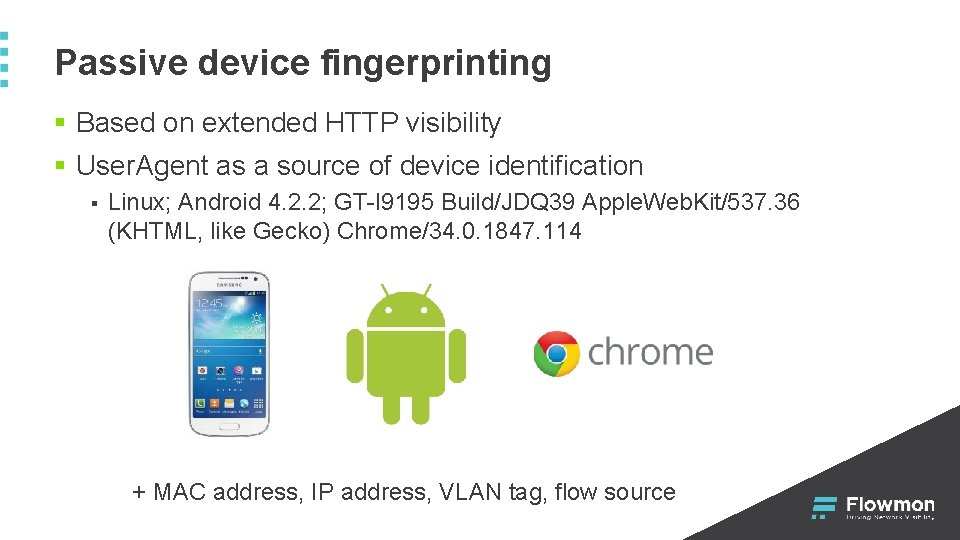
Passive device fingerprinting § Based on extended HTTP visibility § User. Agent as a source of device identification § Linux; Android 4. 2. 2; GT-l 9195 Build/JDQ 39 Apple. Web. Kit/537. 36 (KHTML, like Gecko) Chrome/34. 0. 1847. 114 + MAC address, IP address, VLAN tag, flow source
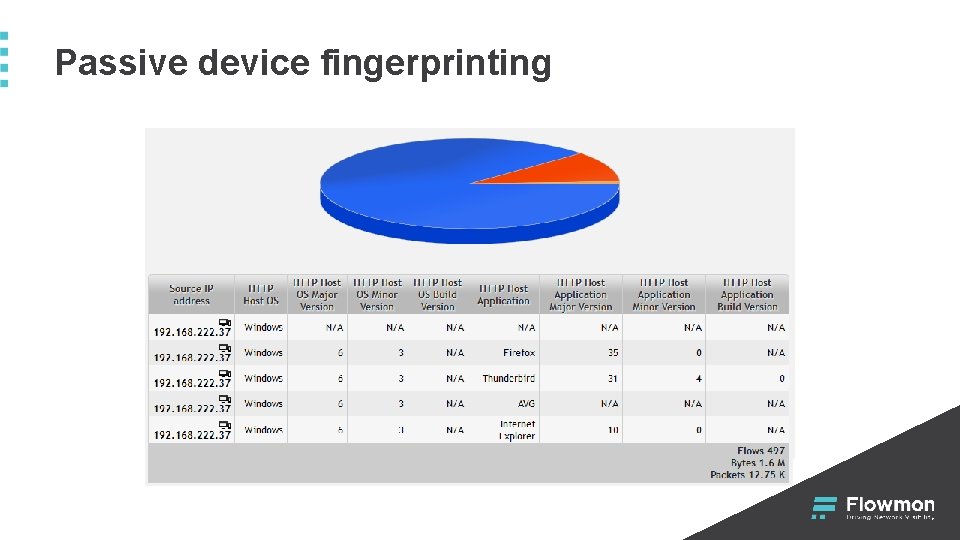
Passive device fingerprinting
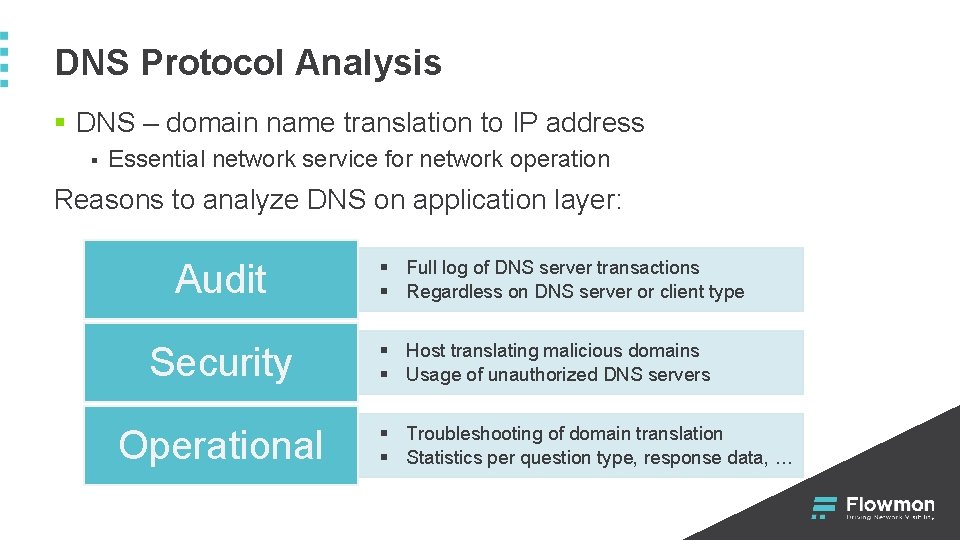
DNS Protocol Analysis § DNS – domain name translation to IP address § Essential network service for network operation Reasons to analyze DNS on application layer: Audit Security Operational § Full log of DNS server transactions § Regardless on DNS server or client type § Host translating malicious domains § Usage of unauthorized DNS servers § Troubleshooting of domain translation § Statistics per question type, response data, …
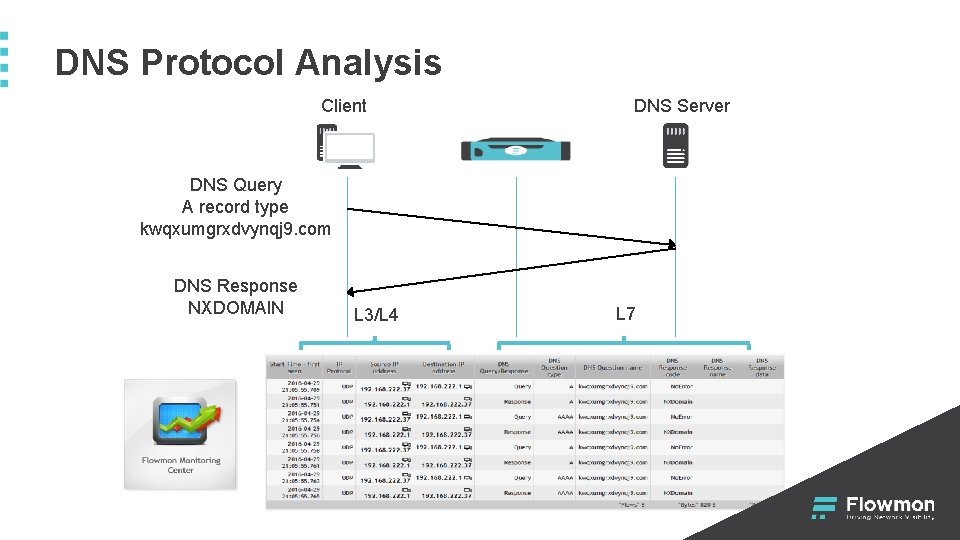
DNS Protocol Analysis Client DNS Server DNS Query A record type kwqxumgrxdvynqj 9. com DNS Response NXDOMAIN L 3/L 4 L 7
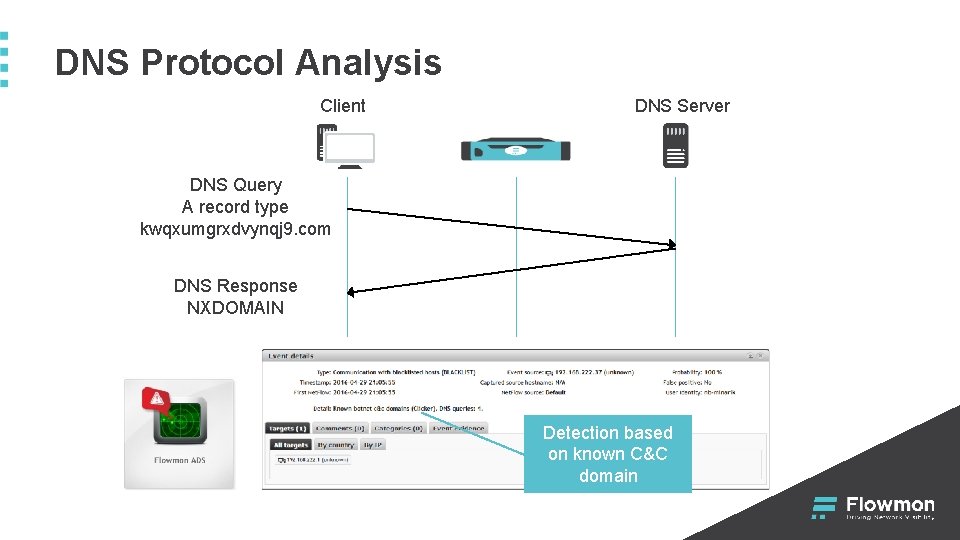
DNS Protocol Analysis Client DNS Server DNS Query A record type kwqxumgrxdvynqj 9. com DNS Response NXDOMAIN Detection based on known C&C domain
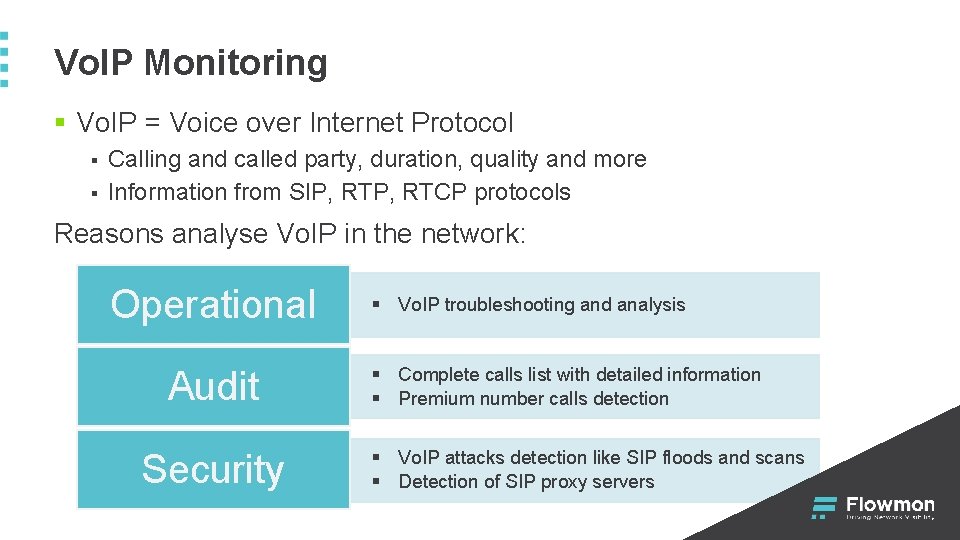
Vo. IP Monitoring § Vo. IP = Voice over Internet Protocol § § Calling and called party, duration, quality and more Information from SIP, RTCP protocols Reasons analyse Vo. IP in the network: Operational Audit Security § Vo. IP troubleshooting and analysis § Complete calls list with detailed information § Premium number calls detection § Vo. IP attacks detection like SIP floods and scans § Detection of SIP proxy servers
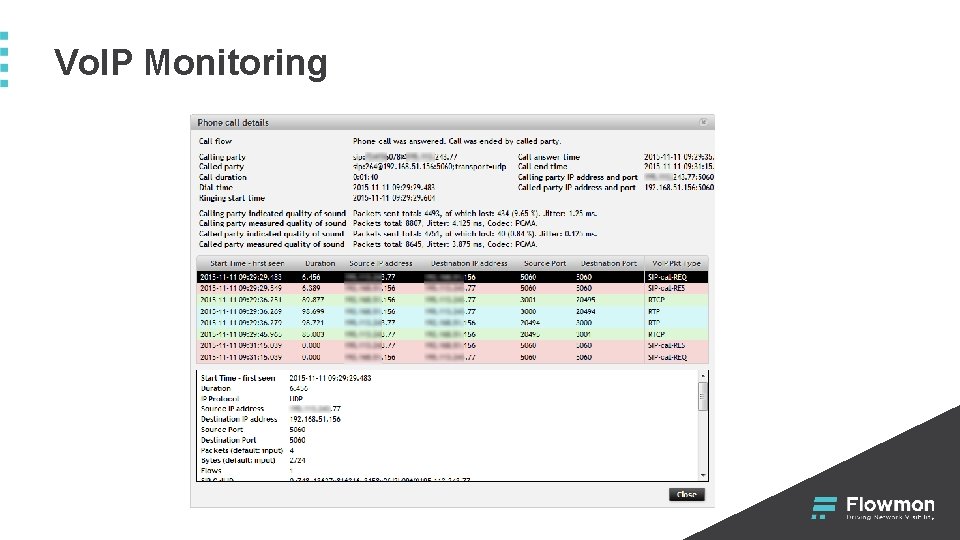
Vo. IP Monitoring
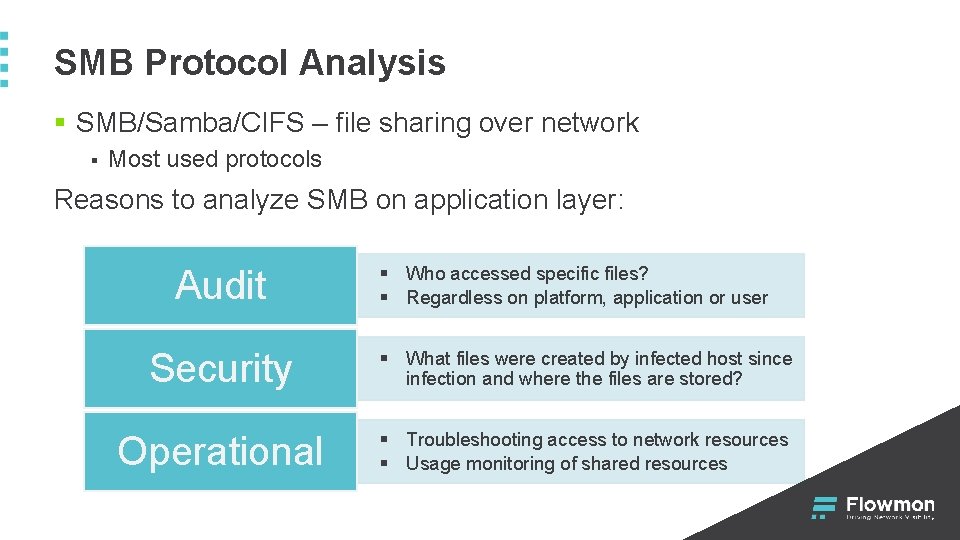
SMB Protocol Analysis § SMB/Samba/CIFS – file sharing over network § Most used protocols Reasons to analyze SMB on application layer: Audit § Who accessed specific files? § Regardless on platform, application or user Security § What files were created by infected host since infection and where the files are stored? Operational § Troubleshooting access to network resources § Usage monitoring of shared resources
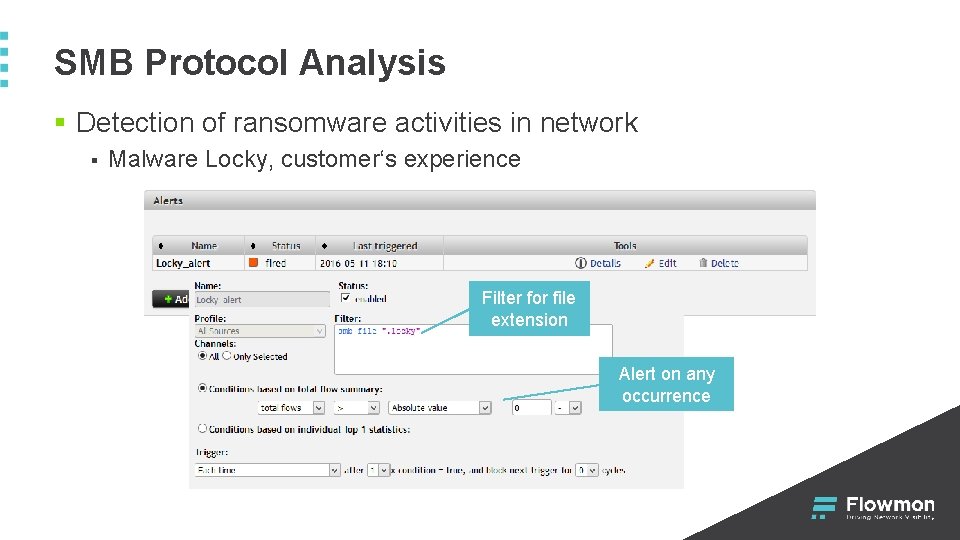
SMB Protocol Analysis § Detection of ransomware activities in network § Malware Locky, customer‘s experience Filter for file extension Alert on any occurrence
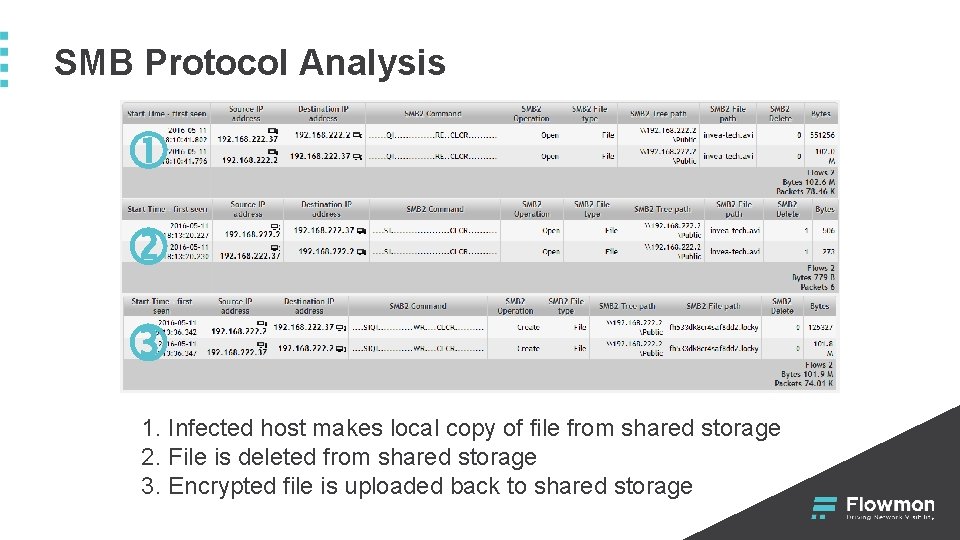
SMB Protocol Analysis 1. Infected host makes local copy of file from shared storage 2. File is deleted from shared storage 3. Encrypted file is uploaded back to shared storage
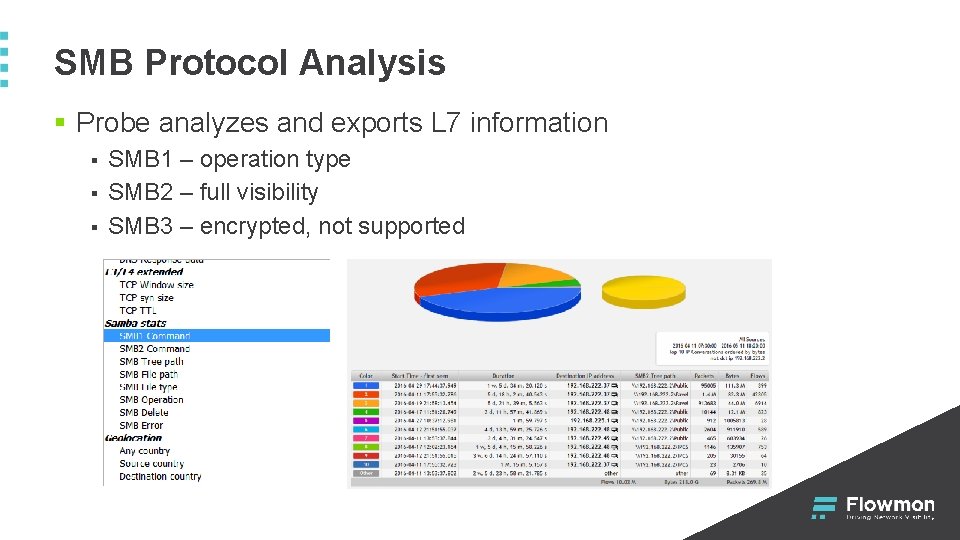
SMB Protocol Analysis § Probe analyzes and exports L 7 information § § § SMB 1 – operation type SMB 2 – full visibility SMB 3 – encrypted, not supported
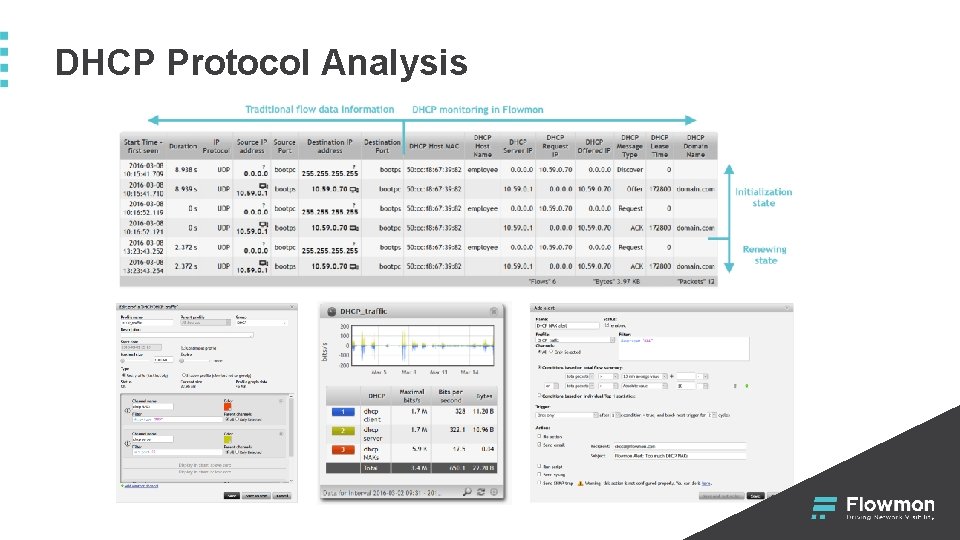
DHCP Protocol Analysis § DHCP – dynamic IP addresses allocation § Essential network service for network operation Reasons to analyze DHCP on application layer: Audit § Full log of allocated IP addresses in the network § Regardless on DHCP server type or clients Security § Unauthorized DHCP servers § Spoofed addresses and network configurations Operational § Troubleshooting and analysis of DHCP server § Analysis of IP address allocation using DHCP relay
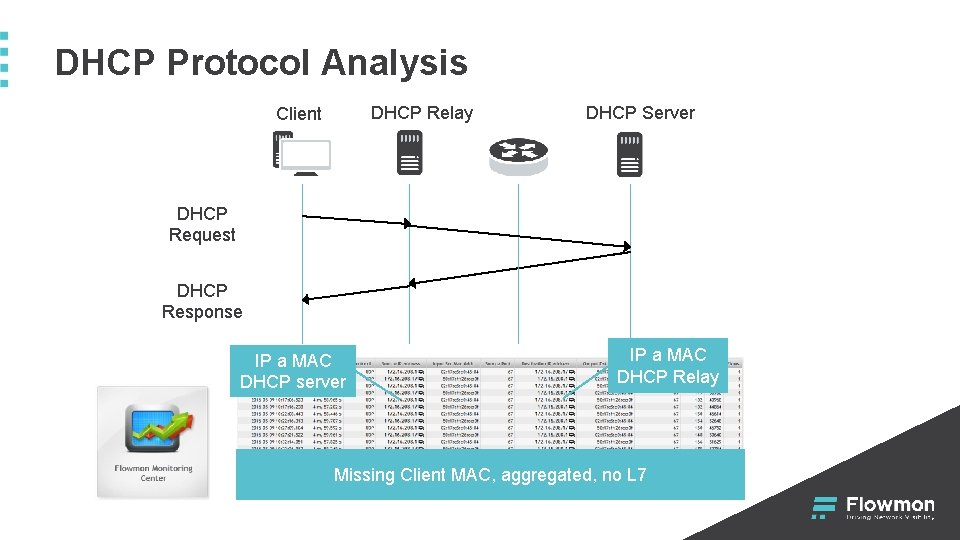
DHCP Protocol Analysis DHCP Relay Client DHCP Server DHCP Request DHCP Response IP a MAC DHCP server IP a MAC DHCP Relay Missing Client MAC, aggregated, no L 7
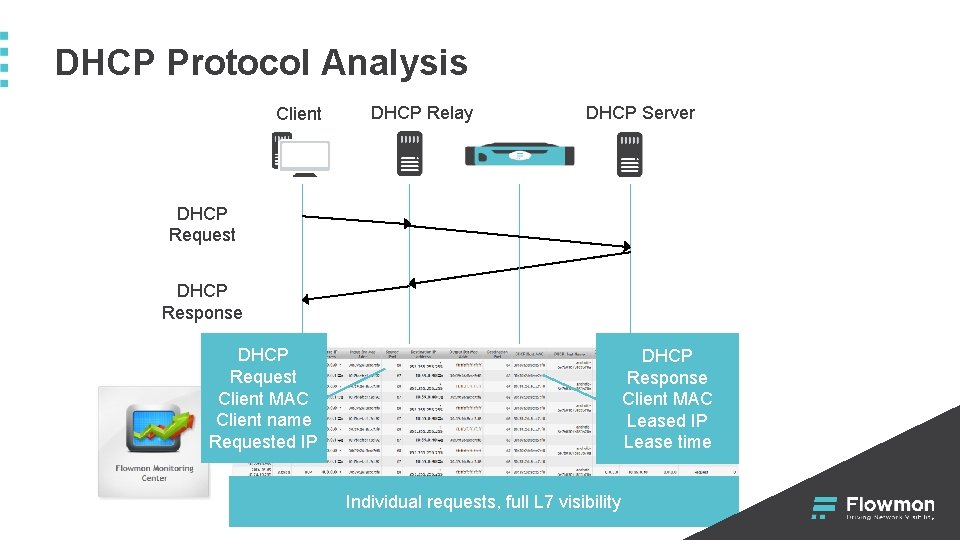
DHCP Protocol Analysis Client DHCP Relay DHCP Server DHCP Request DHCP Response DHCP Request Client MAC Client name Requested IP DHCP Response Client MAC Leased IP Lease time Individual requests, full L 7 visibility
DHCP Protocol Analysis
NAT Detection § NAT = Network Address Translation § § More devices hidden behind one IP address Detection is based on L 3/L 4 information and extended with HTTP information exported by Flowmon Probe Reasons to detect NATs in the network: Security § Connecting unauthorized devices to the networks § Network usage in contrary to the security politics Billing § Reselling Internet connection (ISP) § Network usage in contrary to the terms of service
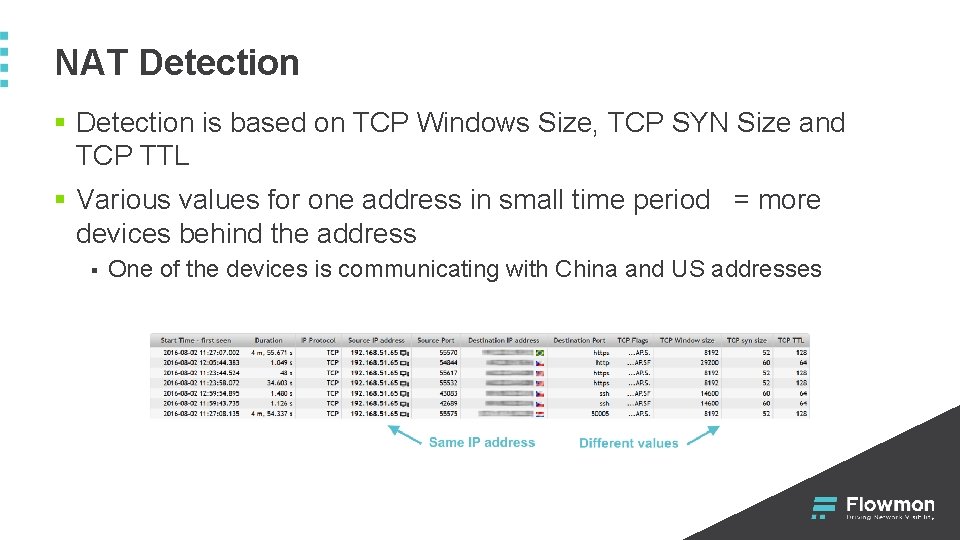
NAT Detection § Detection is based on TCP Windows Size, TCP SYN Size and TCP TTL § Various values for one address in small time period = more devices behind the address § One of the devices is communicating with China and US addresses
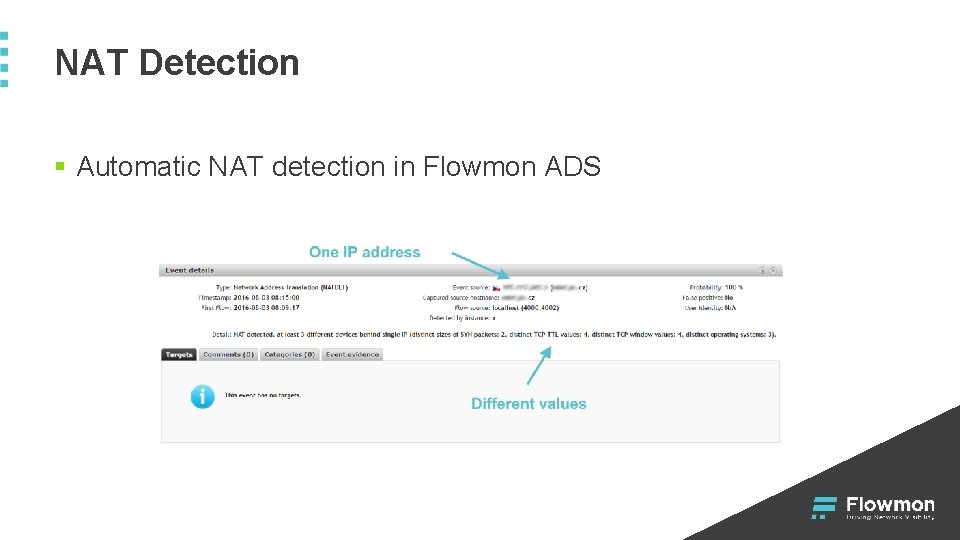
NAT Detection § Automatic NAT detection in Flowmon ADS
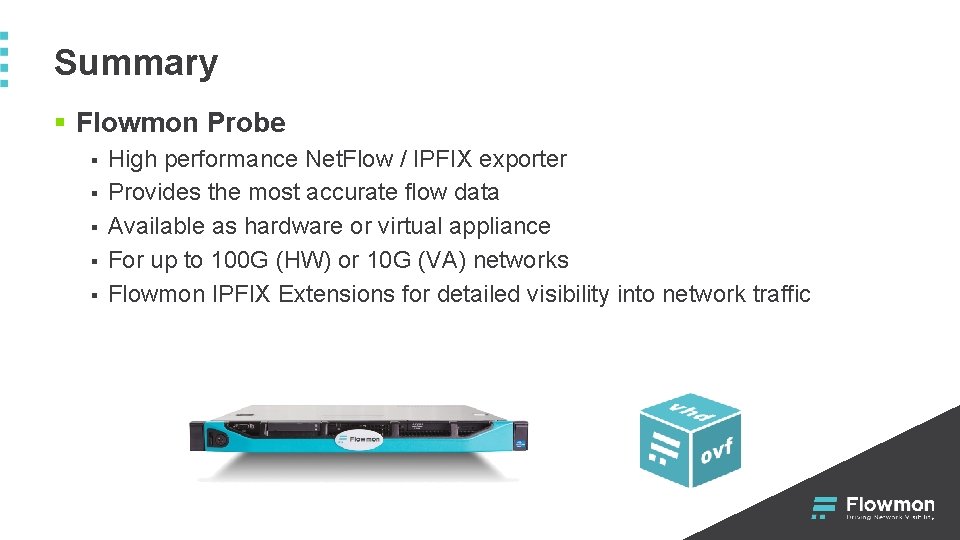
Summary § Flowmon Probe § § § High performance Net. Flow / IPFIX exporter Provides the most accurate flow data Available as hardware or virtual appliance For up to 100 G (HW) or 10 G (VA) networks Flowmon IPFIX Extensions for detailed visibility into network traffic

Thank you Performance monitoring, visibility and security with a single solution Flowmon Networks a. s. Sochorova 3232/34 616 00 Brno, Czech Republic www. flowmon. com
- Slides: 45