Flowcharts Training Session w Overview w Detailed look


 w Education n n Curriculum flowcharts Student flow through process w")


 4. Studio 1151 Guidebook by Karen Mc. Nally and Alan")
 Books: n 7. Managing Quality: An Integrative Approach. S. Thomas Foster.")
- Slides: 21
Flowcharts: Training Session w Overview w Detailed look at flowcharting w Real world examples
Overview of Flowcharts • What is a flowchart? • How are they useful?
What is a flowchart? w A. k. a. Process Flow Diagram w A diagram illustrating the activities of a process w One of Ishikawa’s seven basic tools of quality
Brief History w No originator, or “father” of flowcharts w Forms of flowcharts have always been used w Give us insight into historical processes
Flowchart Symbols
Basic Flowchart
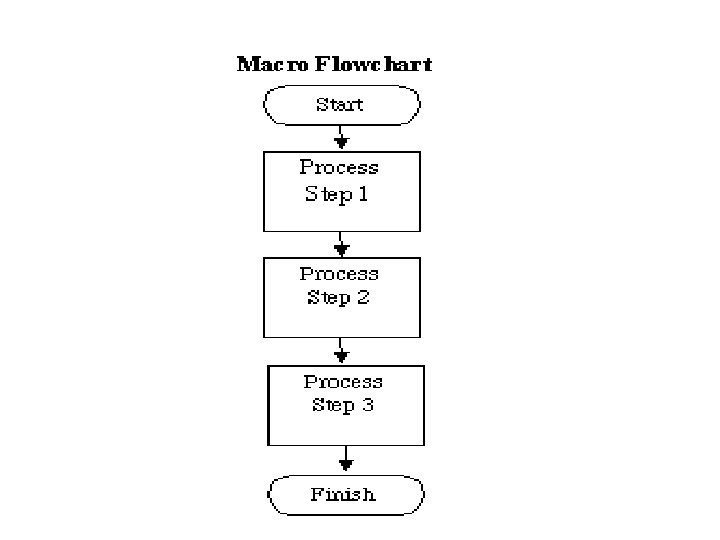
Types of Flowcharts § Macro Flowcharts § Deployment Flowchart
Macro Flowcharts • High level perspective • Steps in a process connected by a flow line • Identifies problems in the process
Deployment Flowcharts § § § Much more detailed Assign the steps to the person who performed them Shows how members of the project team are deployed, or used throughout the project.
Overview of Flowcharts • What is a flowchart? • How are they useful?
How are they useful? w Create visual maps of a process w Help with planning a project w Quality improvement tool n n n Identify processes that need improvement Identify unnecessary/ problem steps in a process Good communication tool
Common Rules of Flowcharts w Indicate and label all elements of the project w Sequence of events is clear w No gaps or dead ends w Must be logical to the user w Use correct symbols
Perspectives of Flowcharts w Producer w Service provider w Customer
Real World Use of Flowcharts w Production n n Manufacturing Used to identify critical path w Accounting n Help visualize money flow w Services n n Restaurants Real estate
Real World (cont’d) w Education n n Curriculum flowcharts Student flow through process w Hospitals n n Patient flow Medical processes
Class Exercise w Develop a flowchart for the process of conducting research w Base this flowchart on the actual process that you used for this project w Try and identify improvement areas
Summary w Valuable and unique quality improvement tool w Simple and effective way of visualizing and understanding a process w Entire organization has an effect on the flowchart w Everyone involved can take part in improving the process
Sources Used 1. Internet 1. 2. 3. The Clinician’s Black Bag of Quality Improvement Tools: Flowcharts. http: //www. dartmouth. edu/~ogehome/CQI/index. html The Computer Triangle. Robert L. Oakman. University of South Carolina. http: //www. wiley. com/college/busin/icmis/oakman/ho me. htm Flowcharts. This tool copyright University of Brighton. http: //www. dipoli. hut. fi/org/Tech. Net/org/eurocinet/too l 4. html
Sources Used (cont’d. ) 4. Studio 1151 Guidebook by Karen Mc. Nally and Alan Levine. Maricopa Center for Learning and Instruction (MCLI). Maricopa Community College. URL: http: //www. mcli. dist. maricopa. edu/authoring/stu dio/guidebook/flow. html 5. Learning Team. Flow. Last Update: November 19, 1999. URL: http: //www. teamflow. com/tuttv 01. html 6. Quality Controll Tools: Flowcharts URL: http: //deming. eng. clemson. edu/pub/tutorials/qctools/flo wm. htm
Sources Used (cont’d) Books: n 7. Managing Quality: An Integrative Approach. S. Thomas Foster. Copyright 2001 by Prentice-Hall, Inc.