Flow Cytometry Lab Wintrobe Bldg Rm 221 https

Flow Cytometry ****Lab= Wintrobe Bldg Rm 221**** https: //utahflowcytometry. wordpress. com/presentations/ James Marvin Director, Flow Cytometry Core Facility University of Utah Health Sciences Center Office 801 -585 -7382 Lab 801 -581 -8641 jmarvin@cores. utah. edu

Flow Cytometry Overview Fluorescently labelled antibody

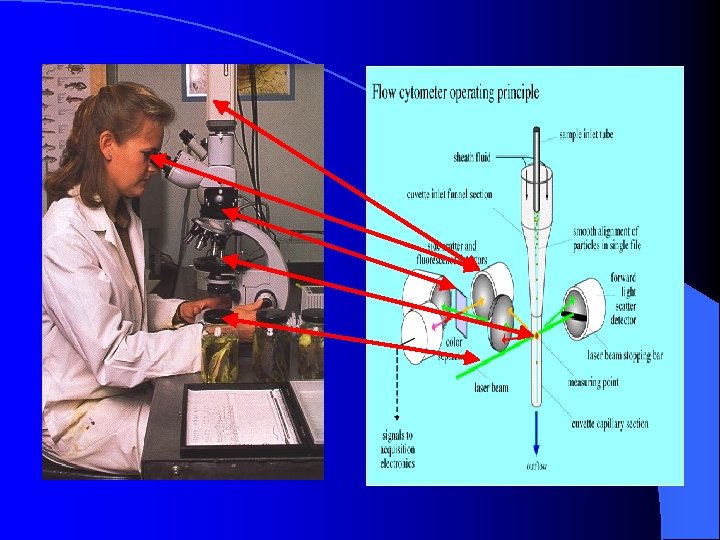
What Happens in a Flow Cytometer? Fluidics Interpretation Fluidics Interrogation Electronics Interpretation Measuring both intrinsic and extrinsic properties of cells while in a moving fluid stream

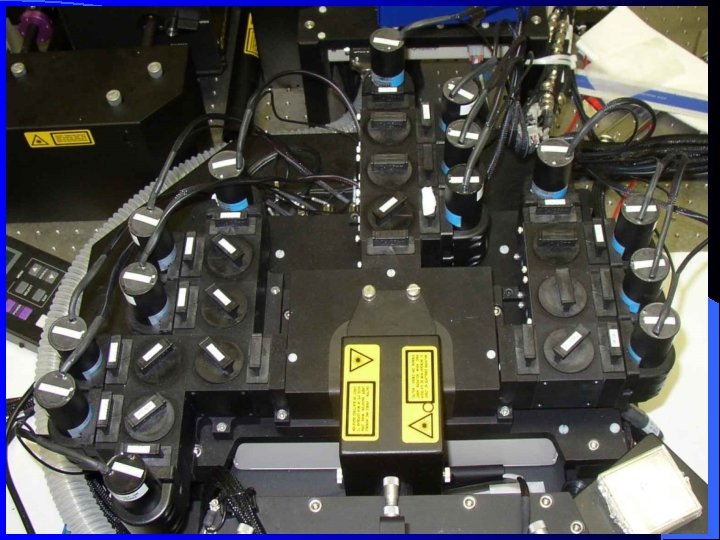
What does a Flow Cytometer look like?


What does Flow Cytometry Data look like?

What can a Flow Cytometer Do? Immunophenotyping / Intracellular antigens measurement DNA/RNA: cell cycle, aneuploidy, endoreduplication, kinetics DNA base ratios Chromatin structure Apoptosis Membrane potential Membrane fluidity Membrane fusion/turnover Intracellular calcium (ions) flux Intracellular p. H Sulfhydryl groups/glutathione Cell viability Cell tracking and proliferation Intracellular reactive oxygen species (Oxidative burst) Cell proliferation Cell enumeration Cell volume and morphological complexity Cell pigments (f. ex. chlorophyll or phycoerythrin) Drug delivery Multidrug resistance (MDR) Phagocytosis Pathogen-host cell adherence Differentiation Identification of “stem cells” Reticulocyte, platelet etc analysis Microparticles analysis Assessing infection/transfection levels Monitoring of the electropermeabilization of cells Cytotoxicity assay Enzymatic activity Cell activation Protein-protein interactions (FRET, split-GFP) Protein modifications, phospho-proteins Activation of signalling pathways Cytokine Secretion Sorting Karyotyping Telomere length (DNA degradation, mitochondrial membrane potential, permeability changes, caspase activity) The uses of flow in research has boomed since the mid-1980 s, and is now the gold standard for a variety of applications

Flow Cytometry Advancements Although the technology is essentially the same, the complexity of assays has dramatically increased 1 or 2 color analysis Computational analysis of 30+ colors in a single tube 1990 2019

Section I Background Information on Flow Cytometry

Many components to a successful assay Experimental Design “One on One” Instrumentation Analysis Presentation “Flow Basics” “Data Analysis” • Sample Procurement • Appropriate Lasers • Sample preparation • Appropriate Filters • Fix/Perm • Which Fluorophore • Instrument Settings • Lin vs Log • Controls • Time • Isotype? • A, W, H • Single color • Doublet • FMO discrimination • Interpretation • Mean, Median • % + • CV • SD • Signal/Noise • Gating • Histogram • Dot Plot • Density Plot • Overlay • Bar Graph

Cytometry vs. Flow Cytometry/Microscopy • Localization of antigen is possible • Poor enumeration of cell subtypes • Limiting number of simultaneous measurements Flow Cytometry. • No ability to determine localization (traditional flow cytometer) • Can analyze many cells in a short time frame. (30 k/sec) • Can look at numerous parameters at once (>20 parameters)

Imagestream- Flow Cytometry Plus Localization • The CCD camera operates in TDI (time delay integration) mode that electronically tracks moving objects by moving pixel content from row to row down the rows of pixels in synchrony with the velocity of the object (cell) in flow as measured by the velocity detection system. Aggregate pixel content is collected off the last row of pixels. Imaging in this mode allows for the collection of cell images without streaking and with a high degree of fluorescence sensitivity

Section II The 4 Main Components of a Flow Cytometer

What Happens in a Flow Cytometer? Fluidics Interpretation Fluidics Interrogation Electronics Interrogation Cells in suspension flow single file Electronics Interpretation

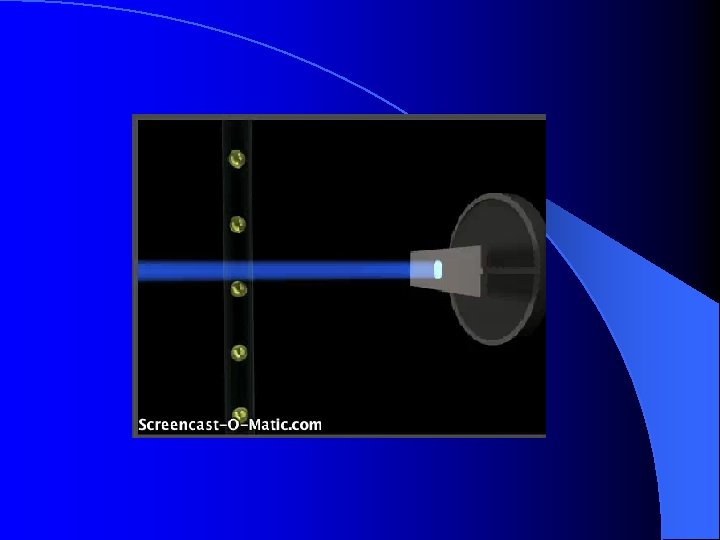
The Fluidics System “Cells in suspension flow single file” Cells must flow one-by-one into the cytometer to do single cell analysis • Accomplished through a hydrodynamically focused pressurized laminar flow system. • The sample is injected into a sheath fluid as it passes through a small orifice (50 um-300 um) •

Hydrodynamic Focusing

Hydrodynamic Focusing Notice how the ink is focused into a tight stream as it is drawn into the tube under laminar flow conditions. PBS/Sheath Sample/cells/core Hydrodynamic Focusing Laminar flow occurs when a fluid flows in parallel layers, with no disruption between the layers V. Kachel, H. Fellner-Feldegg & E. Menke - MLM Chapt. 3
 to transport particles into the center")
Acoustic focusing uses ultrasonic radiation pressure (>2 MHz) to transport particles into the center of the sample stream

Sorting Speeds Up to 30, 000 cells/sec Last attached droplet

Fluidics Recap Purpose is to have cells flow one-by-one past a light source. • Cells are “focused” due to hydrodynamic focusing and laminar flow. • Turbulent flow, caused by clogs or fluidic instability can cause imprecise data •

What Happens in a Flow Cytometer? Fluidics Interpretation Fluidics Interrogation Electronics Interpretation
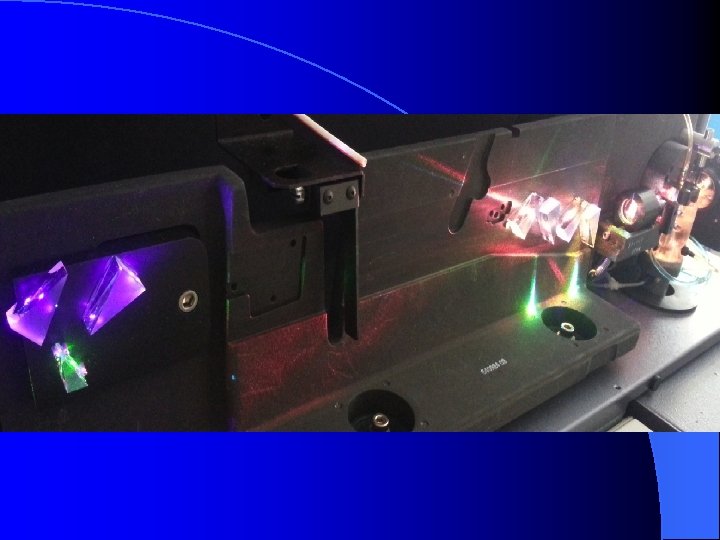

Interrogation • Light source- needs to be focused on the same point where cells are focused • 99%=Lasers • • • Lasers provide a single wavelength of light (monochromatic) They can provide milliwatts to watts of power Low divergence Provide coherent light Gas, dye, or solid state Coherent: all emiting photons have same wavelength, phase and direction as stimulation photons

Light collection Scatter • Collected photons are the product of laser light scattering or bouncing off cells • 488 nm FSC=rough estimate of size SSC=internal complexity/granularity • • • Information associated with physical attributes of cells (size, granularity, refractive index) Fluorescence VS • Collected photons are product of excitation with subsequent emission determined by fluorophore • 350 nm-800 nm • Readout of intrinsic (autofluorescence) or extrinsic fluorescence (intentional cell labeling)

Forward and Side Scatter Laser Beam FSC Detector Collection Lens SSC Detector

Why Look at FSC v. SSC l Since FSC ~ size and SSC ~ internal structure, a correlated measurement between them can allow for differentiation of cell types in a heterogenous cell population Granulocytes Dead Lymphocytes SSC LIVE Monocytes RBCs, Debris, Dead Cells FSC

Fluorescence S 3 Excited higher energy states Energy S 2 fluorochromes on/in the cell (intrinsic or extrinsic) may absorb some of the light and become excited As those fluorochromes leave their excited state, they release energy in the form of a photon with a specific wavelength, longer than the excitation wavelength • S 1 Absorbed exciting light • As the laser interrogates the cell, Emitted fluorescence S 0 Ground State Stokes shift- the difference in wavelength between the excitation and the emission
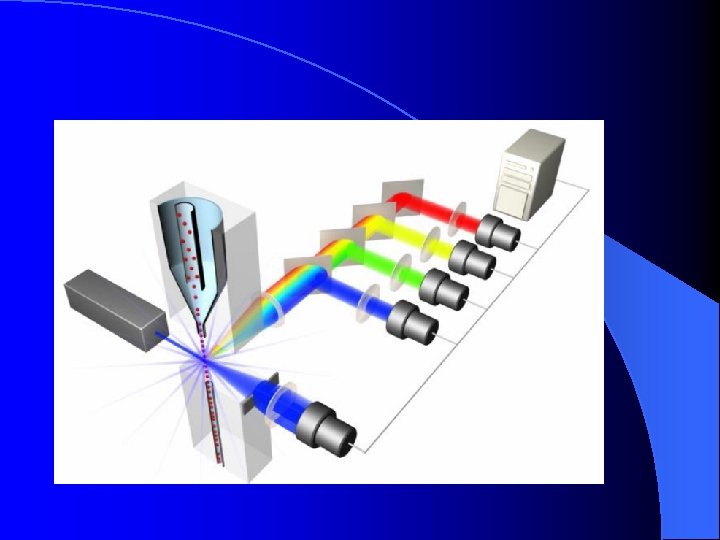

Optical Filters Many wavelengths of light will be emitted from a cell, we need a way to split the light into its specific wavelengths in order to detect them independently. This is done with filters l Optical filters are designed such that they absorb or reflect some wavelengths of light, while transmitting other. l 3 types of filters l Ø Ø Ø Long Pass filter Short Pass filter Band Pass filter

Long Pass Filters l Transmit all wavelengths greater than specified wavelength Ø Example: 500 LP will transmit all wavelengths Transmittance greater than 500 nm 400 nm 500 nm 600 nm 700 nm

Short Pass Filter l Transmits all wavelengths less than specified wavelength Ø Example: 600 SP will transmit all wavelengths Transmittance less than 600 nm. 400 nm 500 nm 600 nm 700 nm Original from Cytomation Training Manual, Modified by James Marvin

Band Pass Filter l Transmits a specific band of wavelengths Ø Example: 550/20 BP Filter will transmit Transmittance wavelengths of light between 540 nm and 560 nm (550/20 = 550+/-10, not 550+/-20) 400 nm 500 nm 600 nm 700 nm

Dichroic Filters Can be a long pass or short pass filter l Depending on the specs of the filter, some of the light is reflected and part of the light is transmitted and continues on. l Detector 1 Detector 2 Dichroic Filter

Spectra of Common Fluorochromes with Typical Filters

Spectral Analyzers

Mass Cytometry or Cy. TOF is a variation of flow cytometry in which antibodies are labeled with heavy metal ion tags rather than fluorochromes and the readout is by time-of-flight mass spectrometry
 interrogates a cell and")
Interrogation Recap • • • A focused light source (laser) interrogates a cell and scatters light That scattered light travels down a channel to a detector FSC ~ size and cell membrane integrity SSC ~ internal cytosolic structure Fluorochromes on/in the cell will become excited by the laser and emit photons These photons travel down channels and are steered and split by dichroic (LP/SP) filters

What Happens in a Flow Cytometer? Fluidics Interpretation Fluidics Interrogation Electronics Interrogation Interpretation

Detectors There are 3 main types of photo detectors used in flow cytometry Ø Photodiodes Ø Used for strong signals, when saturation is a potential problem (eg. FSC detector) Ø Photomultiplier tubes (PMT) Used for detecting small amounts of fluorescence emitted from fluorochromes. Ø Incredible Gain (amplification-up to 100 million times) Ø Low noise Ø Ø Avalanche Photodiodes Better red sensitivity Ø Cheaper Ø Better linearity Ø

Photons -> Photoelectrons -> Electrons Photoelectric Effect Einstein- Nobel Prize 1921 A photomultiplier tube, useful for light detection of very weak signals, is a photoemissive device in which the absorption of a photon results in the emission of an electron. These detectors work by amplifying the electrons generated by a photocathode exposed to a photon flux.

Photons Voltage l Add cell flash to electronic pulse video
 3. 54 volts 104 1. 23 volts 102")
10 6. 21 volts 103 (Volts) 3. 54 volts 104 1. 23 volts 102 101 0 1 Relative Brightness Analog to Digital Conversion Count The voltage corresponding to each signal is digitized into one of 16, 384 possible levels 10 million times per second by analog-to-digital (A/D) converters.

Electronics Detectors basically collect photons of light and convert them to an electrical current • The “electronics” must process that light signal and convert the current to a digitized value/# that the computer can graph •

Creation of a Histogram • Listmode File 12 9 6 3 0 101 102 103 104 PE

FCS File or List Mode File FSC SSC FITC PE APC-Cy 7

What Happens in a Flow Cytometer? Fluidics Interpretation Fluidics Interrogation Electronics Interpretation

Gating Example

Immunophenotyping Surface or intracellular staining

Signal Transduction

Apoptosis Apoptotic Annexin V FLICA MTR Live PI

Caspase

Cell Cycle

Cell cycle

ro. GFP Redox senstitive biosensor

Ca 2+ Flux Indo-1 Ca 2+ free Emission=500 nm Indo-1 Ca 2+ bound Emission=395 nm

Flow Cytometry ****Lab= Wintrobe Bldg Rm 221**** James Marvin Director, Flow Cytometry Core Facility University of Utah Health Sciences Center Office 801 -585 -7382 Lab 801 -581 -8641 jmarvin@cores. utah. edu
- Slides: 59