Flatford Swamp Hydrologic Restoration Feasibility Study H 089
")
Flatford Swamp Hydrologic Restoration Feasibility Study (H 089)
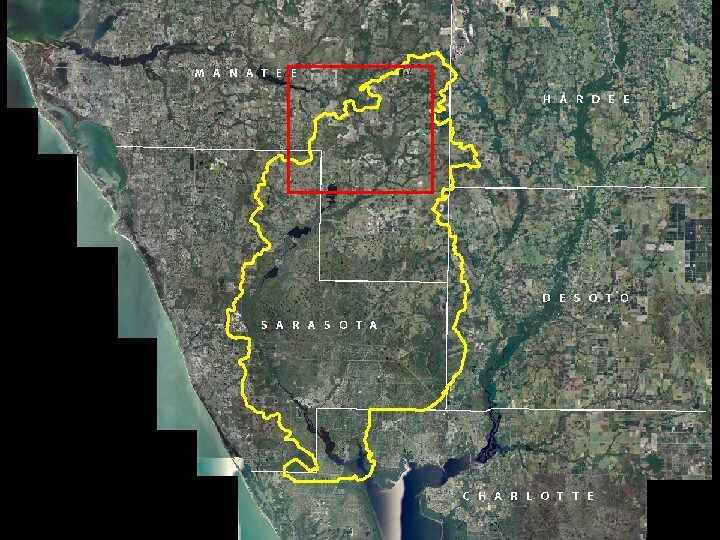

Flatford Swamp

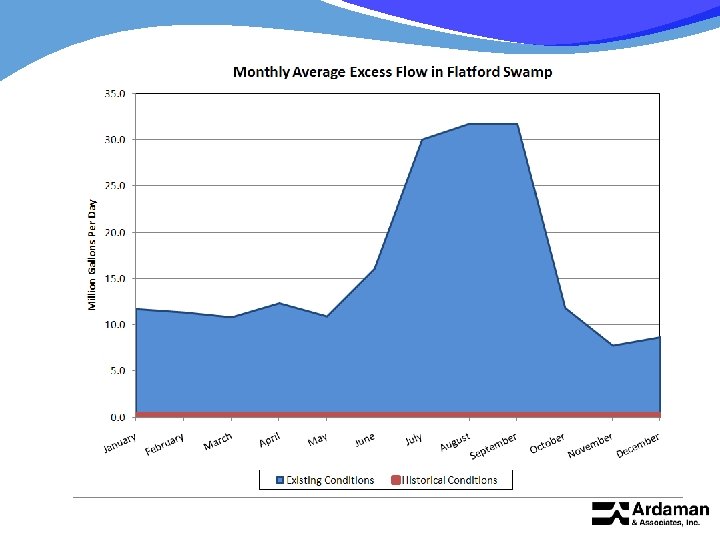
Flatford Hydrologic Restoration • How much excess water? • How to remove it from the swamp? • What to do with it once the flow is removed?

How to Remove Excess Water from the Swamp? 1. Interception of flow
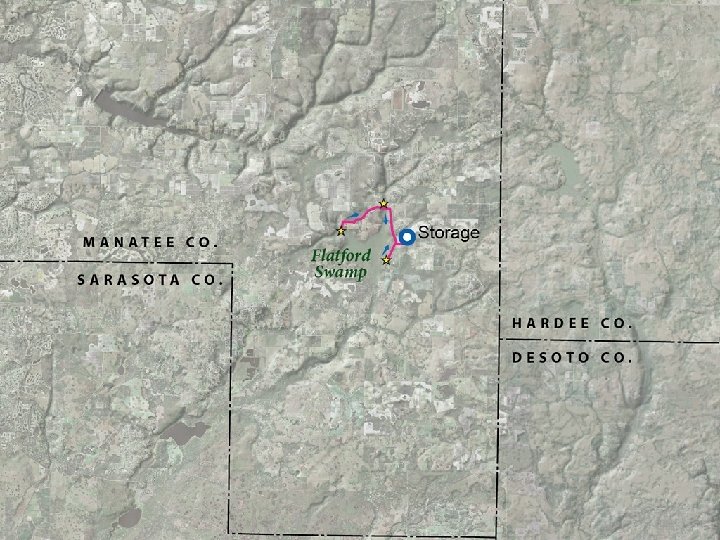

To Manatee County To Mosaic

To Mosaic

Three Areas of Interrelated Activities • Supply Timing and Delivery • Storage Options • Water Quality and Treatment Options

The Project Site B Site A Flatford Swamp

Analysis Method for Timing of Flows and Storage Performance • Simplified Reservoir Routing Model • Daily Inflows, Rainfall and PET o. Provided by Interflow, LLC, 2011 o. Existing Landuse Conditions o. Used Extended Period of Record (16 years) • Model Currently Includes All Parameters Except Seepage o. May Include It Later with Refined Siting Information • Outputs are Daily, Monthly and Annual
 (Data reproduced from")
Existing Land Use Scenario Proposed Removal of Average Excess Flows (cfs) (Data reproduced from Table 3. 1 – November 11, 2011 Interflow report)

Factors Affecting Storage Volume • Variability of Inflows and Delivery Limits • Water Quality and Treatment Requirements • Storage Type and Design Criteria • Operational Considerations

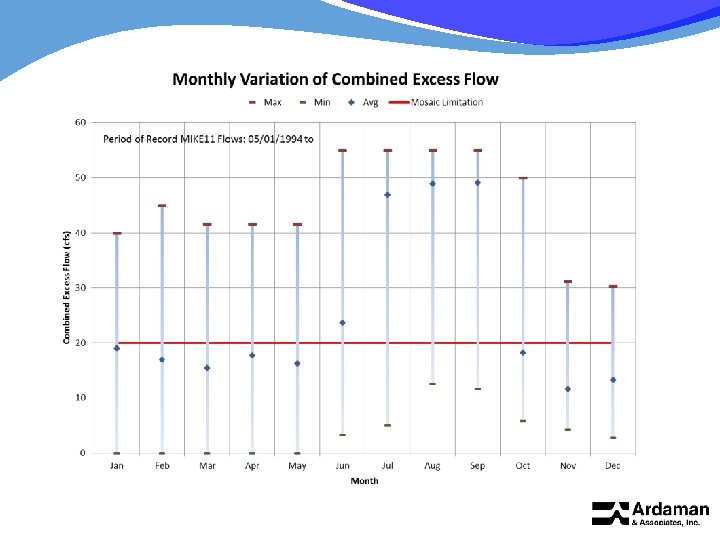
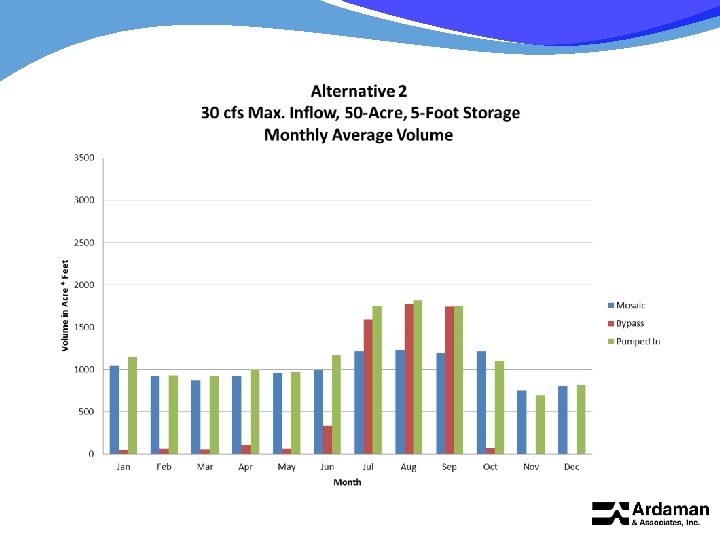
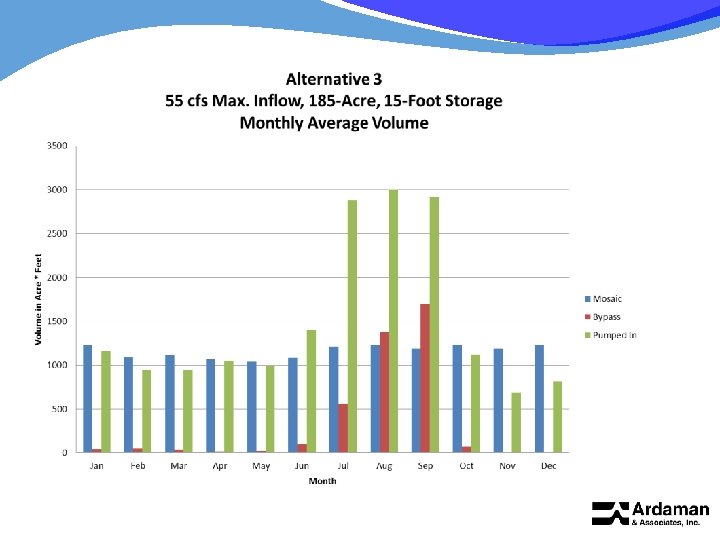
Three Alternatives Investigated • Alternative 1: No Storage • Alternative 2: Excavated Storage • Alternative 3: Elevated Storage • All Accomplish Flatford Swamp Diversion Objectives per MRWI Conceptual Plan • All Evaluations Use 20 cfs Limit on Flows Delivered to Mosaic

Alternative 1 55 cfs Max. Flow, No Storage Monthly Average Volume 3500 3000 Volume in Acre * Feet 2500 2000 Mosaic Bypass 1500 Pumped In 1000 500 0 Jan Feb Mar Apr May Jun Jul Month Aug Sep Oct Nov Dec

Water Quality and Treatment

Water Quality Evaluation • Surface Water Sources • • Coker Creek Ogleby Creek Maple Creek Myakka River
 • Recent SWFWMD")
Water Quality Evaluation • Period of Record (1990 s to 2011) • Recent SWFWMD Data (2009 to 2011) • Samples collected quarterly • Seasonal Variability Evaluation (2008, FDEP Data) • Tributaries to Myakka River • Samples collected monthly
 – Seasonal Variability")
Sulfate (mg/L) – Seasonal Variability
 – Seasonal Variability")
Total Organic Carbon (mg/L) – Seasonal Variability

Water Quality and Treatment • Myakka River Has Better Overall Water Quality Than Tributaries • 2008 FDEP Water Quality Data • Sulfates, conductivity readings– higher in dry season • TOC concentration – lower in dry season • May Develop Water Quality Indicator Based on USGS Conductivity Values • Treatment Technology Exists to Accommodate Seasonal Water Quality Variability

Mosaic Water Quality • Phosphate Beneficiation Process is Affected by Elevated Levels of Calcium and Magnesium

Future Project Tasks • Alternative Refinements and Costs • Regulatory Review • Final Report Due December 2012

Questions?
- Slides: 28