Fixing Memory Leaks in Android Applications using DDMS



- Slides: 32

Fixing Memory Leaks in Android Applications using DDMS & MAT Presented by Sravankumar Reddy Javaji CS 286 Mobile Programming

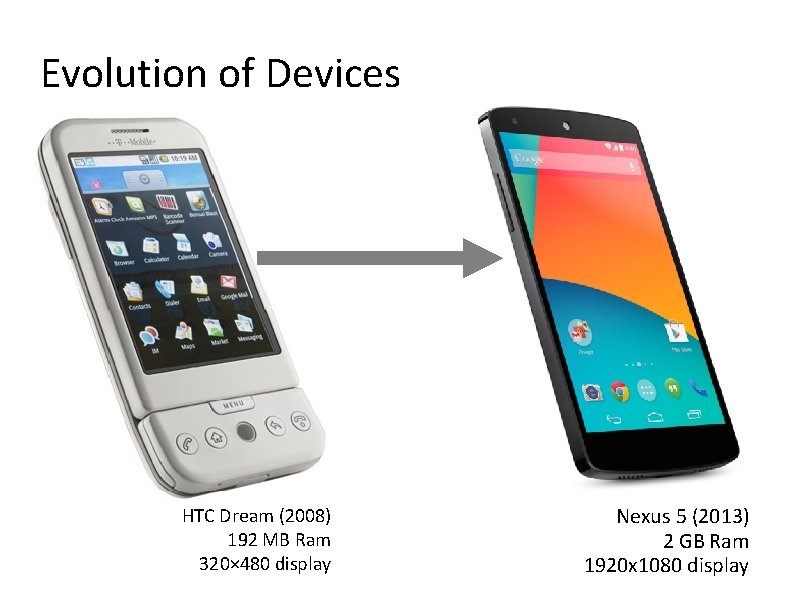
Evolution of Devices HTC Dream (2008) 192 MB Ram 320× 480 display Nexus 5 (2013) 2 GB Ram 1920 x 1080 display

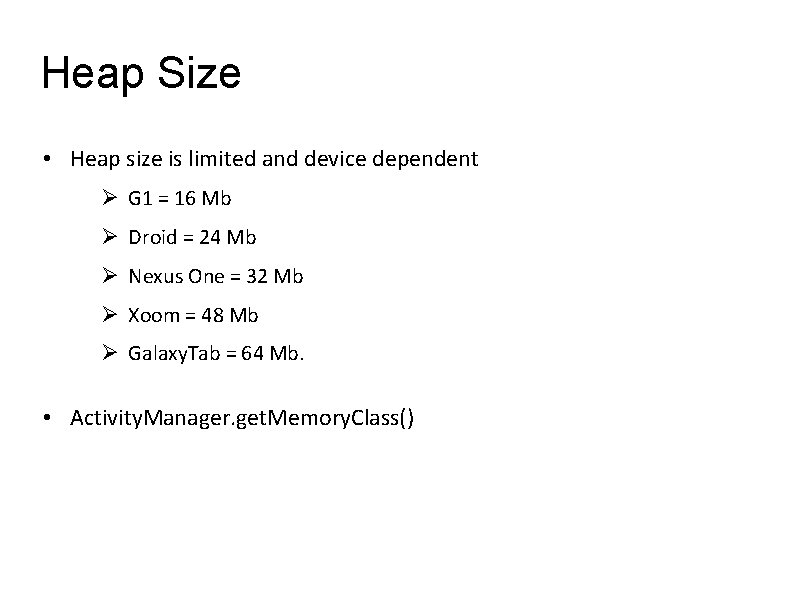
Heap Size • Heap size is limited and device dependent G 1 = 16 Mb Droid = 24 Mb Nexus One = 32 Mb Xoom = 48 Mb Galaxy. Tab = 64 Mb. • Activity. Manager. get. Memory. Class()

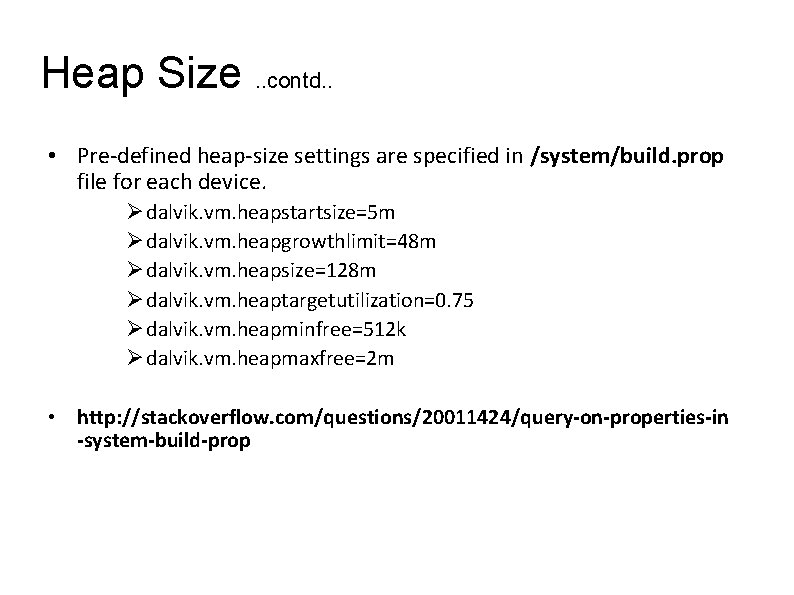
Heap Size. . contd. . • Pre-defined heap-size settings are specified in /system/build. prop file for each device. dalvik. vm. heapstartsize=5 m dalvik. vm. heapgrowthlimit=48 m dalvik. vm. heapsize=128 m dalvik. vm. heaptargetutilization=0. 75 dalvik. vm. heapminfree=512 k dalvik. vm. heapmaxfree=2 m • http: //stackoverflow. com/questions/20011424/query-on-properties-in -system-build-prop

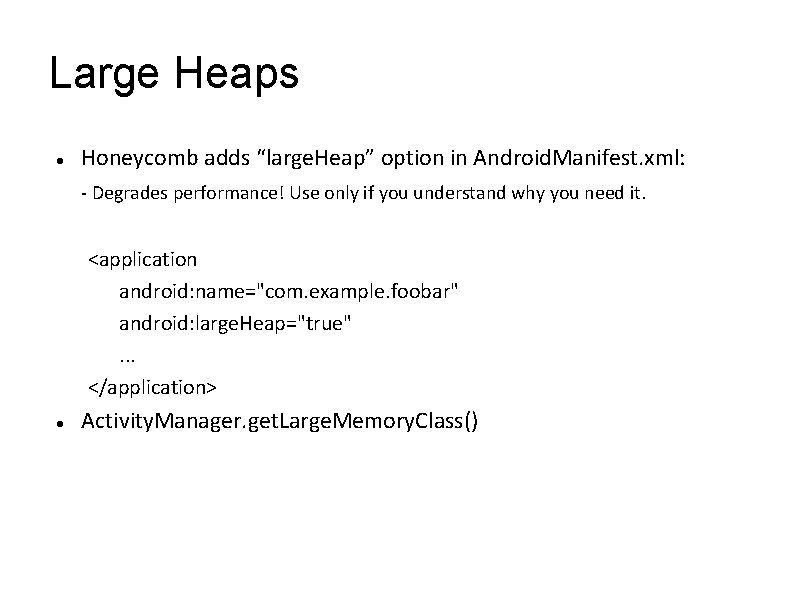
Large Heaps Honeycomb adds “large. Heap” option in Android. Manifest. xml: - Degrades performance! Use only if you understand why you need it. <application android: name="com. example. foobar" android: large. Heap="true". . . </application> Activity. Manager. get. Large. Memory. Class()

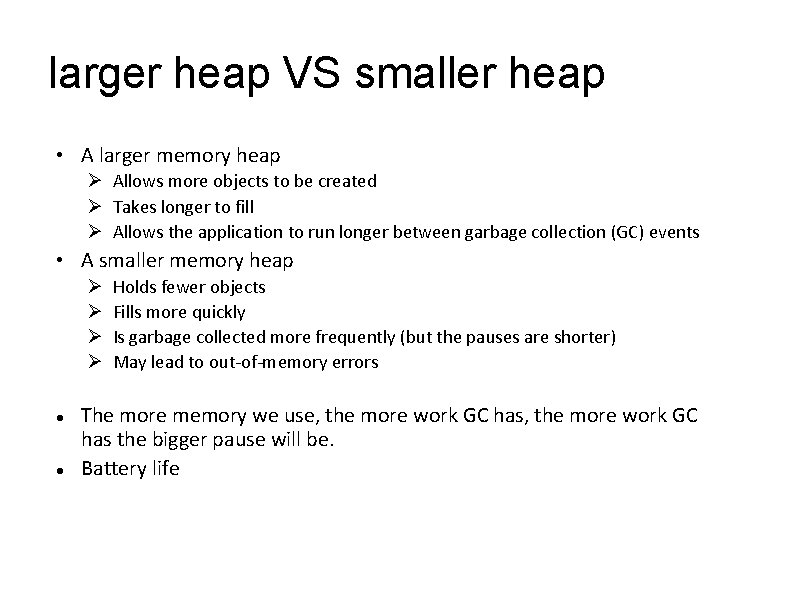
larger heap VS smaller heap • A larger memory heap Allows more objects to be created Takes longer to fill Allows the application to run longer between garbage collection (GC) events • A smaller memory heap Holds fewer objects Fills more quickly Is garbage collected more frequently (but the pauses are shorter) May lead to out-of-memory errors The more memory we use, the more work GC has the bigger pause will be. Battery life

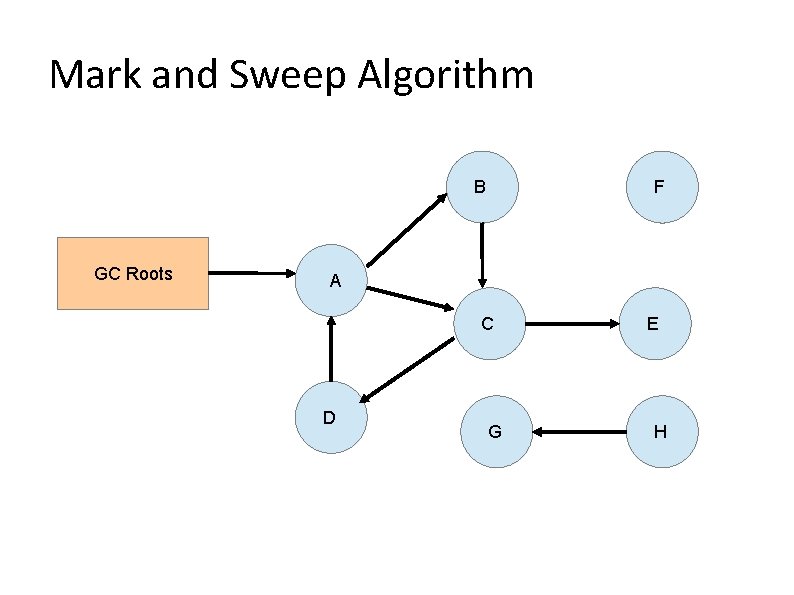
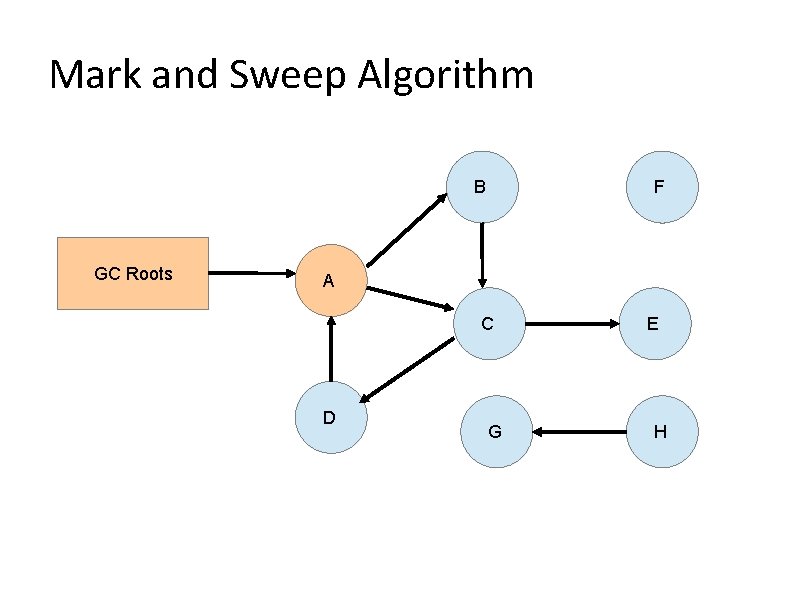
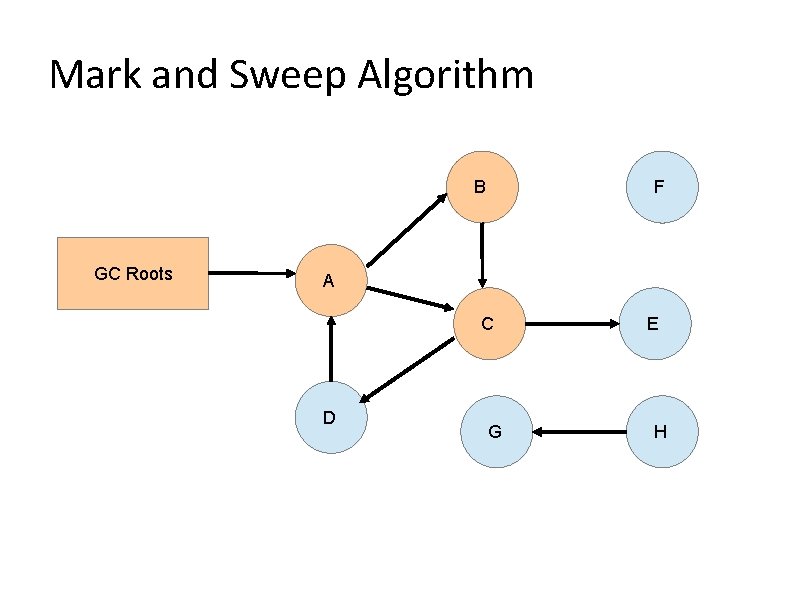
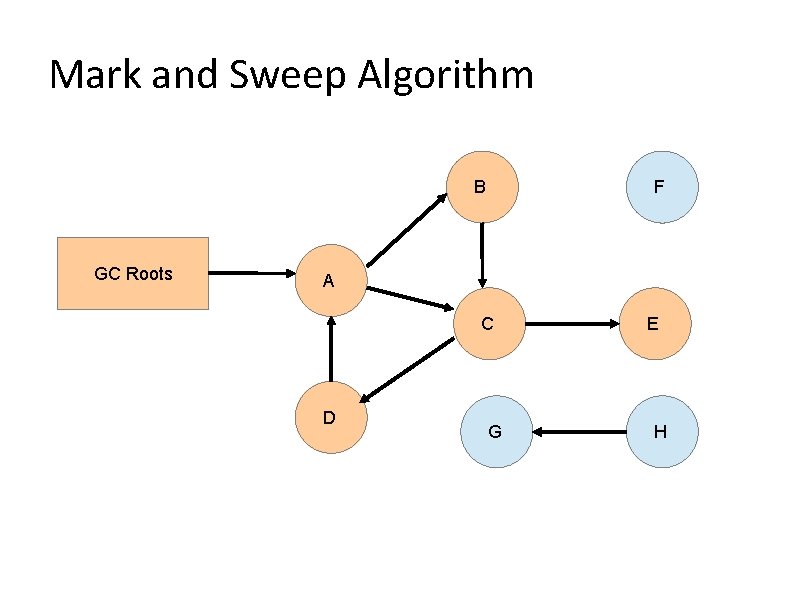
Garbage Collection • Finding out when the Garbage Collection is run? - Search for 'GC' or 'gc' in Log. Cat • How to trigger the Garbage Collection manually? - System. gc(); • Mark and sweep is one of the earliest and best-known garbage collection algorithms.

Mark and Sweep Algorithm B GC Roots F A C D G E H

Mark and Sweep Algorithm B GC Roots F A C D G E H

Mark and Sweep Algorithm B GC Roots F A C D G E H

Mark and Sweep Algorithm B GC Roots F A C D G E H

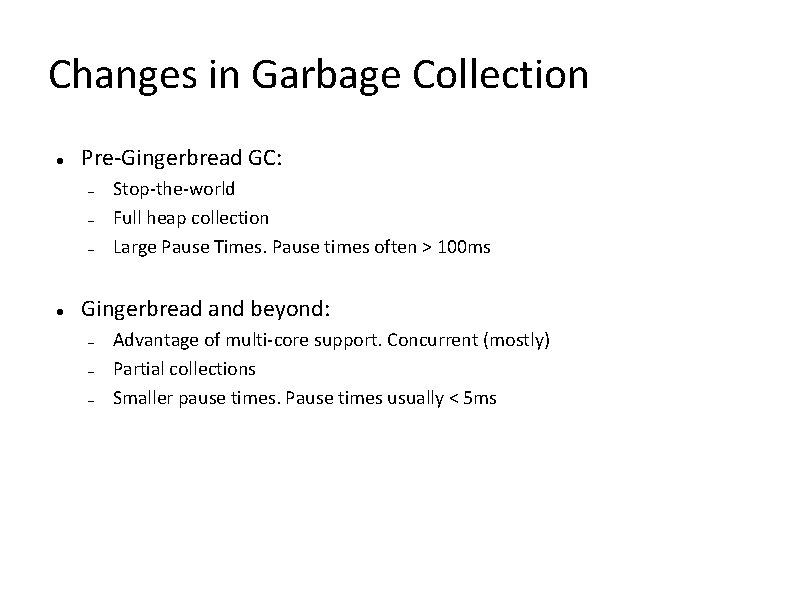
Changes in Garbage Collection Pre-Gingerbread GC: – – – Stop-the-world Full heap collection Large Pause Times. Pause times often > 100 ms Gingerbread and beyond: – – – Advantage of multi-core support. Concurrent (mostly) Partial collections Smaller pause times. Pause times usually < 5 ms

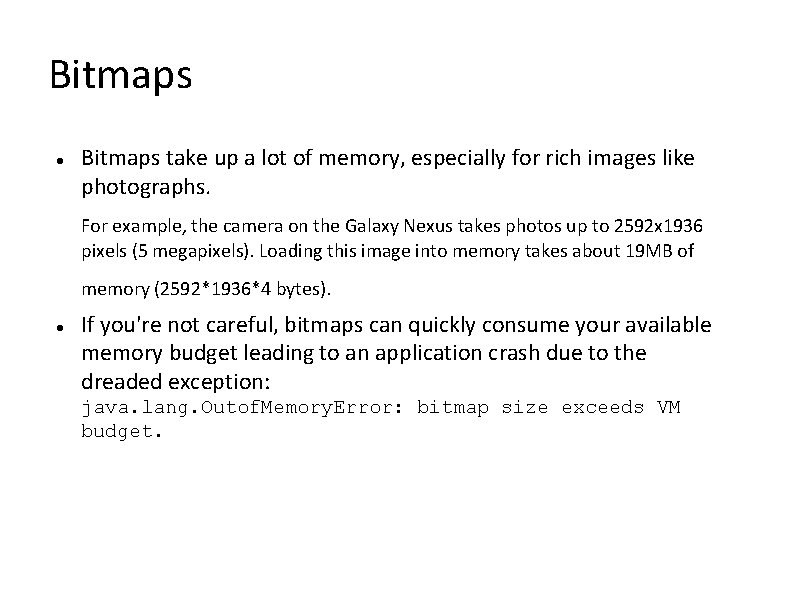
Bitmaps take up a lot of memory, especially for rich images like photographs. For example, the camera on the Galaxy Nexus takes photos up to 2592 x 1936 pixels (5 megapixels). Loading this image into memory takes about 19 MB of memory (2592*1936*4 bytes). If you're not careful, bitmaps can quickly consume your available memory budget leading to an application crash due to the dreaded exception: java. lang. Outof. Memory. Error: bitmap size exceeds VM budget.

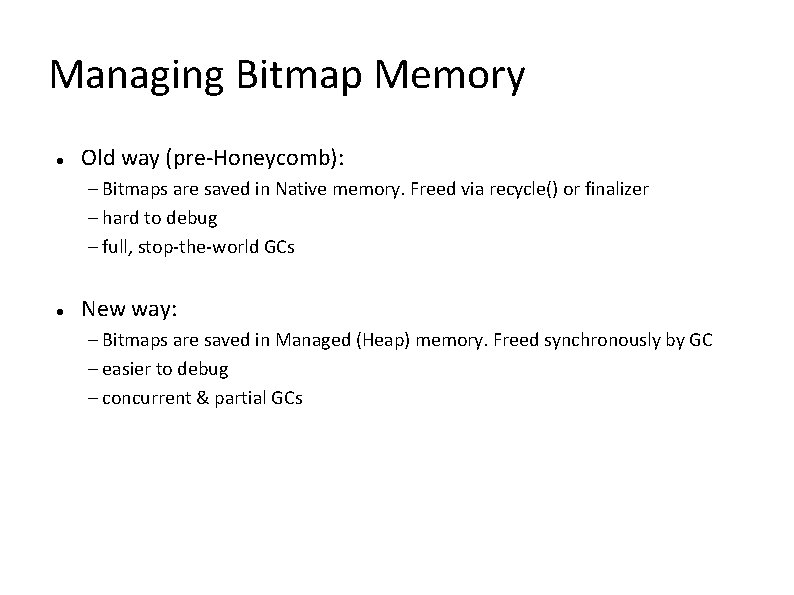
Managing Bitmap Memory Old way (pre-Honeycomb): – Bitmaps are saved in Native memory. Freed via recycle() or finalizer – hard to debug – full, stop-the-world GCs New way: – Bitmaps are saved in Managed (Heap) memory. Freed synchronously by GC – easier to debug – concurrent & partial GCs

Understanding heap usage – DDMS (Dalvik Debug Monitor Server) – Eclipse Memory Analyzer (MAT)

Debugging a memory leak Let's walk through an example using the Honeycomb Gallery sample app from the Android SDK. We're going to deliberately add a memory leak to this app in order to demonstrate how it could be debugged. Lets implement a cache in this app which holds recently-viewed images by making a few small changes to Content. Fragment. java.

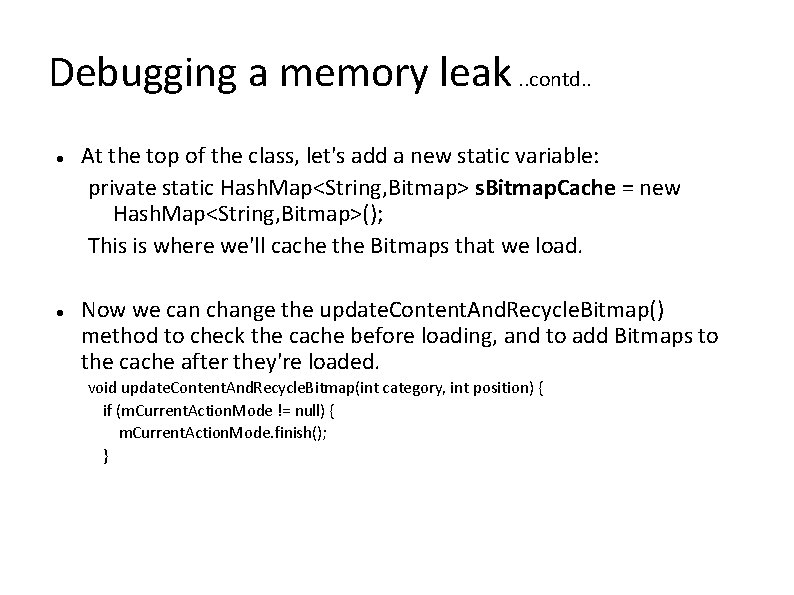
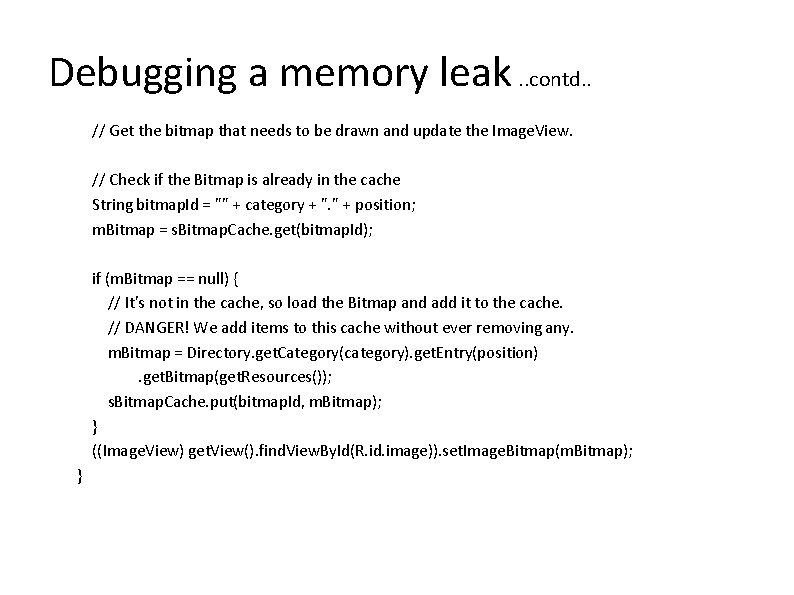
Debugging a memory leak. . contd. . At the top of the class, let's add a new static variable: private static Hash. Map<String, Bitmap> s. Bitmap. Cache = new Hash. Map<String, Bitmap>(); This is where we'll cache the Bitmaps that we load. Now we can change the update. Content. And. Recycle. Bitmap() method to check the cache before loading, and to add Bitmaps to the cache after they're loaded. void update. Content. And. Recycle. Bitmap(int category, int position) { if (m. Current. Action. Mode != null) { m. Current. Action. Mode. finish(); }

Debugging a memory leak. . contd. . // Get the bitmap that needs to be drawn and update the Image. View. // Check if the Bitmap is already in the cache String bitmap. Id = "" + category + ". " + position; m. Bitmap = s. Bitmap. Cache. get(bitmap. Id); if (m. Bitmap == null) { // It's not in the cache, so load the Bitmap and add it to the cache. // DANGER! We add items to this cache without ever removing any. m. Bitmap = Directory. get. Category(category). get. Entry(position). get. Bitmap(get. Resources()); s. Bitmap. Cache. put(bitmap. Id, m. Bitmap); } ((Image. View) get. View(). find. View. By. Id(R. id. image)). set. Image. Bitmap(m. Bitmap); }

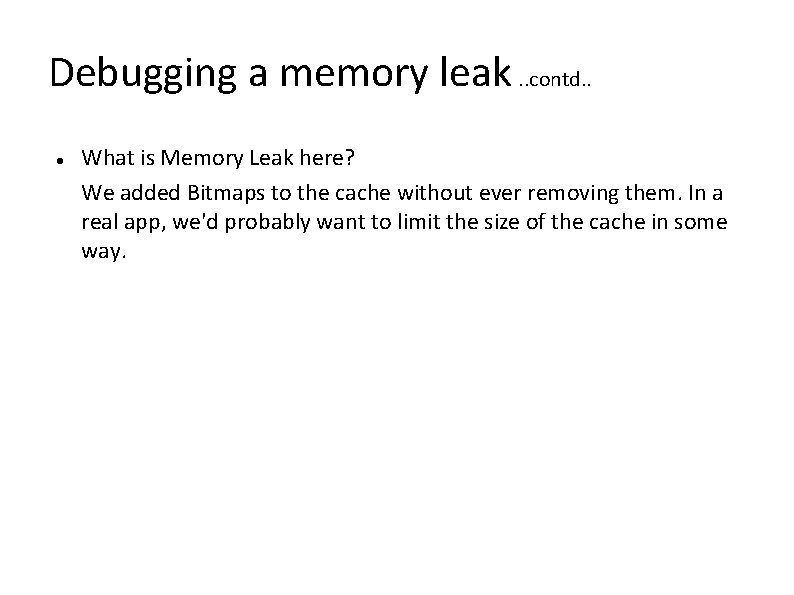
Debugging a memory leak. . contd. . What is Memory Leak here? We added Bitmaps to the cache without ever removing them. In a real app, we'd probably want to limit the size of the cache in some way.

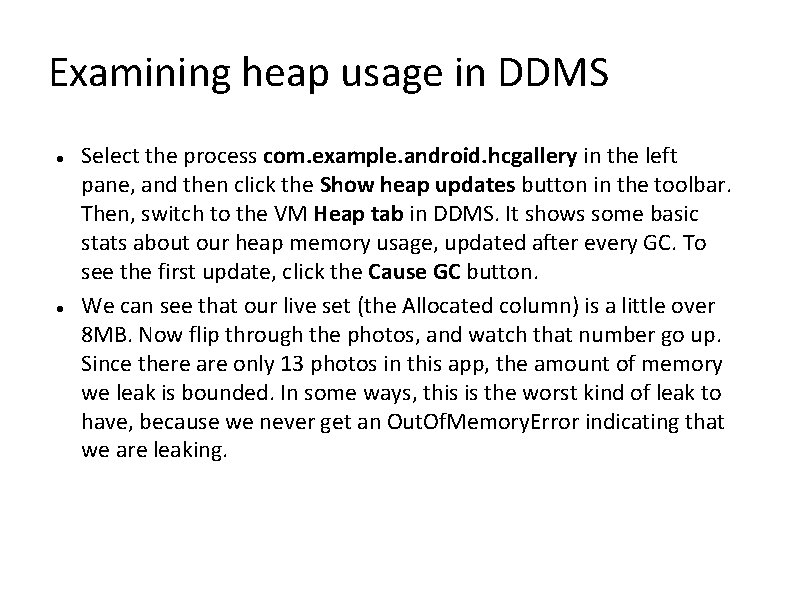
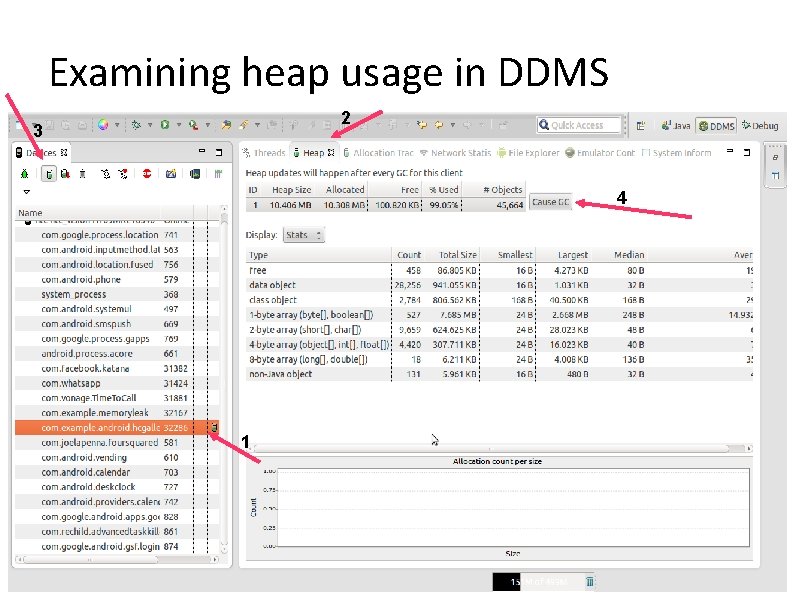
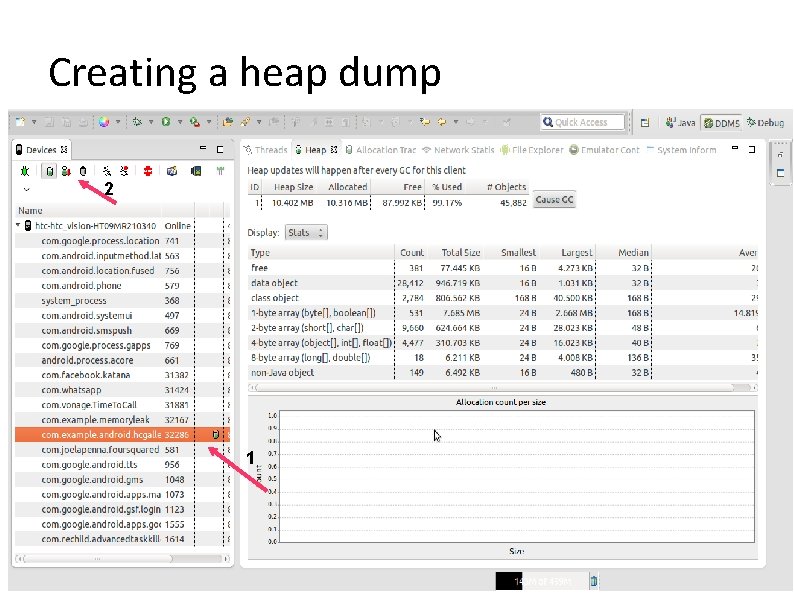
Examining heap usage in DDMS Select the process com. example. android. hcgallery in the left pane, and then click the Show heap updates button in the toolbar. Then, switch to the VM Heap tab in DDMS. It shows some basic stats about our heap memory usage, updated after every GC. To see the first update, click the Cause GC button. We can see that our live set (the Allocated column) is a little over 8 MB. Now flip through the photos, and watch that number go up. Since there are only 13 photos in this app, the amount of memory we leak is bounded. In some ways, this is the worst kind of leak to have, because we never get an Out. Of. Memory. Error indicating that we are leaking.

Examining heap usage in DDMS 2 3 4 1

Creating a heap dump 2 1

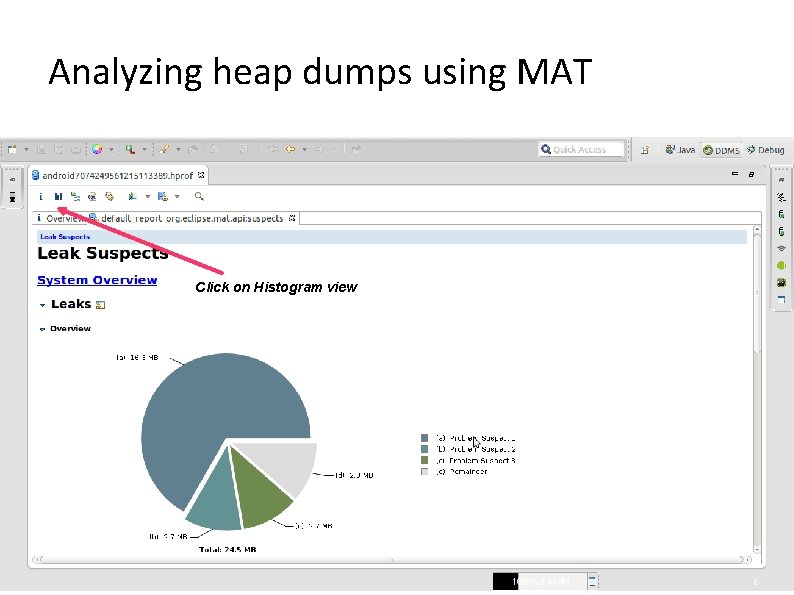
Analyzing heap dumps using MAT Click on Histogram view

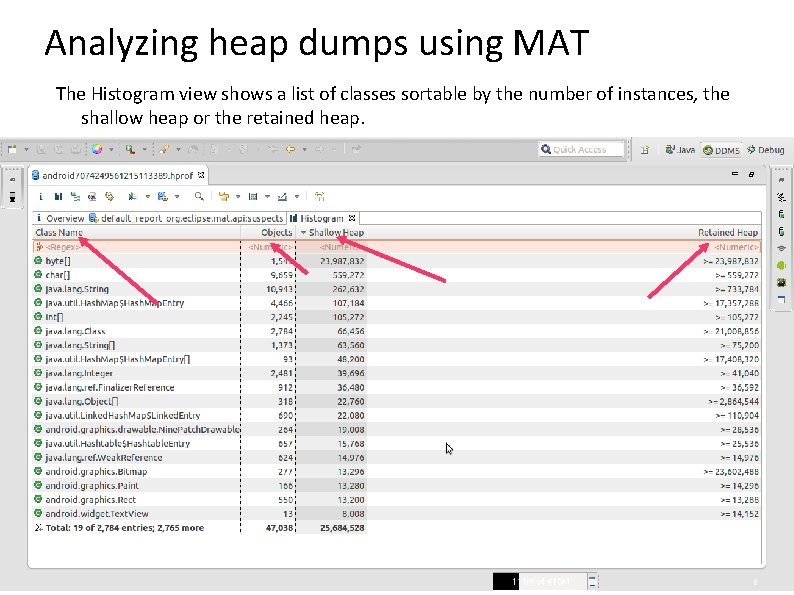
Analyzing heap dumps using MAT The Histogram view shows a list of classes sortable by the number of instances, the shallow heap or the retained heap.

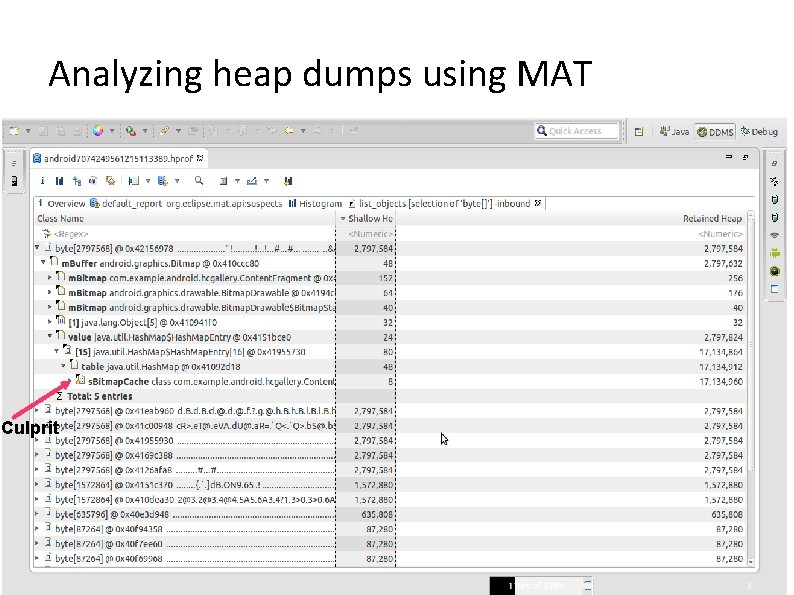
Analyzing heap dumps using MAT If we sort by shallow heap, we can see that instances of byte[] are at the top. As of Android 3. 0 (Honeycomb), the pixel data for Bitmap objects is stored in byte arrays (previously it was not stored in the Dalvik heap), and based on the size of these objects, it's a safe bet that they are the backing memory for our leaked bitmaps. Right-click on the byte[] class and select List Objects > with incoming references. This produces a list of all byte arrays in the heap, which we can sort based on Shallow Heap usage. Pick one of the big objects, and drill down on it. This will show you the path from the root set to the object -- the chain of references that keeps this object alive. Lo and behold, there's our bitmap cache!

Analyzing heap dumps using MAT Culprit

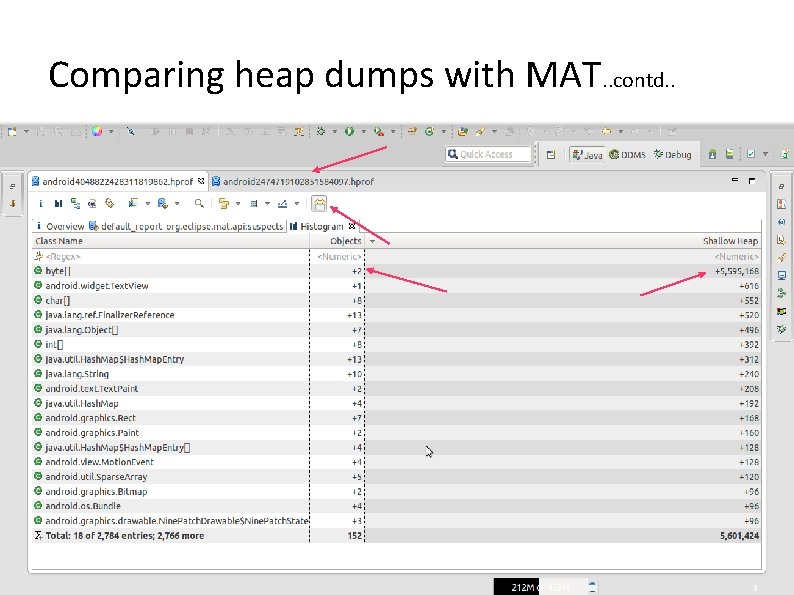
Comparing heap dumps with MAT We need to create two separate HPROF files. Open the first HPROF file (if it is not already opened) Open the Histogram view. Open the second HPROF file. Switch to first HPROF file's Histogram view and click “compare to another Heap Dump” Icon. Then a window will be prompted to select a heap dump from the open editors as baseline. Select second HPROF file and press OK.

Comparing heap dumps with MAT. . contd. .

Downloading MAT for Eclipse IDE: - http: //download. eclipse. org/mat/1. 3/update -site Standalone MAT: - http: //www. eclipse. org/mat/

References http: //dubroy. com/blog/google-io-memory-management-for-androidapps/ https: //developer. android. com/training/displaying-bitmaps/managememory. html http: //macgyverdev. blogspot. com/2011/11/android-track-downmemory-leaks. html http: //www. brpreiss. com/books/opus 5/html/page 424. html https: //sites. google. com/site/pyximanew/blog/androidunderstandingdd mslogcatmemoryoutputmessages http: //www. vogella. com/articles/Eclipse. Memory. Analyzer/article. html http: //rockgrumbler. blogspot. com/2011/02/common-memory-leakcauses-in-java. html

Queries. ?

Thank You. !