FiveMinute Check over Lesson 3 3 CCSS ThenNow
 CCSS Then/Now New Vocabulary Example 1: Slope and")


- Slides: 31
Five-Minute Check (over Lesson 3– 3) CCSS Then/Now New Vocabulary Example 1: Slope and Constant of Variation Example 2: Graph a Direct Variation Concept Summary: Direct Variation Graphs Example 3: Write and Solve a Direct Variation Equation Example 4: Real-World Example: Estimate Using Direct Variation
Over Lesson 3– 3 Find the slope of the line that passes through the points (3, 5) and (7, 12). A. B. C. D.
Over Lesson 3– 3 Find the slope of the line that passes through the points (– 2, 4) and (5, 4). A. 0 B. C. D. undefined
Over Lesson 3– 3 Find the slope of the line that passes through the points (– 3, 6) and (2, – 6). A. 0 B. – 1 C. D. undefined
Over Lesson 3– 3 Find the slope of the line that passes through the points (7, – 2) and (7, 13). A. 0 B. 11 C. D. undefined
Over Lesson 3– 3 In 2005, there were 12, 458 fish in Hound’s Tooth Lake. After years of drought, there were only 968 fish in 2010. What is the rate of change in the population of fish for 2005– 2010? A. 3072 fish/year B. – 1976 fish/year C. – 2298 fish/year D. – 3072 fish/year
Over Lesson 3– 3 The fee for a banquet hall is $525 for a group of 25 people and $1475 for a group of 75 people. Included in the fee is a standard set-up charge. What is the fee person? A. $16 B. $18 C. $19 D. $20
Content Standards A. REI. 10 Understand that the graph of an equation in two variables is the set of all its solutions plotted in the coordinate plane, often forming a curve (which could be a line). F. IF. 7 a Graph linear and quadratic functions and show intercepts, maxima, and minima. Mathematical Practices 1 Make sense of problems and persevere in solving them. 6 Attend to precision. Common Core State Standards © Copyright 2010. National Governors Association Center for Best Practices and Council of Chief State School Officers. All rights reserved.
You found rates of change of linear functions. • Write and graph direct variation equations. • Solve problems involving direct variation.
• direct variation • constant of proportionality
Slope and Constant of Variation A. Name the constant of variation for the equation. Then find the slope of the line that passes through the pair of points. Slope formula (x 1, y 1) = (0, 0) (x 2, y 2) = (1, 2) Simplify. Answer: The constant of variation is 2. The slope is 2.
Slope and Constant of Variation B. Name the constant of variation for the equation. Then find the slope of the line that passes through the pair of points. Slope formula (x 1, y 1) = (0, 0) (x 2, y 2) = (1, – 4) Simplify. Answer: The constant of variation is – 4. The slope is – 4.
A. Name the constant of variation for the equation. Then find the slope of the line that passes through the pair of points. A. constant of variation: 4; slope: – 4 B. constant of variation: 4; slope: 4 C. constant of variation: – 4; slope: – 4 D. constant of variation: slope:
B. Name the constant of variation for the equation. Then find the slope of the line that passes through the pair of points. A. constant of variation: 3; slope: 3 B. constant of variation: slope: C. constant of variation: 0; slope: 0 D. constant of variation: – 3; slope: – 3
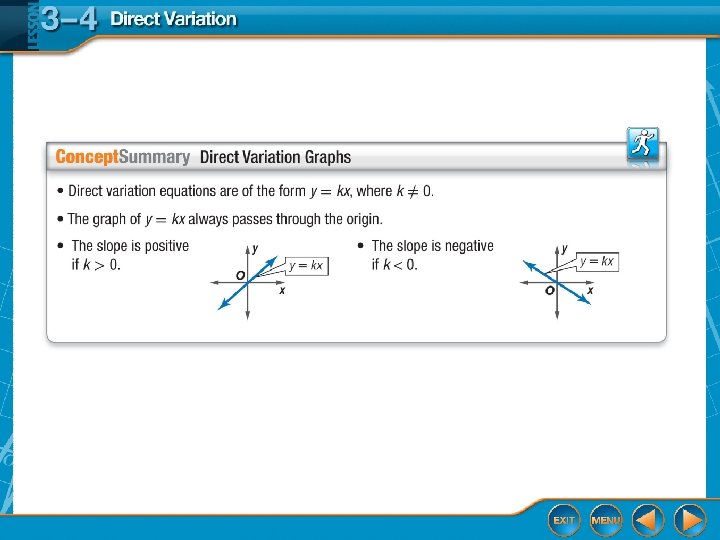
Graph a Direct Variation Answer: Step 1 Find the slope. m Step 2 Graph (0, 0). Step 3 From the point (0, 0), move down 3 units and right 2 units. Draw a dot. Step 4 Draw a line connecting the points.
Graph y = 2 x. A. B. C. D.
Write and Solve a Direct Variation Equation A. Suppose y varies directly as x, and y = 9 when x = – 3. Write a direct variation equation that relates x and y. Find the value of k. y = kx Direct variation formula 9 = k(– 3) Replace y with 9 and x with – 3. Divide each side by – 3 = k Simplify.
Write and Solve a Direct Variation Equation Answer: Therefore, the direct variation equation is y = – 3 x.
Write and Solve a Direct Variation Equation B. Use the direct variation equation to find x when y = 15. Direct variation equation Replace y with 15. Divide each side by – 3. Simplify. Answer: Therefore, x = – 5 when y = 15.
A. Suppose y varies directly as x, and y = 15 when x = 5. Write a direct variation equation that relates x and y. A. y = 3 x B. y = 15 x C. y = 5 x D. y = 45 x
B. Suppose y varies directly as x, and y = 15 when x = 5. Use the direct variation equation to find x when y = – 45. A. – 3 B. 9 C. – 15 D. – 5
Estimate Using Direct Variation A. TRAVEL The Ramirez family is driving cross-country on vacation. They drive 330 miles in 5. 5 hours. Write a direct variation equation to find the distance driven for any number of hours.
Estimate Using Direct Variation Solve for the rate. Original equation Divide each side by 5. 5. Simplify. Answer: Therefore, the direct variation equation is d = 60 t.
Estimate Using Direct Variation B. Graph the equation. The graph of d = 60 t passes through the origin with a slope of 60. Answer:
Estimate Using Direct Variation C. Estimate how many hours it would take to drive 500 miles. Original equation 500 = 60 t Replace d with 500. Divide each side by 60. 8. 33 ≈ t Simplify. Answer: At this rate, it will take about 8. 3 hours to drive 500 miles.
A. Dustin ran a 26 -mile marathon in 3. 25 hours. Write a direct variation equation to find the distance run for any number of hours. A. d = h B. d = 8 h C. d = 8 D.
B. Dustin ran a 26 -mile marathon in 3. 25 hours. Graph the equation. A. B. C. D.
C. Estimate how many hours it would take to jog 16 miles. A. 1 hour B. C. 16 hours D. 2 hours