FiveMinute Check over Lesson 2 6 CCSS ThenNow
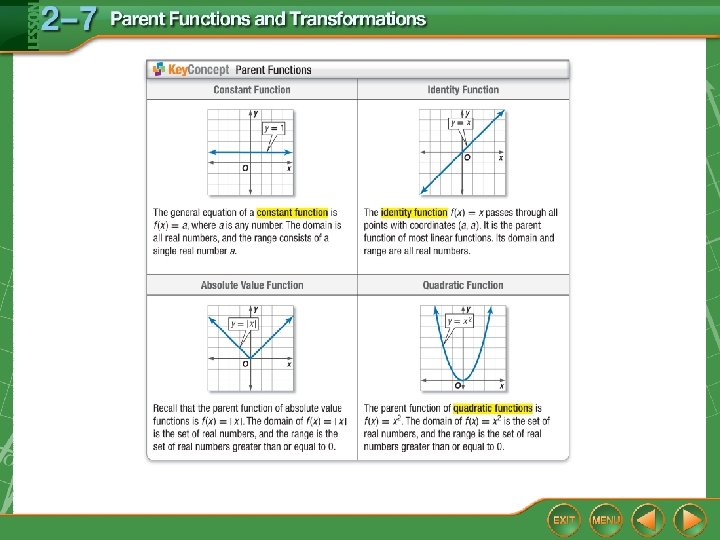
 CCSS Then/Now New Vocabulary Key Concept: Parent Functions")


2. Then")


- Slides: 25
Five-Minute Check (over Lesson 2– 6) CCSS Then/Now New Vocabulary Key Concept: Parent Functions Example 1: Identify a Function Given the Graph Example 2: Describe and Graph Translations Example 3: Describe and Graph Reflections Example 4: Describe and Graph Dilations Example 5: Real-World Example: Identify Transformations Concept Summary: Transformations of Functions
Over Lesson 2– 6 Identify the type of function represented by the graph. A. linear B. piecewise-defined C. absolute value D. parabolic
Over Lesson 2– 6 Identify the type of function represented by the graph. A. piecewise-defined B. linear C. parabolic D. absolute value
Over Lesson 2– 6 A. $60 B. $101 C. $102 D. $148
Content Standards F. IF. 4 For a function that models a relationship between two quantities, interpret key features of graphs and tables in terms of the quantities, and sketch graphs showing key features given a verbal description of the relationship. F. BF. 3 Identify the effect on the graph of replacing f(x) by f(x) + k, k f(x), f(kx), and f(x + k) for specific values of k (both positive and negative); find the value of k given the graphs. Experiment with cases and illustrate an explanation of the effects on the graph using technology. Mathematical Practices 6 Attend to precision.
You analyzed and used relations and functions. • Identify and use parent functions. • Describe transformations of functions.
• family of graphs • reflection • parent graph • line of reflection • parent function • dilation • constant function • identity function • quadratic function • translation
Identify a Function Given the Graph A. Identify the type of function represented by the graph. Answer: The graph is a V shape. So, it is an absolute value function.
Identify a Function Given the Graph B. Identify the type of function represented by the graph. Answer: The graph is a parabola, so it is a quadratic function.
A. Identify the type of function represented be the graph. A. absolute value function B. constant function C. quadratic function D. identity function
B. Identify the type of function represented be the graph. A. absolute value function B. constant function C. quadratic function D. identity function
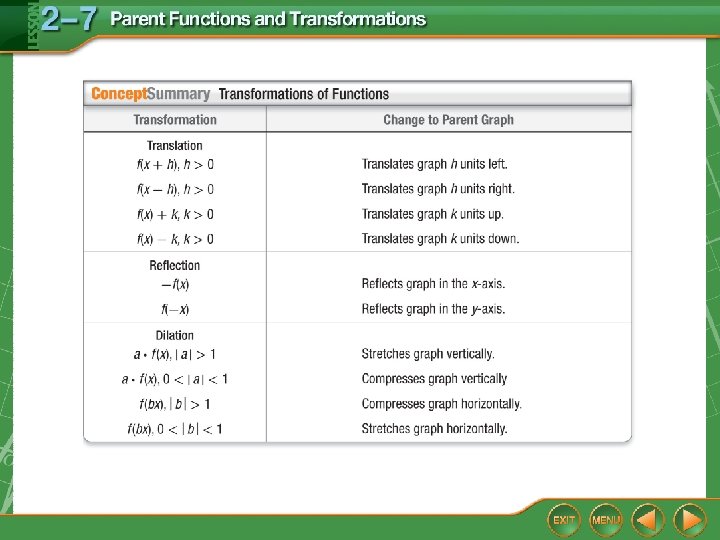
Describe and Graph Translations Describe the translation in y = (x + 1)2. Then graph the function. Answer: The graph of the function y = (x + 1)2 is a translation of the graph of y = x 2 left 1 unit.
Describe the translation in y = |x – 4|. Then graph the function. A. translation of the graph y = |x| up 4 units B. translation of the graph y = |x| down 4 units C. translation of the graph y = |x| right 4 units D. translation of the graph y = |x| left 4 units
Describe and Graph Reflections Describe the reflection in y = –|x|. Then graph the function. Answer: The graph of the function y = –|x| is a reflection of the graph of y = |x| across the x-axis.
Describe the reflection in y = –x 2. Then graph the function. A. reflection of the graph y = x 2 across the x-axis B. reflection of the graph y = x 2 across the y-axis C. reflection of the graph y = x 2 across the line x = 1. D. reflection of the graph y = x 2 across the x = – 1
Describe and Graph Dilations Describe the dilation on function. Answer: The graph of Then graph the is a dilation that compresses the graph of vertically.
Describe the dilation in y = |2 x|. Then graph the function. A. dilation of the graph of y = |x| compressed vertically B. dilation of the graph of y = |x| stretched vertically C. dilation of the graph of y = |x| translated 2 units up D. dilation of the graph of y = |x| translated 2 units right
Identify Transformations
Identify Transformations
Which of the following is not an accurate description of the transformations in the function ? A. +4 translates f(x) = |x| right 4 units B. – 2 translates f(x) = |x| down 2 units C. reflects f(x) = |x| across the x-axis D. +4 translates f(x) = |x| left 4 units
• Page 113 – 116 • #s 10 – 25, 33 – 38, 41, 42, 56 – 58, 63 - 65