
FiveMinute Check over Lesson 2 2 CCSS ThenNow


- Slides: 23
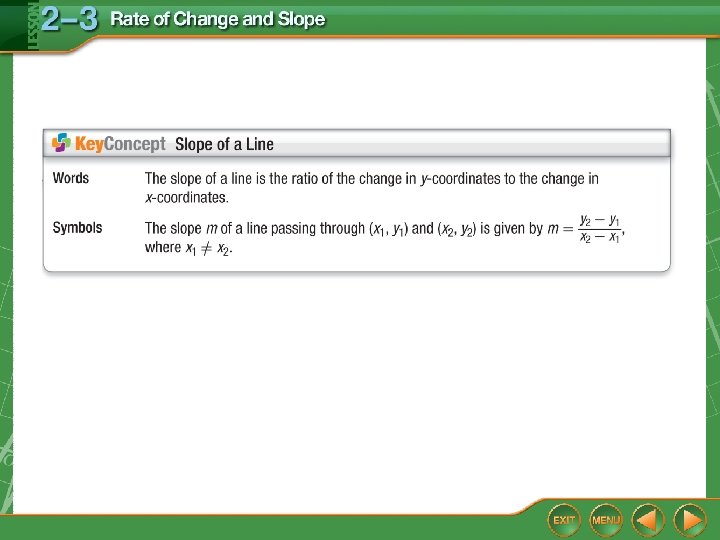
Five-Minute Check (over Lesson 2– 2) CCSS Then/Now New Vocabulary Example 1: Constant Rate of Change Example 2: Real-World Example: Average Rate of Change Key Concept: Slope of a Line Example 3: Find Slope Using Coordinates Example 4: Find Slope Using a Graph
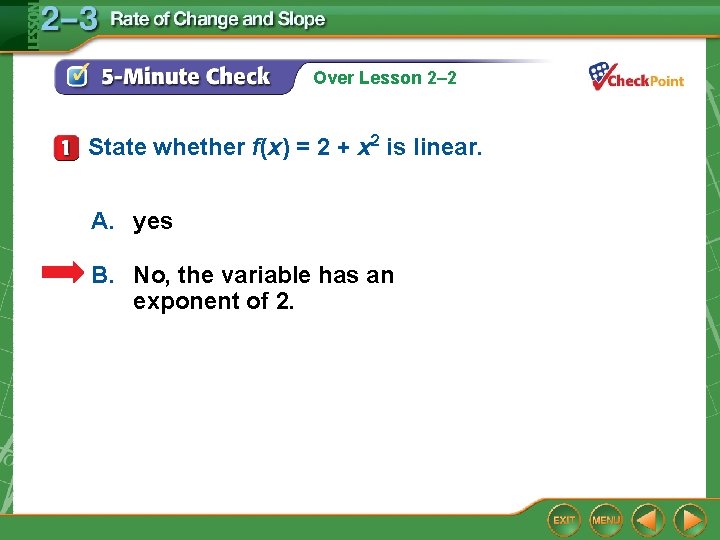
Over Lesson 2– 2 State whether f(x) = 2 + x 2 is linear. A. yes B. No, the variable has an exponent of 2.
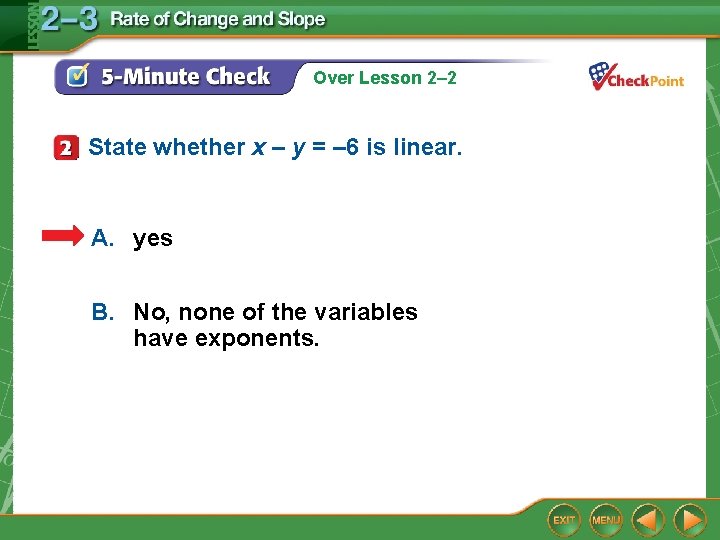
Over Lesson 2– 2 State whether x – y = – 6 is linear. A. yes B. No, none of the variables have exponents.
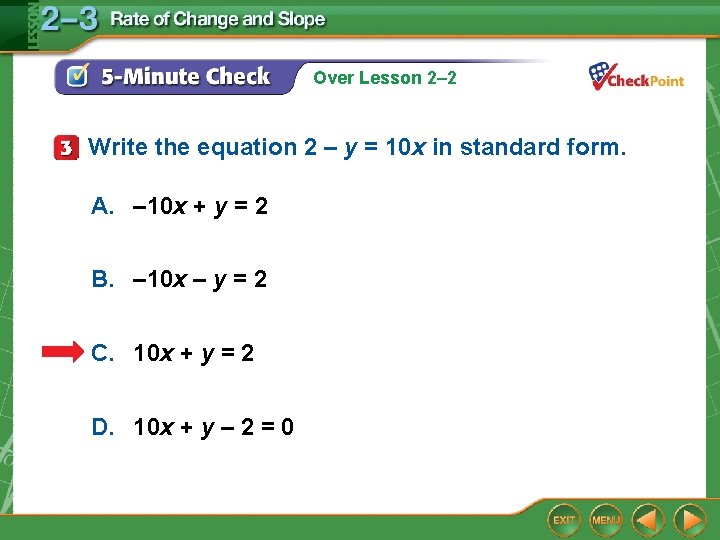
Over Lesson 2– 2 Write the equation 2 – y = 10 x in standard form. A. – 10 x + y = 2 B. – 10 x – y = 2 C. 10 x + y = 2 D. 10 x + y – 2 = 0
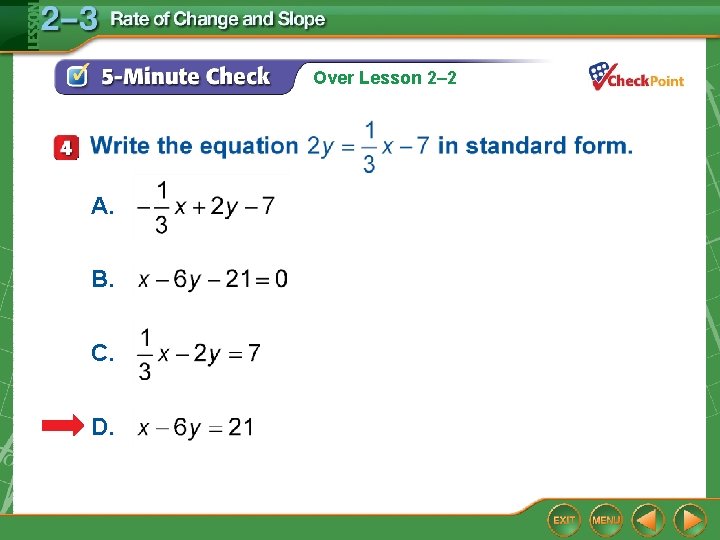
Over Lesson 2– 2 A. B. C. D.
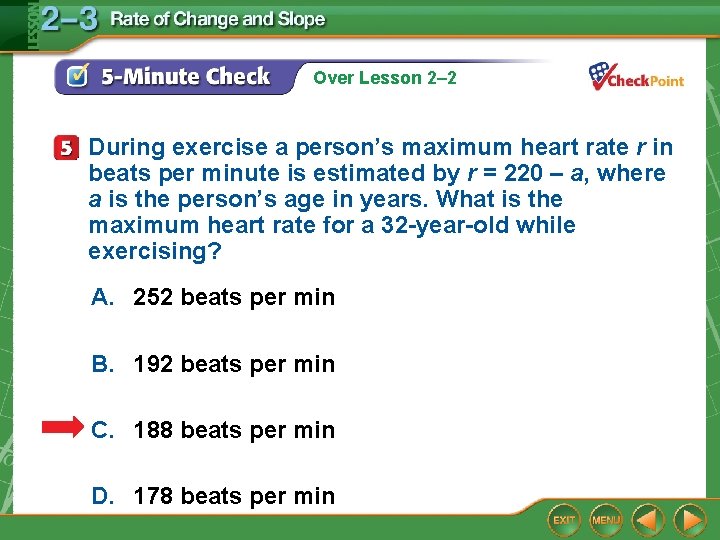
Over Lesson 2– 2 During exercise a person’s maximum heart rate r in beats per minute is estimated by r = 220 – a, where a is the person’s age in years. What is the maximum heart rate for a 32 -year-old while exercising? A. 252 beats per min B. 192 beats per min C. 188 beats per min D. 178 beats per min
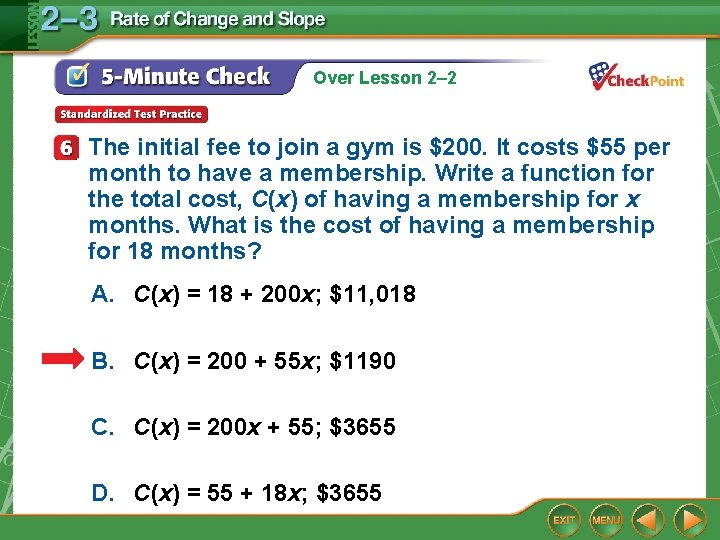
Over Lesson 2– 2 The initial fee to join a gym is $200. It costs $55 per month to have a membership. Write a function for the total cost, C(x) of having a membership for x months. What is the cost of having a membership for 18 months? A. C(x) = 18 + 200 x; $11, 018 B. C(x) = 200 + 55 x; $1190 C. C(x) = 200 x + 55; $3655 D. C(x) = 55 + 18 x; $3655
Content Standards F. IF. 4 For a function that models a relationship between two quantities, interpret key features of graphs and tables in terms of the quantities, and sketch graphs showing key features given a verbal description of the relationship. F. IF. 6 Calculate and interpret the average rate of change of a function (presented symbolically or as a table) over a specified interval. Estimate the rate of change from a graph. Mathematical Practices 8 Look for and express regularity in repeated reasoning.
You graphed linear relations. • Find rate of change. • Determine the slope of a line.
• rate of change • slope
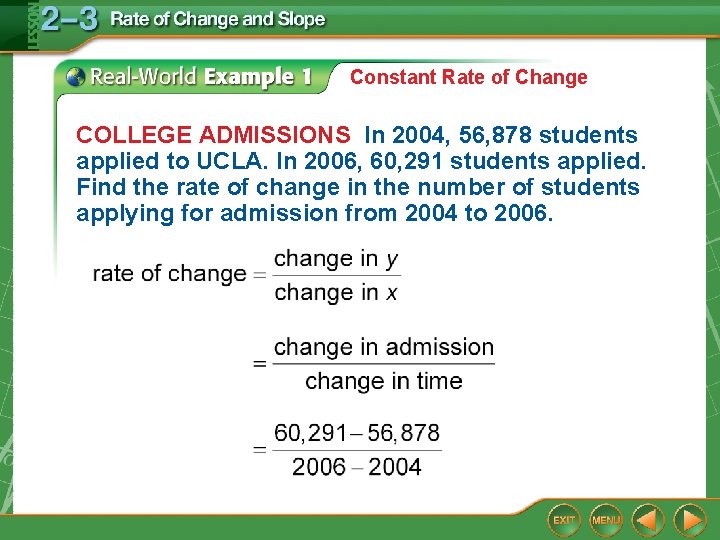
Constant Rate of Change COLLEGE ADMISSIONS In 2004, 56, 878 students applied to UCLA. In 2006, 60, 291 students applied. Find the rate of change in the number of students applying for admission from 2004 to 2006.
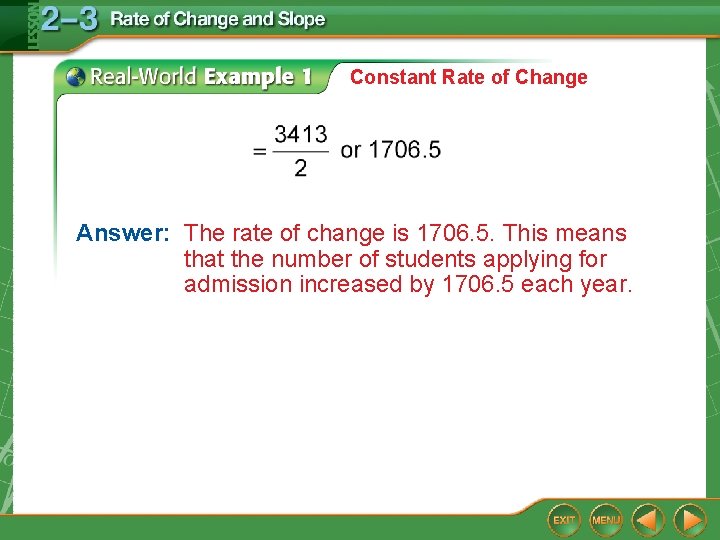
Constant Rate of Change Answer: The rate of change is 1706. 5. This means that the number of students applying for admission increased by 1706. 5 each year.
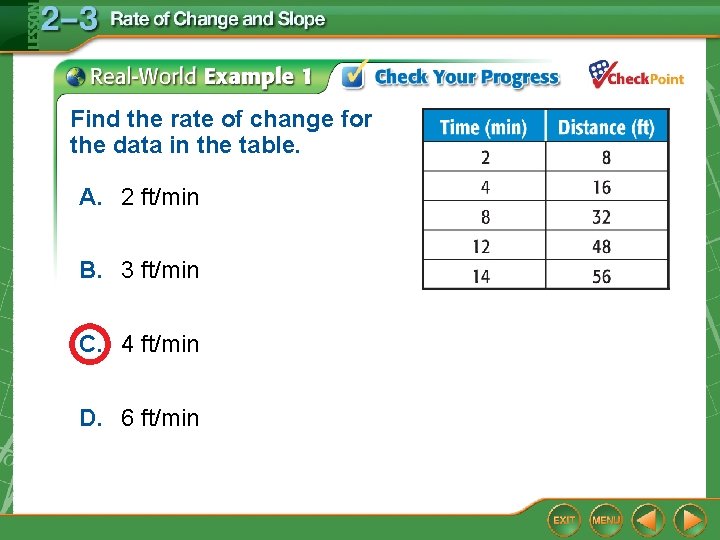
Find the rate of change for the data in the table. A. 2 ft/min B. 3 ft/min C. 4 ft/min D. 6 ft/min
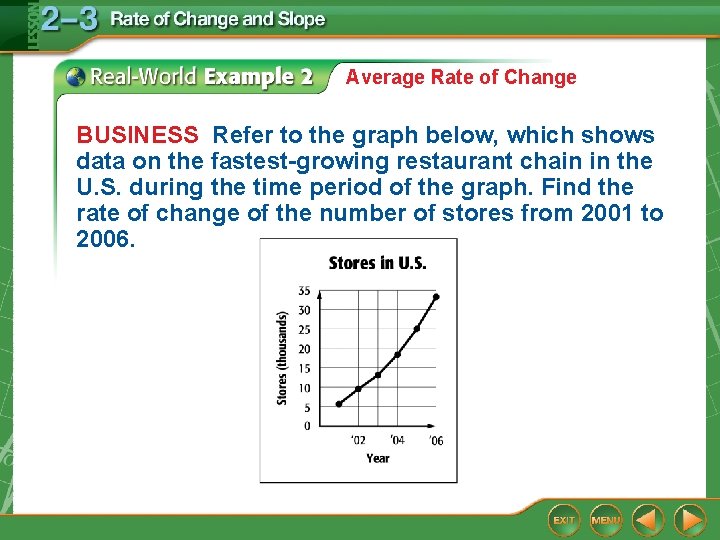
Average Rate of Change BUSINESS Refer to the graph below, which shows data on the fastest-growing restaurant chain in the U. S. during the time period of the graph. Find the rate of change of the number of stores from 2001 to 2006.
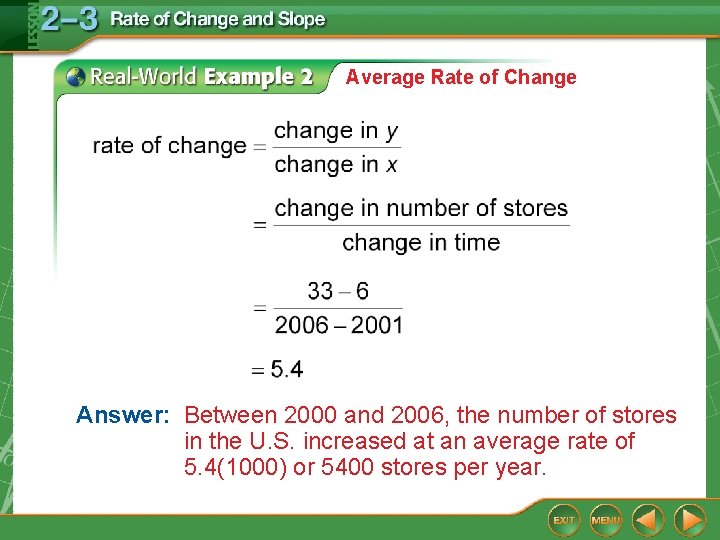
Average Rate of Change Answer: Between 2000 and 2006, the number of stores in the U. S. increased at an average rate of 5. 4(1000) or 5400 stores per year.
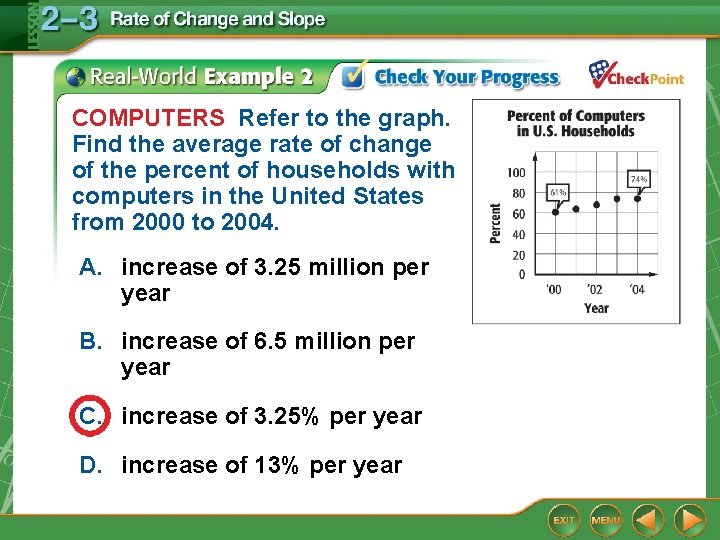
COMPUTERS Refer to the graph. Find the average rate of change of the percent of households with computers in the United States from 2000 to 2004. A. increase of 3. 25 million per year B. increase of 6. 5 million per year C. increase of 3. 25% per year D. increase of 13% per year
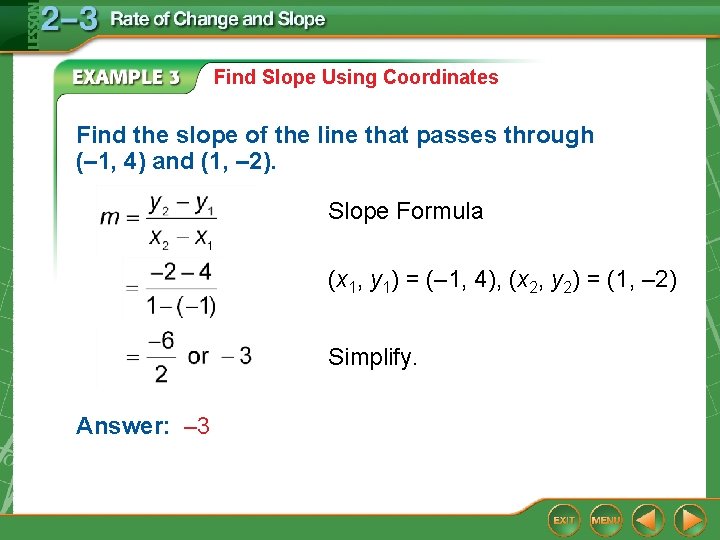
Find Slope Using Coordinates Find the slope of the line that passes through (– 1, 4) and (1, – 2). Slope Formula (x 1, y 1) = (– 1, 4), (x 2, y 2) = (1, – 2) Simplify. Answer: – 3
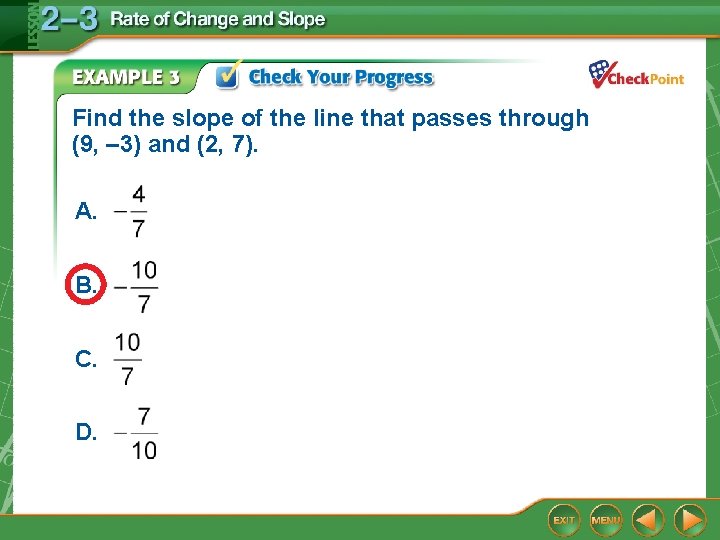
Find the slope of the line that passes through (9, – 3) and (2, 7). A. B. C. D.
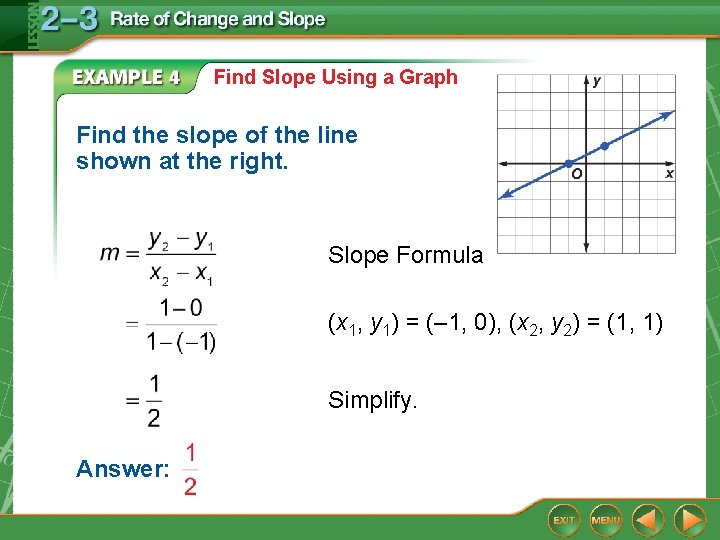
Find Slope Using a Graph Find the slope of the line shown at the right. Slope Formula (x 1, y 1) = (– 1, 0), (x 2, y 2) = (1, 1) Simplify. Answer:
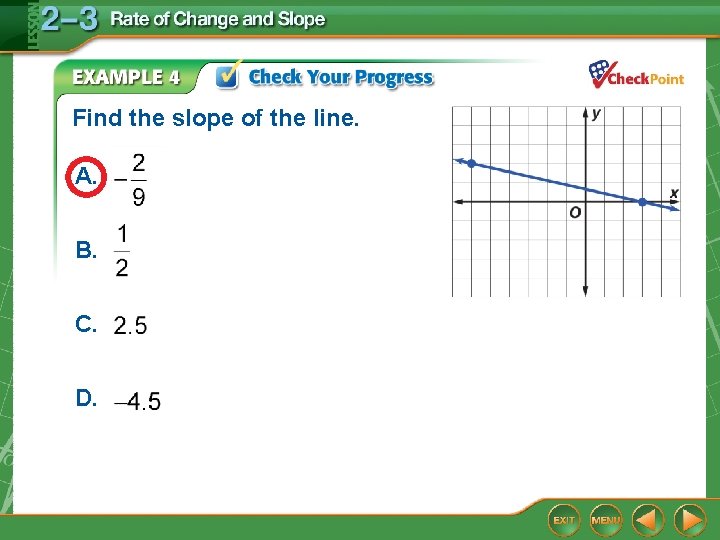
Find the slope of the line. A. B. C. D.