FiveMinute Check over Chapter 6 CCSS ThenNow New

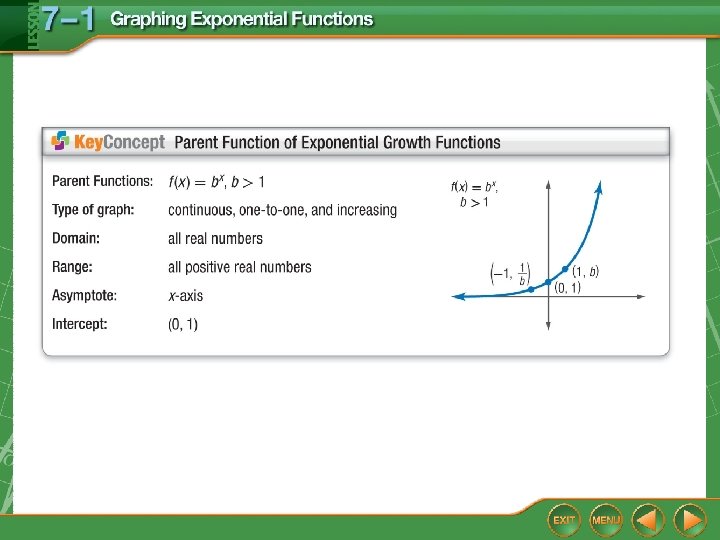
 CCSS Then/Now New Vocabulary Key Concept: Parent Function of")


(x) if f(x) = 3 x + 7")
 = 4 x – 9 and g(x) =")


- Slides: 38
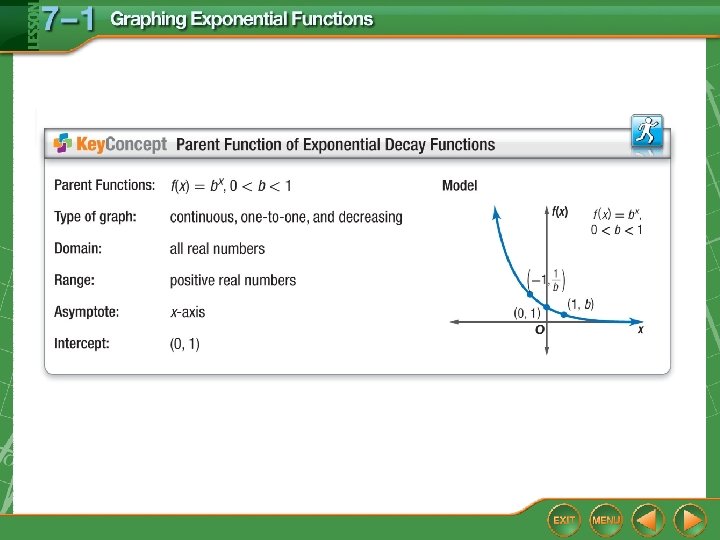
Five-Minute Check (over Chapter 6) CCSS Then/Now New Vocabulary Key Concept: Parent Function of Exponential Growth Functions Example 1: Graph Exponential Growth Functions Key Concept: Transformations of Exponential Functions Example 2: Graph Transformations Example 3: Real-World Example: Graph Exponential Growth Functions Key Concept: Parent Function of Exponential Decay Functions Example 4: Graph Exponential Decay Functions Example 5: Real-World Example: Graph Exponential Decay Functions
Over Chapter 6 Solve 4 a 2 – 9 = 0. A. ± 1 3 B. ± __ 2 C. ± 2 2 D. 2, __ 3
Over Chapter 6 Solve 6 y 3 + 13 y 2 + 5 y = 0. A. 3, 2, 1 B. C. D.
Over Chapter 6 Find (f + g)(x) if f(x) = 3 x + 7 and g(x) = x 2 – 10. A. (f + g)(x) = 3 x 2 – 70 B. (f + g)(x) = x 2 + 3 x – 3 C. (f + g)(x) = x 2 – 3 x + 17 D. (f + g)(x) = 3 x – 3
Over Chapter 6 Determine whether f(x) = 4 x – 9 and g(x) = are inverse functions. A. yes B. no
Over Chapter 6 A. – 9 xy 2 B. – 9 x 2 y 4 C. – 3 xy 2 D. 3 xy 2
Over Chapter 6 A. – 7 B. C. – 2 D. 4
Content Standards F. IF. 7. e Graph exponential and logarithmic functions, showing intercepts and end behavior, and trigonometric functions, showing period, midline, and amplitude. F. IF. 8. b Use the properties of exponents to interpret expressions for exponential functions. Mathematical Practices 3 Construct viable arguments and critique the reasoning of others.
You graphed polynomial functions. • Graph exponential growth functions. • Graph exponential decay functions.
• exponential function • exponential growth • asymptote • growth factor • exponential decay • decay factor
Graph Exponential Growth Functions Graph y = 4 x. State the domain and range. Make a table of values. Connect the points to sketch a smooth curve.
Graph Exponential Growth Functions Answer: The domain is all real numbers, and the range is all positive real numbers.
Which is the graph of y = 3 x? A. B. C. D.
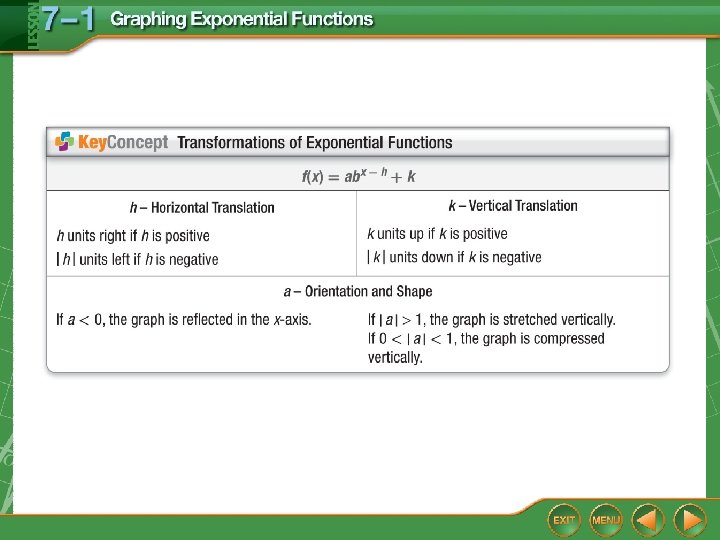
Graph Transformations A. Graph the function y = 3 x – 2. State the domain and range. The equation represents a translation of the graph y = 3 x down 2 units.
Graph Transformations Answer: Domain = {all real numbers} Range = {y│y > – 2}
Graph Transformations B. Graph the function y = 2 x – 1. State the domain and range. The equation represents a translation of the graph y = 2 x right 1 unit.
Graph Transformations Answer: Domain = {all real numbers} Range = {y │y ≥ 0}
A. Graph the function y = 2 x – 4. A. B. C. D.
B. Graph the function y = 4 x – 2 + 3. A. B. C. D.
Graph Exponential Growth Functions INTERNET In 2006, there were 1, 020, 000 people worldwide using the Internet. At that time, the number of users was growing by 19. 5% annually. Draw a graph showing how the number of users would grow from 2006 to 2016 if that rate continued. First, write an equation using a = 1. 020 (in billions), and r = 0. 195. y = 1. 020(1. 195)t Then graph the equation.
Graph Exponential Growth Functions Answer:
CELLULAR PHONES In 2006, there were about 2, 000, 000 people worldwide using cellular phones. At that time, the number of users was growing by 11% annually. Which graph shows how the number of users would grow from 2006 to 2014 if that rate continued? A. B. C. D.
Graph Exponential Decay Functions A. Graph the function and range. State the domain
Graph Exponential Decay Functions Answer: Domain = {all real numbers} Range = {y│y > 0}
Graph Exponential Decay Functions B. Graph the function domain and range. State the The equation represents a transformation of the graph of Examine each parameter. ● There is a negative sign in front of the function: The graph is reflected in the x-axis. ● a = 4: The graph is stretched vertically.
Graph Exponential Decay Functions ● h = 1: The graph is translated 1 unit right. ● k = 2: The graph is translated 2 units up. Answer: Domain = {all real numbers} Range = {y│y < 2}
A. Graph the function A. B. C. D.
B. Graph the function A. B. C. D.
Graph Exponential Decay Functions A. AIR PRESSURE The pressure of the atmosphere is 14. 7 lb/in 2 at Earth’s surface. It decreases by about 20% for each mile of altitude up to about 50 miles. Draw a graph to represent atmospheric pressure for altitude from 0 to 20 miles. y = a(1 – r)t = 14. 7(1 – 0. 20)t = 14. 7(0. 80)t
Graph Exponential Decay Functions Graph the equation. Answer:
Graph Exponential Decay Functions B. AIR PRESSURE The pressure of the atmosphere is 14. 7 lb/in 2 at Earth’s surface. It decreases by about 20% for each mile of altitude up to about 50 miles. Estimate the atmospheric pressure at an altitude of 10 miles. y = 14. 7(0. 80)t Equation from part a. = 14. 7(0. 80)10 Replace t with 10. ≈ 1. 58 lb/in 2 Use a calculator. Answer: The atmospheric pressure at an altitude of about 10 miles will be approximately 1. 6 lb/in 2.
A. AIR PRESSURE The pressure of a car tire with a bent rim is 34. 7 lb/in 2 at the start of a road trip. It decreases by about 3% for each mile driven due to a leaky seal. Draw a graph to represent the air pressure for a trip from 0 to 40 miles. A. B. C. D.
B. AIR PRESSURE The pressure of a car tire with a bent rim is 34. 7 lb/in 2 at the start of a road trip. It decreases by about 3% for each mile driven due to a leaky seal. Estimate the air pressure of the tire after 20 miles. A. 15. 71 lb/in 2 B. 16. 37 lb/in 2 C. 17. 43 lb/in 2 D. 18. 87 lb/in 2