Fitting Fitting Choose a parametric objectsome objects to

Fitting

Fitting • Choose a parametric object/some objects to represent a set of tokens • Most interesting case is when criterion is not local – can’t tell whether a set of points lies on a line by looking only at each point and the next. • Three main questions: – what object represents this set of tokens best? – which of several objects gets which token? – how many objects are there? (you could read line for object here, or circle, or ellipse or. . . )

Line fitting can be max. likelihood - but choice of model is important

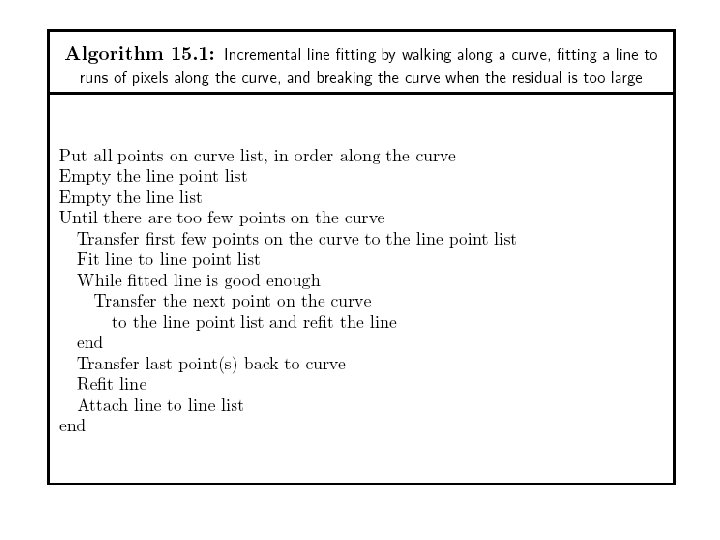
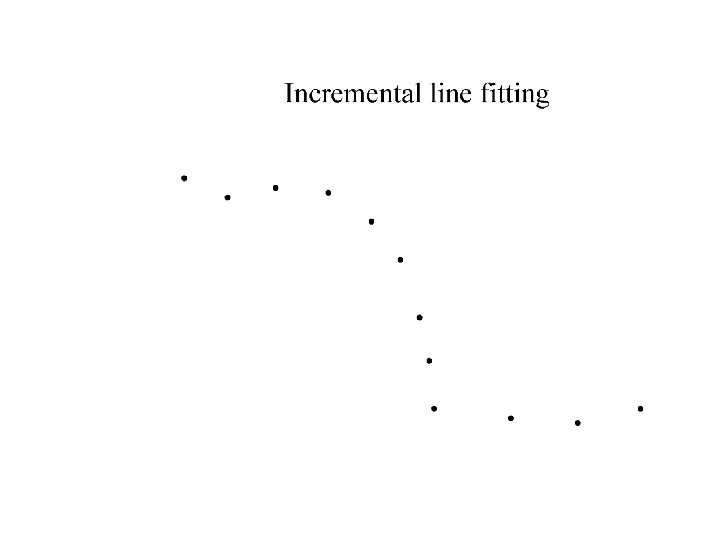
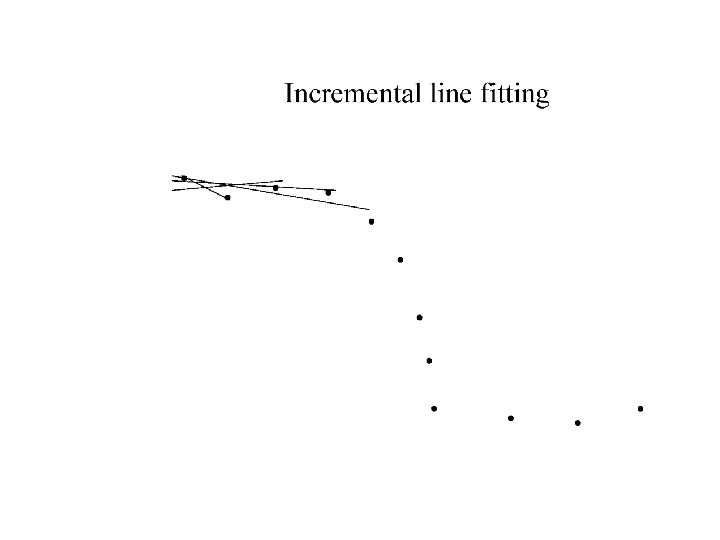
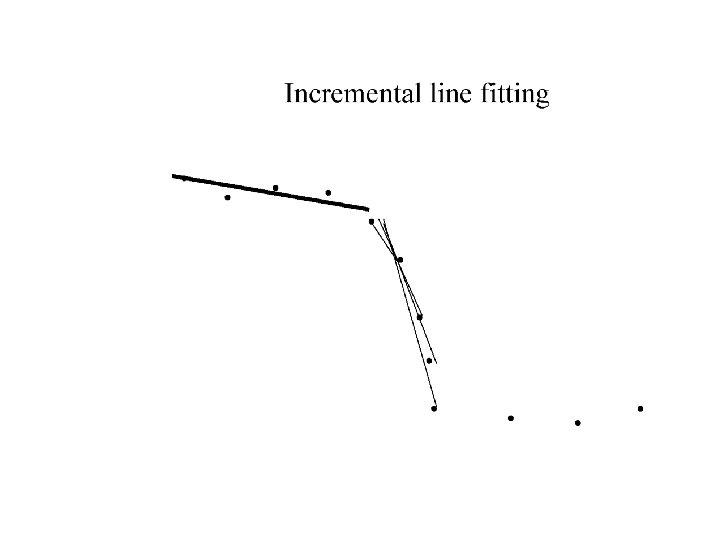
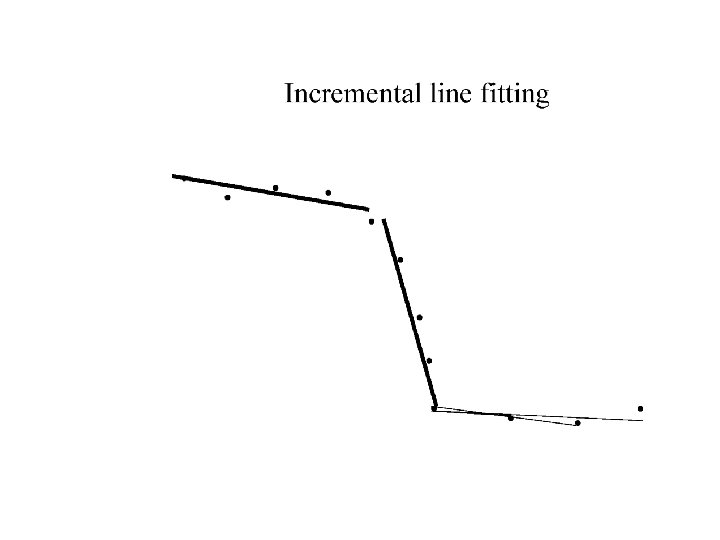
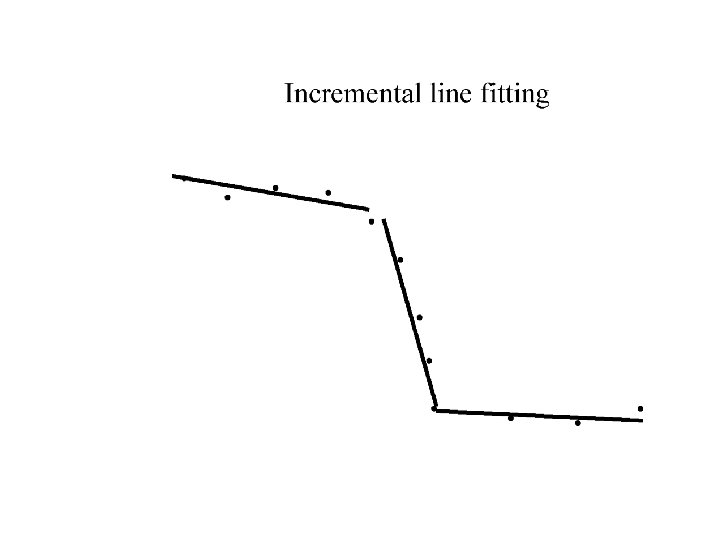
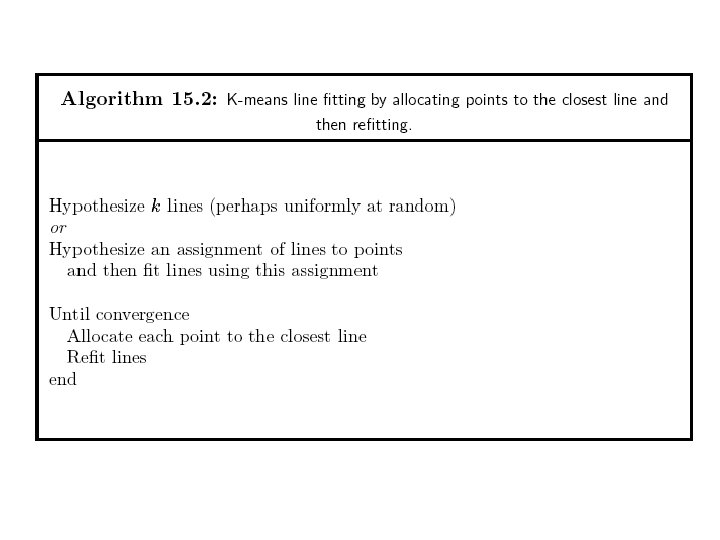
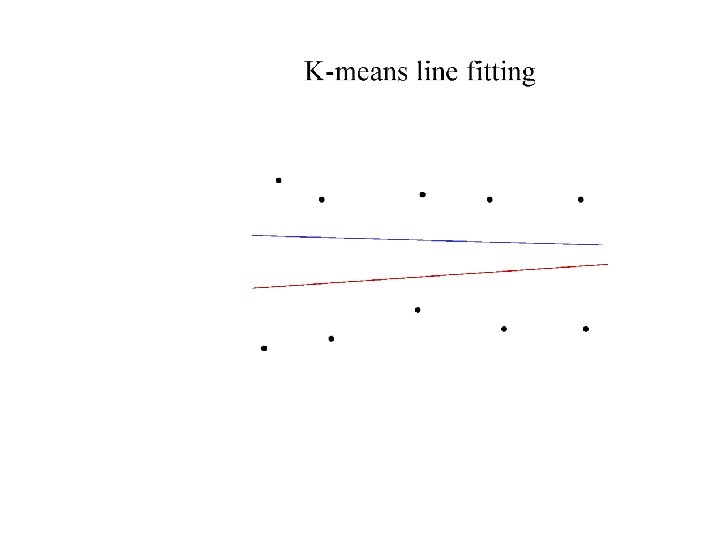
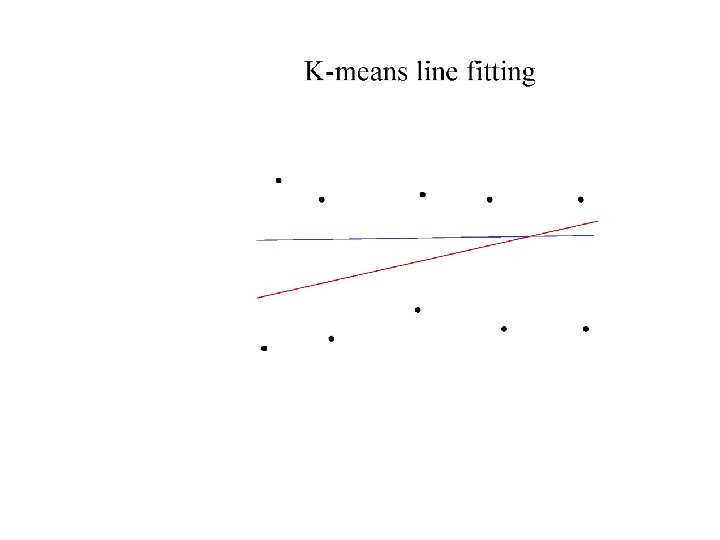
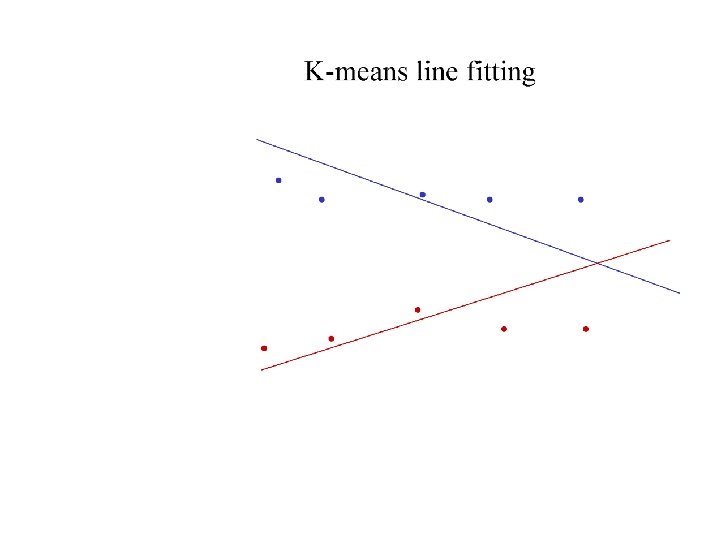
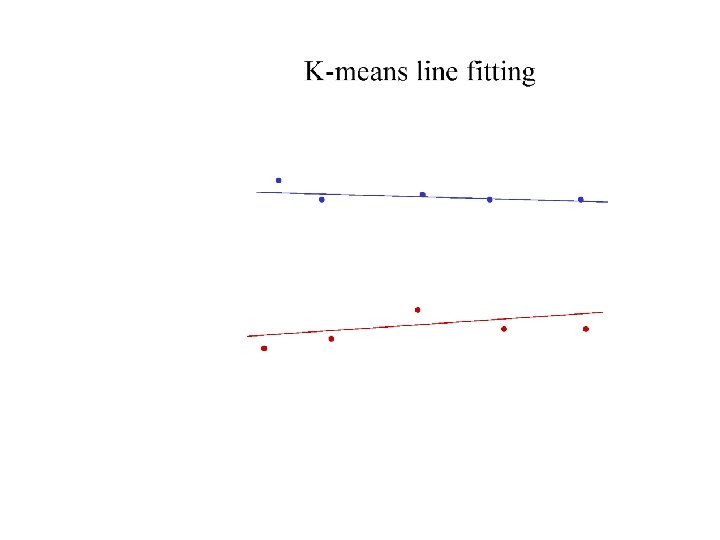
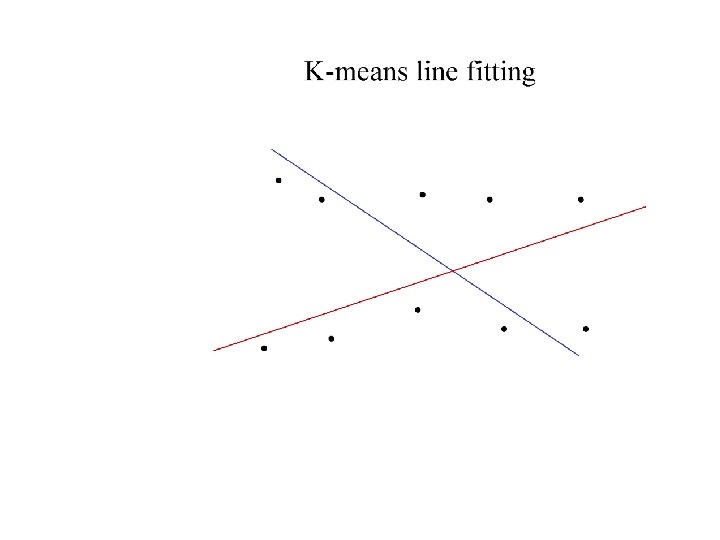
Who came from which line? • Assume we know how many lines there are - but which lines are they? – easy, if we know who came from which line • Three strategies – Incremental line fitting – K-means – Probabilistic (later!)


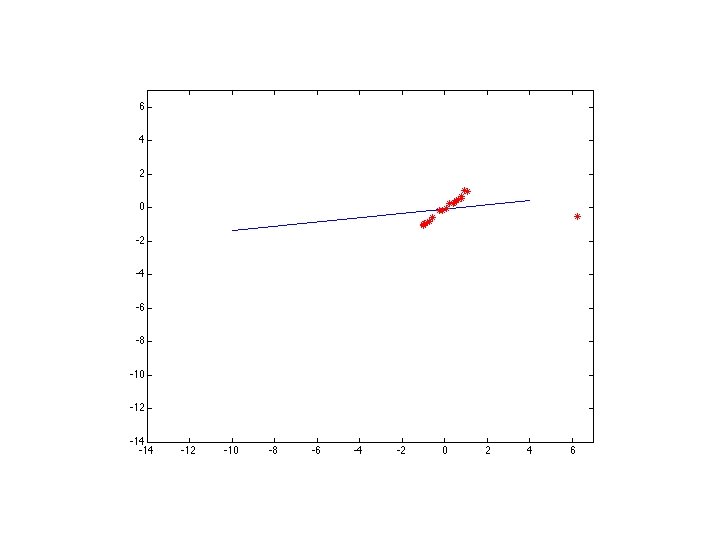
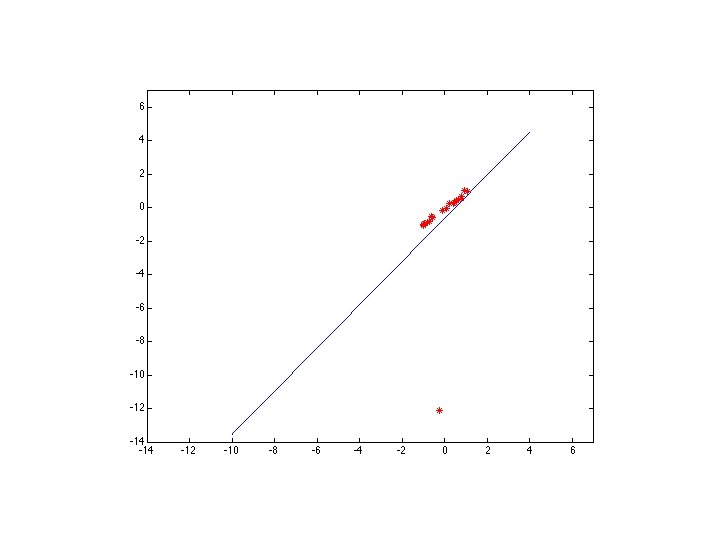
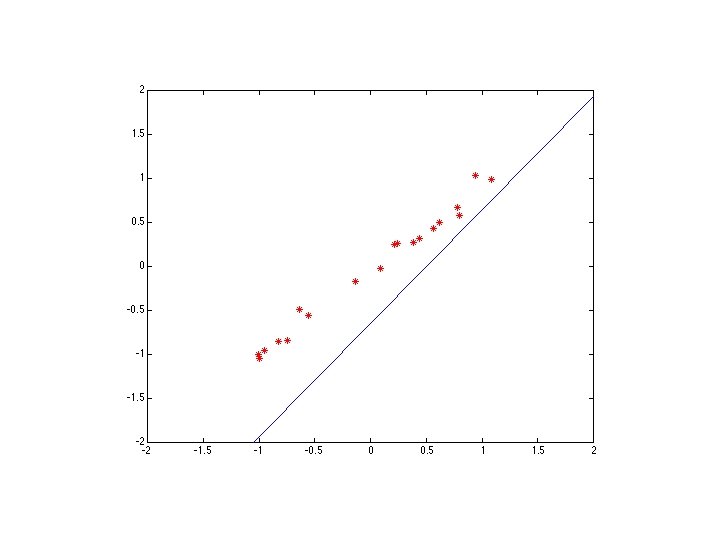
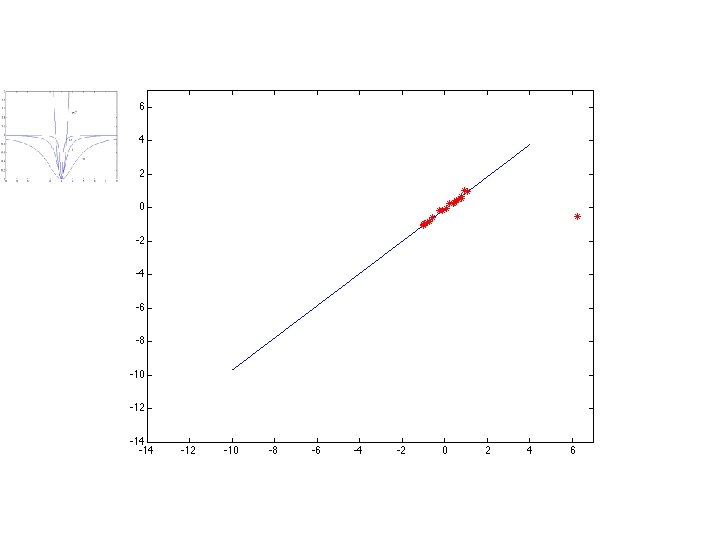
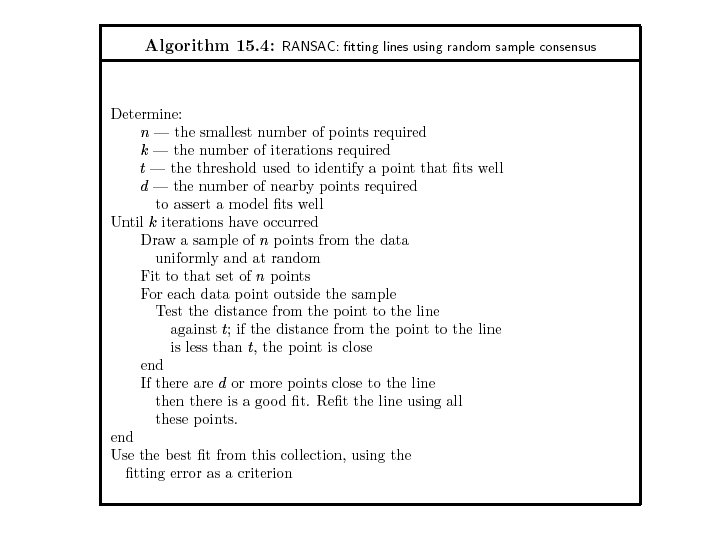
Robustness • As we have seen, squared error can be a source of bias in the presence of noise points – One fix is EM - we’ll do this shortly – Another is an M-estimator • Square nearby, threshold far away – A third is RANSAC • Search for good points


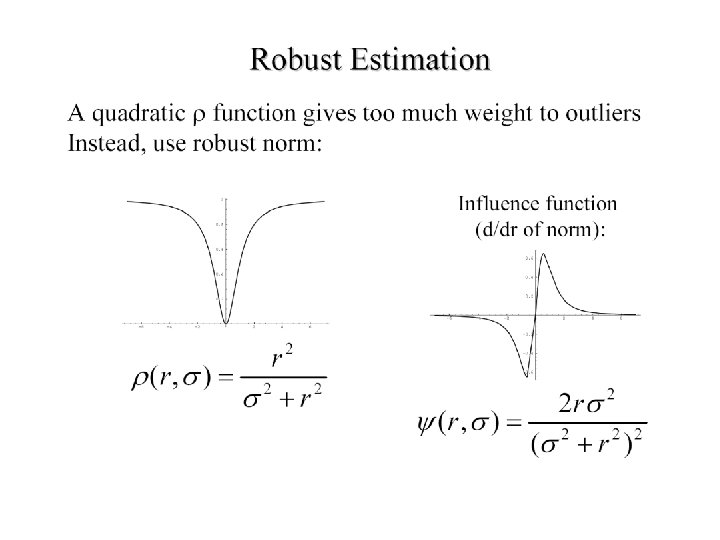
M-estimators • Generally, minimize where is the residual
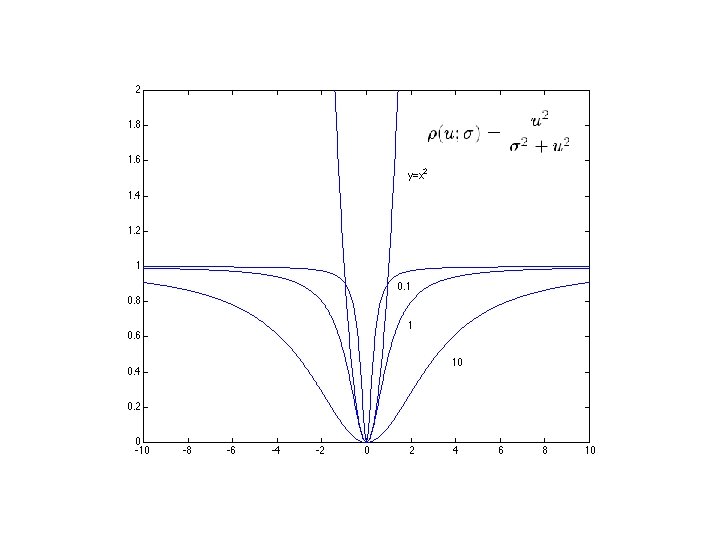

Too small

Too large

RANSAC • Issues • Choose a small subset uniformly at – How many times? random • Often enough that we are likely to have a • Fit to that good line • Anything that is close – How big a subset? to result is signal; all • Smallest possible others are noise – What does close mean? • Refit • Depends on the problem • Do this many times – What is a good line? and choose the best • One where the number of nearby points is so big it is unlikely to be all outliers
")
Distance threshold Choose t so probability for inlier is α (e. g. 0. 95) • Often empirically • Zero-mean Gaussian noise σ then follows distribution with m=codimension of model (dimension+codimension=dimension space) Codimension Model t 1 line, F 3. 84σ2 2 H, P 5. 99σ2 3 T 7. 81σ2 2

How many samples? Choose N so that, with probability p, at least one random sample is free from outliers. e. g. p=0. 99 proportion of outliers e s 2 3 4 5 6 7 8 5% 2 3 3 4 4 4 5 10% 3 4 5 6 7 8 9 20% 5 7 9 12 16 20 26 25% 6 9 13 17 24 33 44 30% 7 11 17 26 37 54 78 40% 50% 11 17 19 35 34 72 57 146 97 293 163 588 272 1177

Acceptable consensus set? • Typically, terminate when inlier ratio reaches expected ratio of inliers

Adaptively determining the number of samples e is often unknown a priori, so pick worst case, e. g. 50%, and adapt if more inliers are found, e. g. 80% would yield e=0. 2 – N=∞, sample_count =0 – While N >sample_count repeat • • Choose a sample and count the number of inliers Set e=1 -(number of inliers)/(total number of points) Recompute N from e Increment the sample_count by 1 – Terminate

RANSAC for Fundamental Matrix Step 1. Extract features Step 2. Compute a set of potential matches Step 3. do Step 3. 1 select minimal sample (i. e. 7 matches) Step 3. 2 compute solution(s) for F Step 3. 3 determine inliers (verify hypothesis) (generate hypothesis) until (#inliers, #samples)<95% Step 4. Compute F based on all inliers Step 5. Look for additional matches Step 6. Refine F based on all correct matches #inliers 90% 80% 70% 60% 50% #samples 5 13 35 106 382

Randomized RANSAC for Fundamental Matrix Step 1. Extract features Step 2. Compute a set of potential matches Step 3. do Step 3. 1 select minimal sample (i. e. 7 matches) (generate Step 3. 2 compute solution(s) for F hypothesis) Step 3. 3 Randomize verification 3. 3. 1 verify if inlier (verify hypothesis) while hypothesis is still promising while (#inliers, #samples)<95% Step 4. Compute F based on all inliers Step 5. Look for additional matches Step 6. Refine F based on all correct matches
 #in 1 -e adapt. N 6")
Example: robust computation from H&Z Interest points (500/image) #in 1 -e adapt. N 6 2% 20 M 10 3% 2. 5 M 44 16% 6, 922 58 21% 2, 291 73 26% 911 151 56% 43 (640 x 480) Putative correspondences (268) (Best match, SSD<20, ± 320) Outliers (117) (t=1. 25 pixel; 43 iterations) Inliers (151) Final inliers (262) (2 MLE-inlier cycles; d =0. 23→d =0. 19; Iter. Lev-Mar=10)

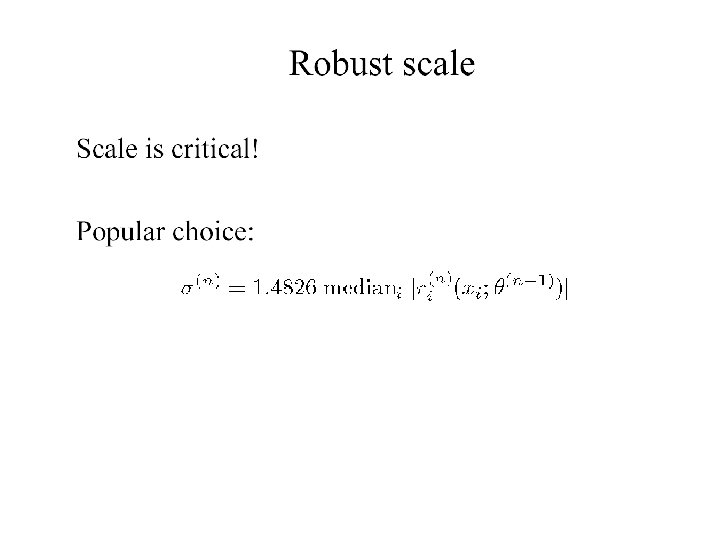
More on robust estimation • LMed. S, an alternative to RANSAC (minimize Median residual in stead of maximizing inlier count) • Enhancements to RANSAC – Randomized RANSAC – Sample ‘good’ matches more frequently –… • RANSAC is also somewhat robust to bugs, sometimes it just takes a bit longer…

Fitting curves other than lines • In principle, an easy generalisation – The probability of obtaining a point, given a curve, is given by a negative exponential of distance squared • In practice, rather hard – It is generally difficult to compute the distance between a point and a curve
- Slides: 41