
Fitness Assessments Resting Measurements Why are Fitness Assessment




- Slides: 83
Fitness Assessments Resting Measurements
Why are Fitness Assessment Performed? • To develop exercise programs • Create goals for clients • Help clients become more motivated
How often should fitness assessment be performed? • Every 6 weeks
Pre-Testing Conditions • No eating within 4 hours of the test • No strenuous activity within 12 hours of the test • No Caffeine within 12 hours of the test • No nicotine within 3 hours of the test
Pre-Testing Conditions Cont. • No alcohol within 24 hours of the test • Urinate within 30 minutes of the assessment • Determine if client is on medications which will affect the outcome of cardiovascular tests (beta blockers prevent heart rates from rising
Who may be intimidated by the fitness assessment process? As a personal trainer what should you do? • Those who are self-conscious about their appearance and intimidated by the idea of joining a fitness facility. • As a personal trainer you should make your clients feel as comfortable as possible, share with your clients what you will be doing and how it will be accomplished.
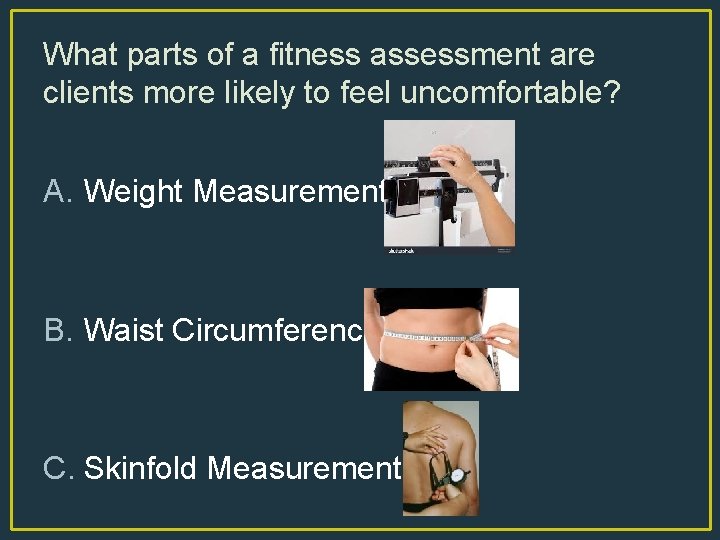
What parts of a fitness assessment are clients more likely to feel uncomfortable? A. Weight Measurement B. Waist Circumference C. Skinfold Measurements
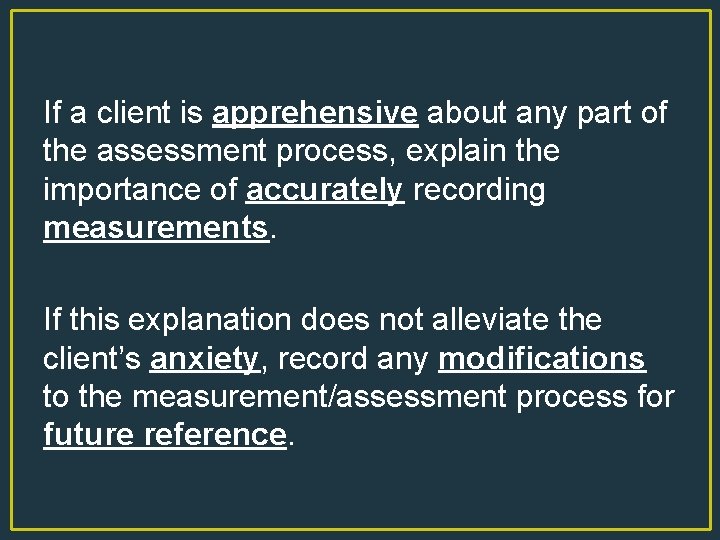
If a client is apprehensive about any part of the assessment process, explain the importance of accurately recording measurements. If this explanation does not alleviate the client’s anxiety, record any modifications to the measurement/assessment process for future reference.
The success of the personal-trainer client relationship is built on a foundation of respect for the client. Respect can be established by providing information about the assessment process. Listening to and addressing the client’s concerns and demonstrating competence in the assessment procedures.
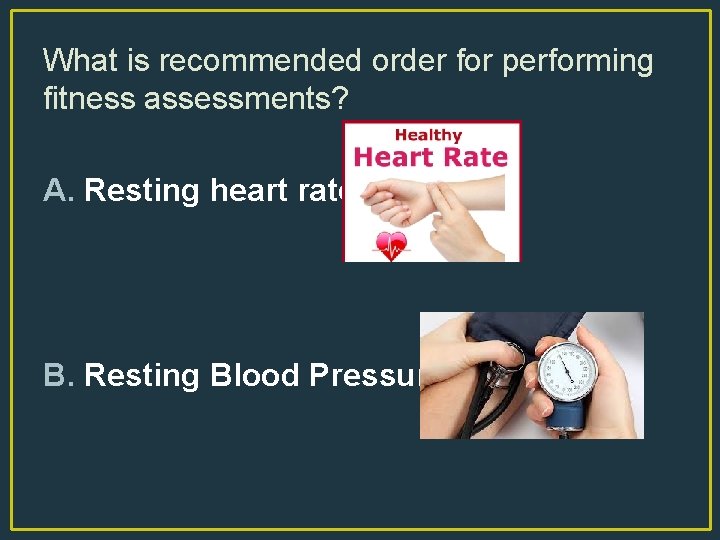
What is recommended order for performing fitness assessments? A. Resting heart rate B. Resting Blood Pressure
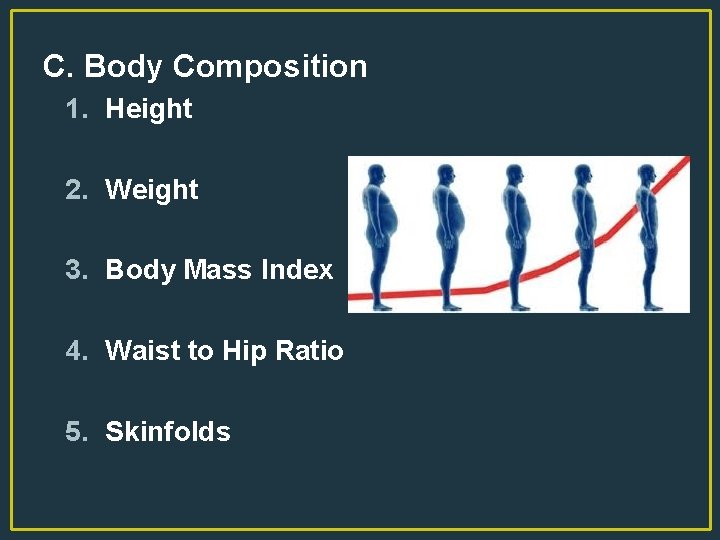
C. Body Composition 1. Height 2. Weight 3. Body Mass Index 4. Waist to Hip Ratio 5. Skinfolds
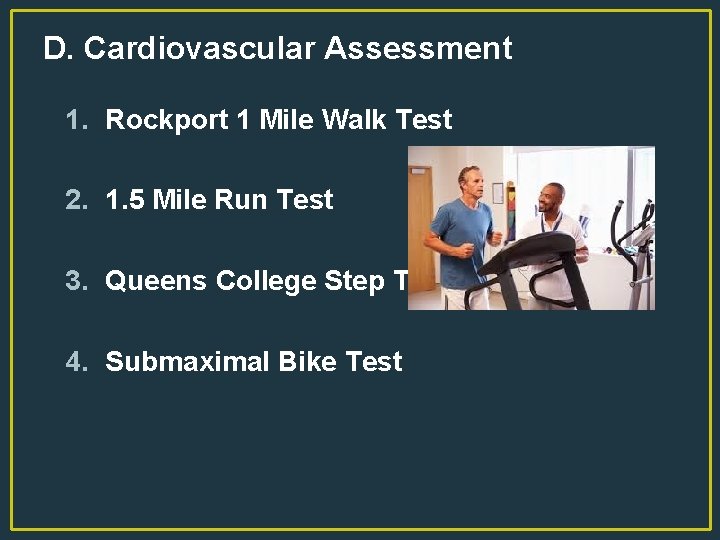
D. Cardiovascular Assessment 1. Rockport 1 Mile Walk Test 2. 1. 5 Mile Run Test 3. Queens College Step Test 4. Submaximal Bike Test
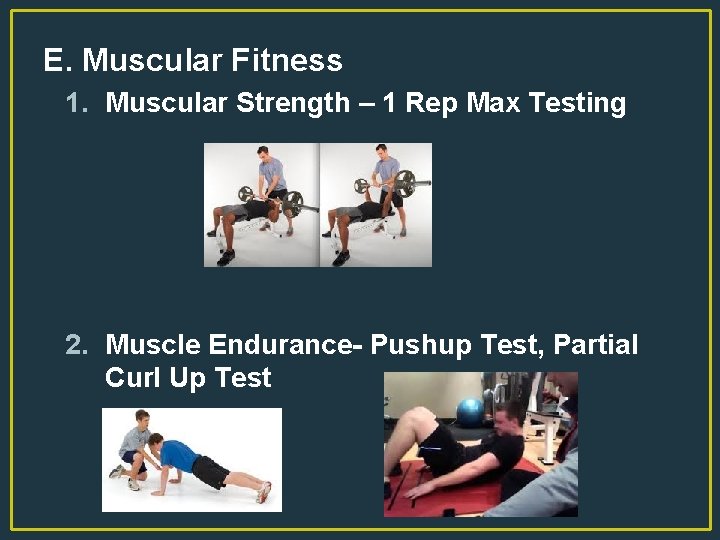
E. Muscular Fitness 1. Muscular Strength – 1 Rep Max Testing 2. Muscle Endurance- Pushup Test, Partial Curl Up Test
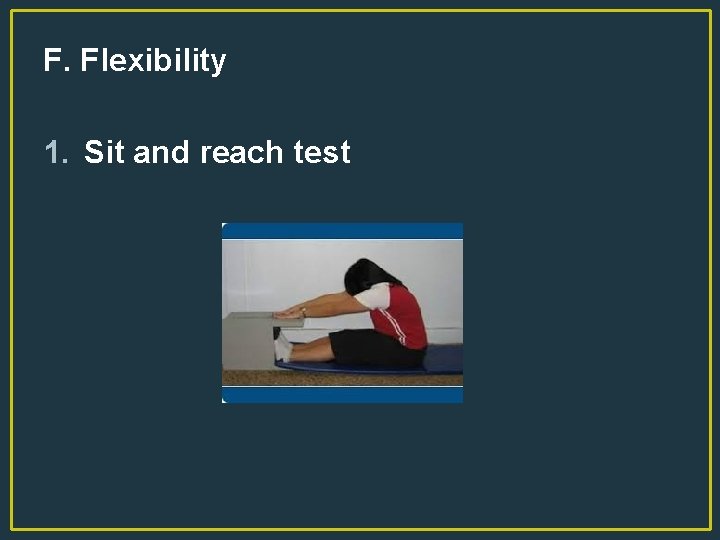
F. Flexibility 1. Sit and reach test
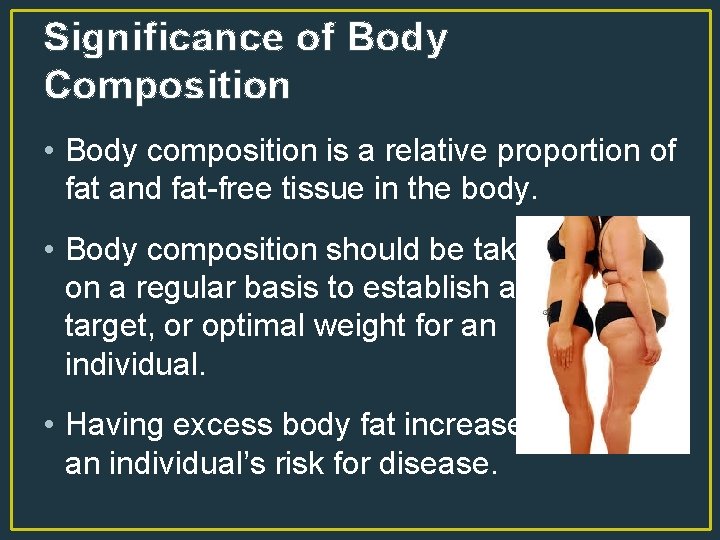
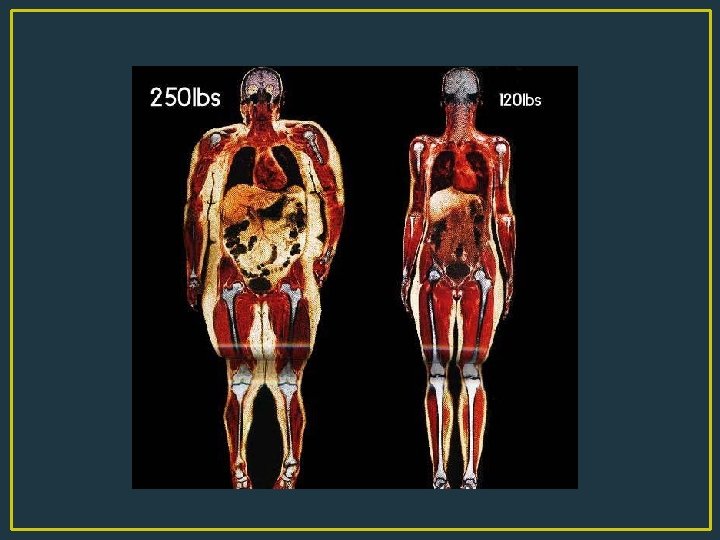
Significance of Body Composition • Body composition is a relative proportion of fat and fat-free tissue in the body. • Body composition should be taken on a regular basis to establish a target, or optimal weight for an individual. • Having excess body fat increases an individual’s risk for disease.
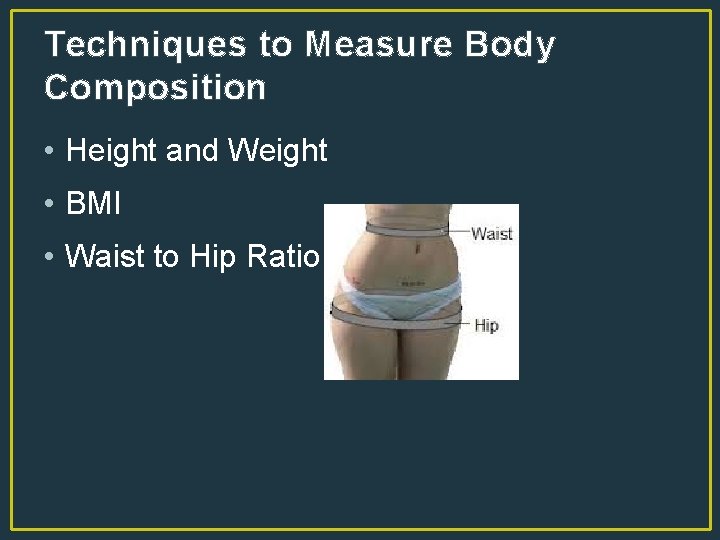
Techniques to Measure Body Composition • Height and Weight • BMI • Waist to Hip Ratio
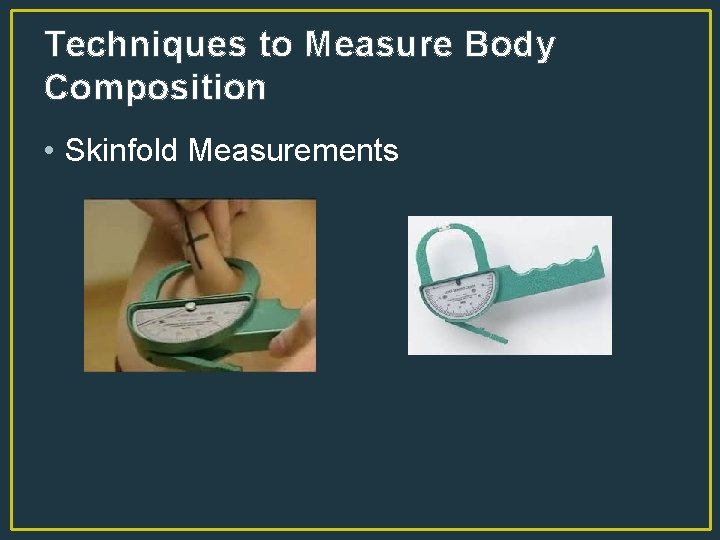
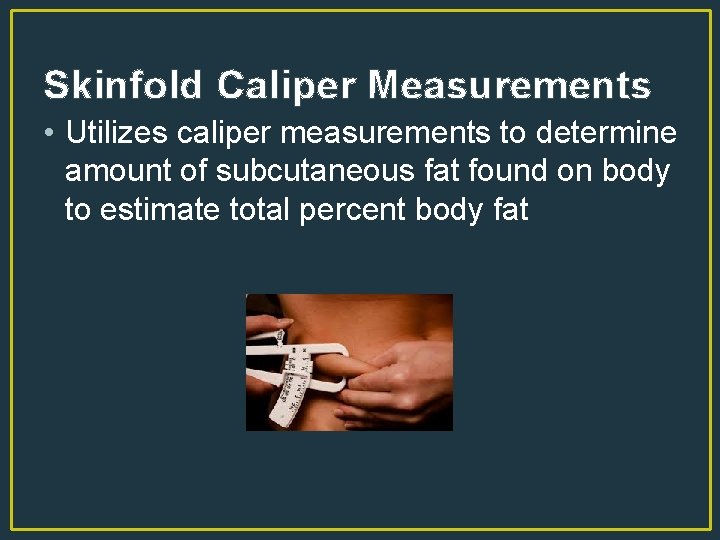
Techniques to Measure Body Composition • Skinfold Measurements
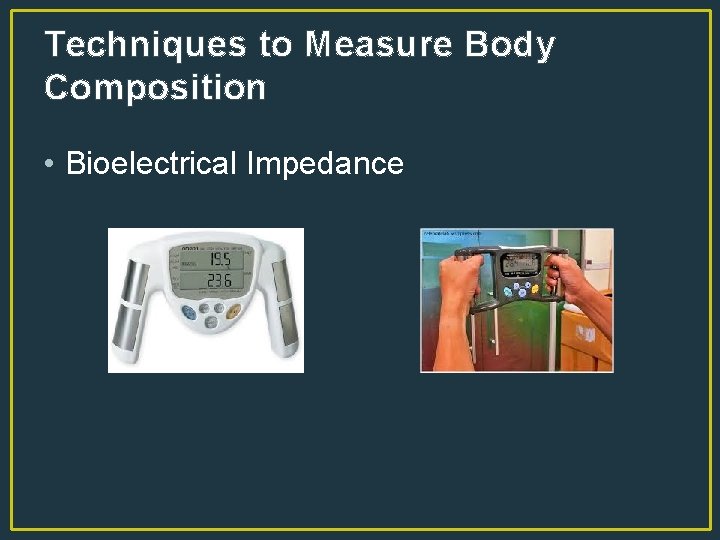
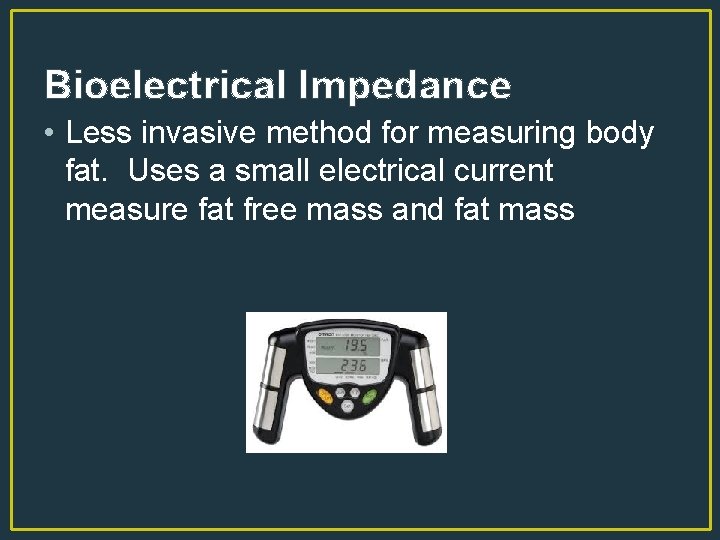
Techniques to Measure Body Composition • Bioelectrical Impedance
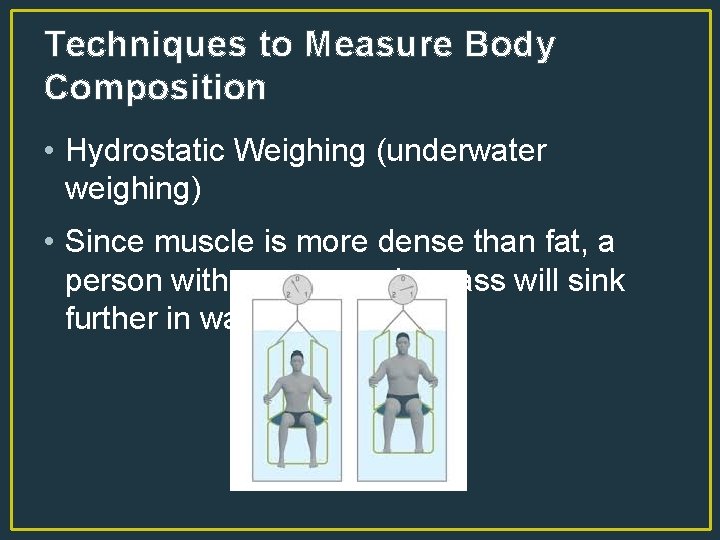
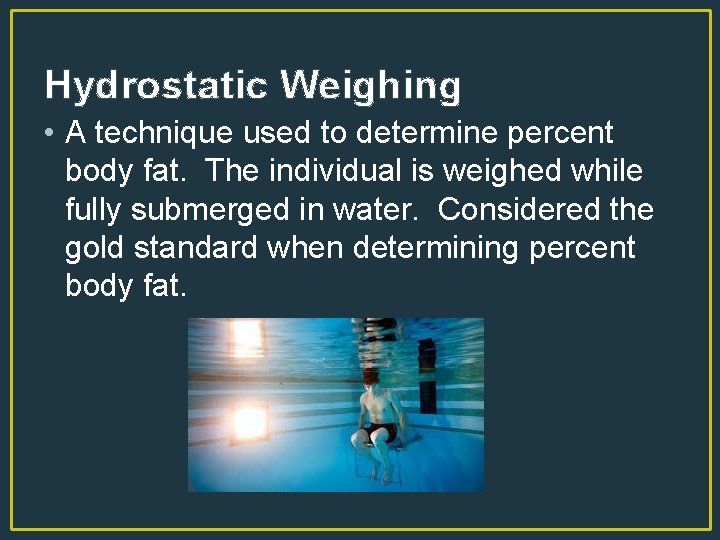
Techniques to Measure Body Composition • Hydrostatic Weighing (underwater weighing) • Since muscle is more dense than fat, a person with more muscle mass will sink further in water.
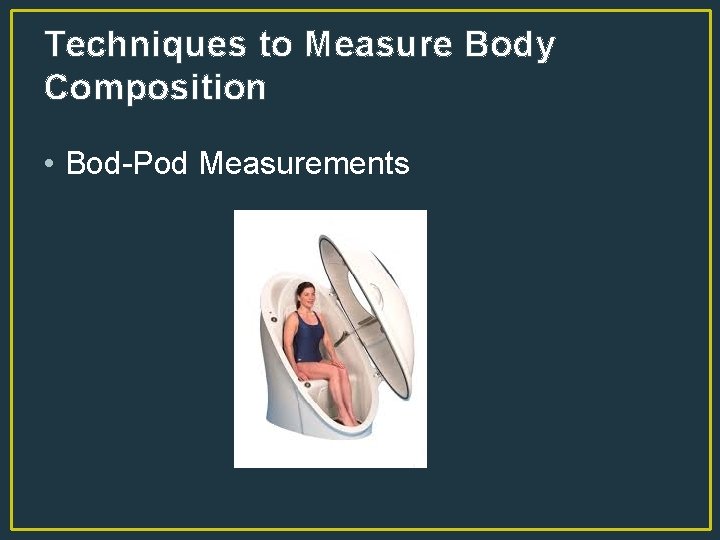
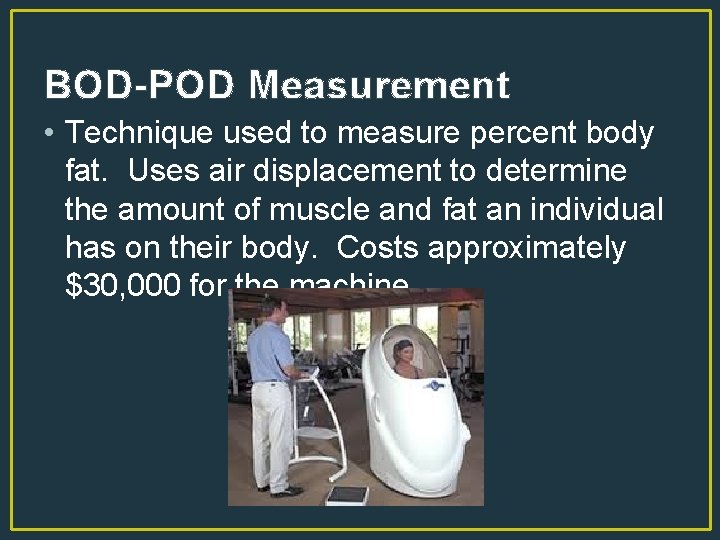
Techniques to Measure Body Composition • Bod-Pod Measurements
Plethysmography • Plethysmography is used to measure changes in the size and shape of an organ or body part. • Waist to hip ratio, skinfold measurement, bioelectrical impedance, hydrostatic weighing and the bod pod measurements are all examples of plethysmography. • .
Plethysmography Cont. • Plethysmography measurements are considered superior to height/weight and BMI measurements alone because plethysmography takes lean/fat mass into consideration.
Waist to Hip Ratio • Comparison between the circumference of the waist and the circumference of the hip. • The waist measurement is divided by the hip measurement. • Health risk is high for men when it is greater than. 95 and for women greater than. 86
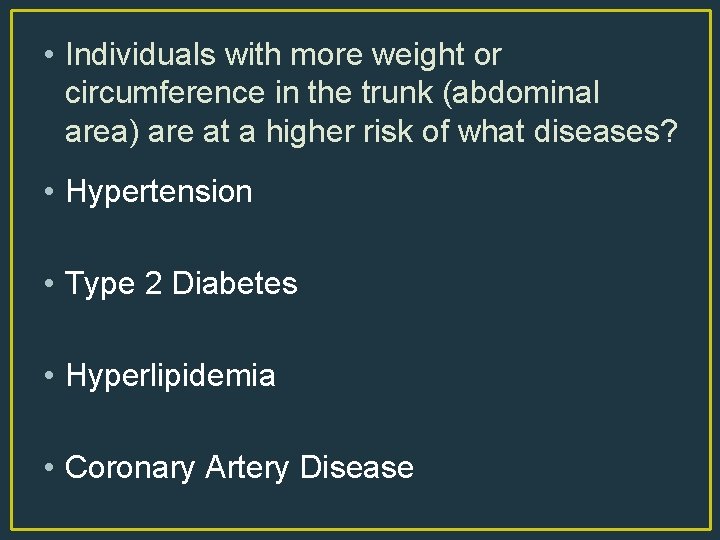
• Individuals with more weight or circumference in the trunk (abdominal area) are at a higher risk of what diseases? • Hypertension • Type 2 Diabetes • Hyperlipidemia • Coronary Artery Disease
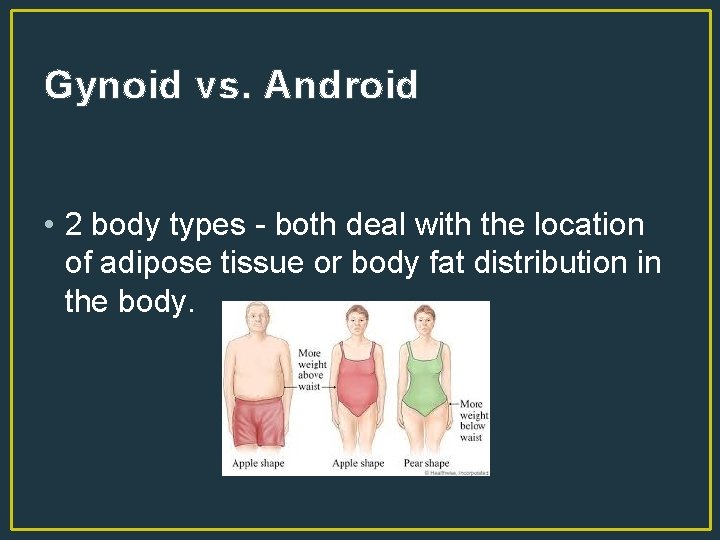
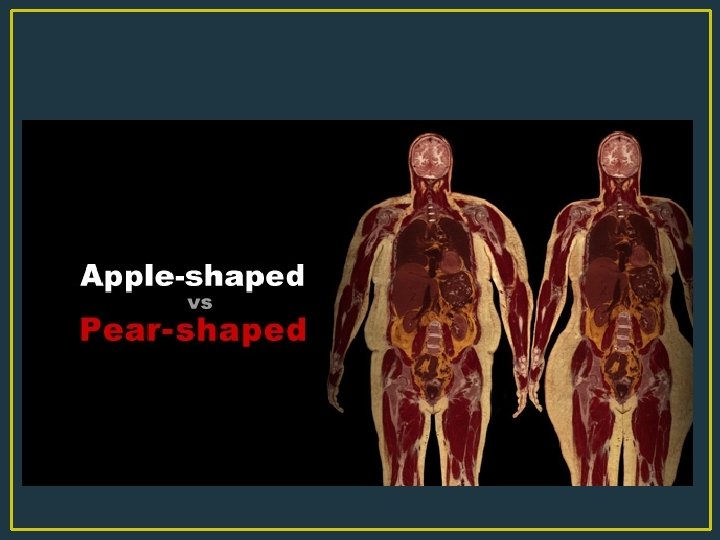
Gynoid vs. Android • 2 body types - both deal with the location of adipose tissue or body fat distribution in the body.
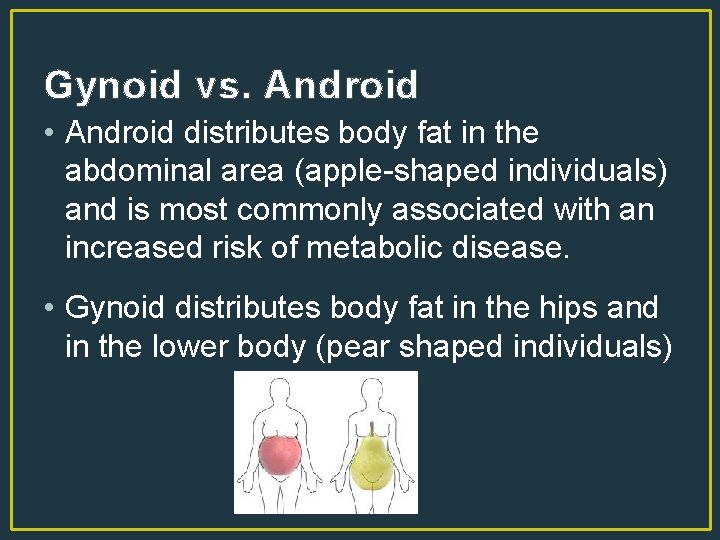
Gynoid vs. Android • Android distributes body fat in the abdominal area (apple-shaped individuals) and is most commonly associated with an increased risk of metabolic disease. • Gynoid distributes body fat in the hips and in the lower body (pear shaped individuals)
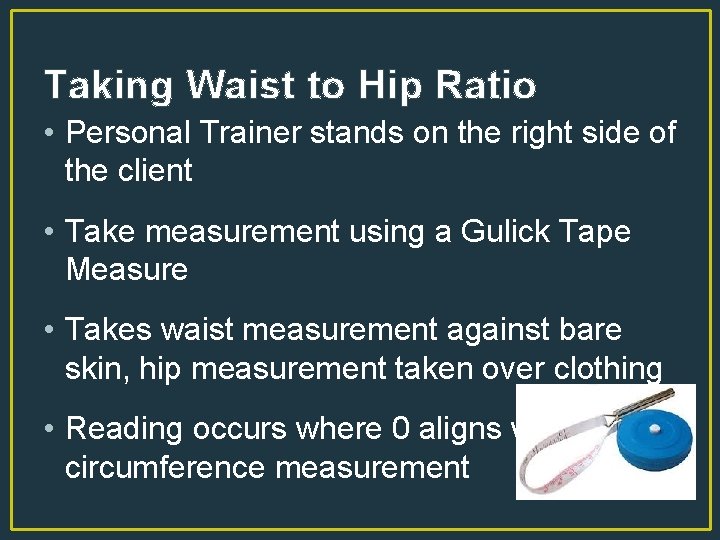
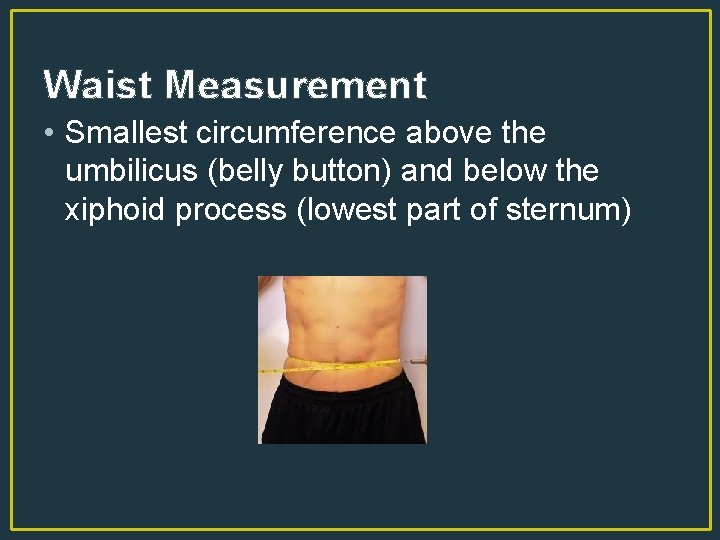
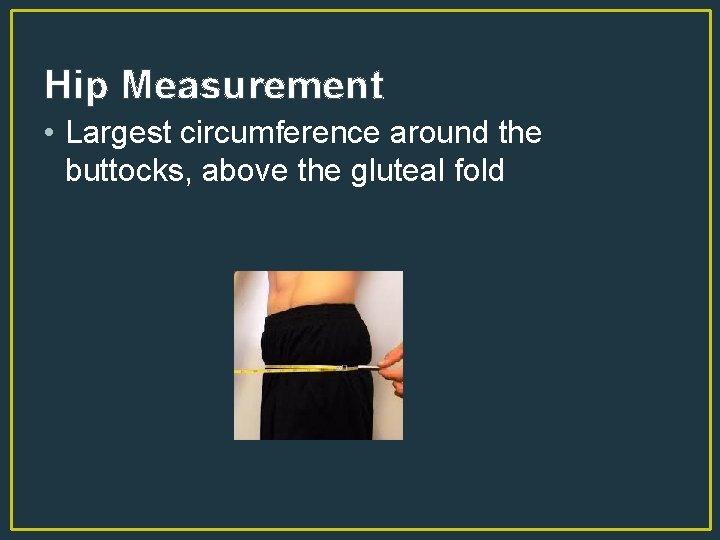
Taking Waist to Hip Ratio • Personal Trainer stands on the right side of the client • Take measurement using a Gulick Tape Measure • Takes waist measurement against bare skin, hip measurement taken over clothing • Reading occurs where 0 aligns with circumference measurement
Waist Measurement • Smallest circumference above the umbilicus (belly button) and below the xiphoid process (lowest part of sternum)
Hip Measurement • Largest circumference around the buttocks, above the gluteal fold
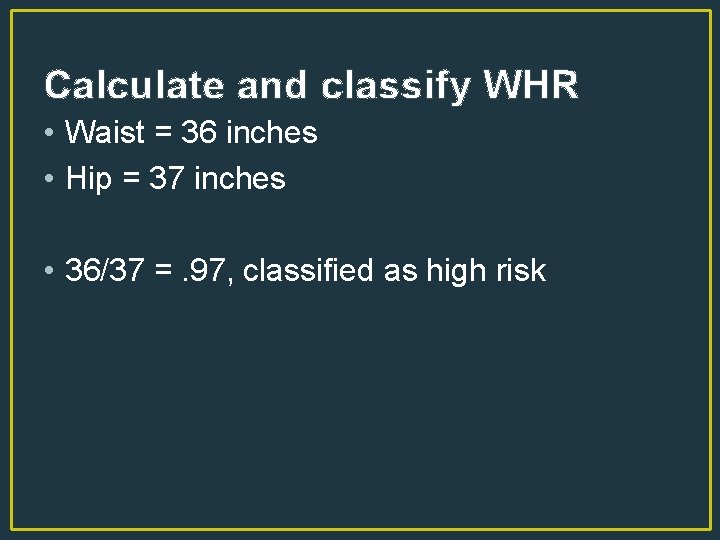
Calculate and classify WHR • Waist = 36 inches • Hip = 37 inches • 36/37 =. 97, classified as high risk
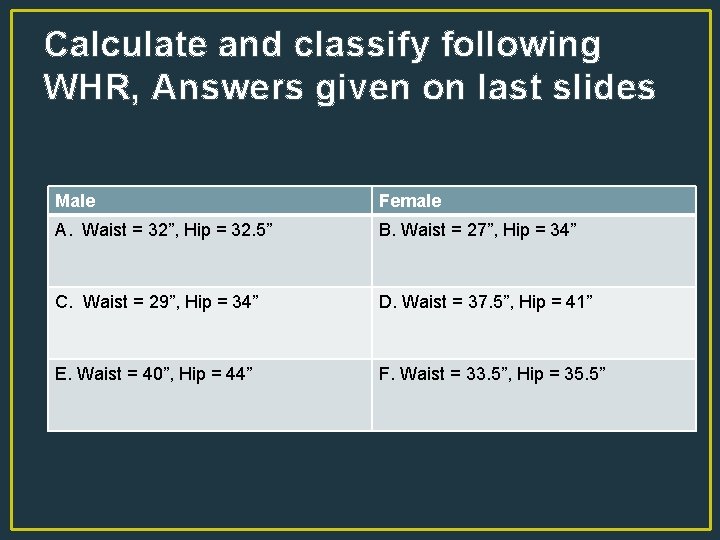
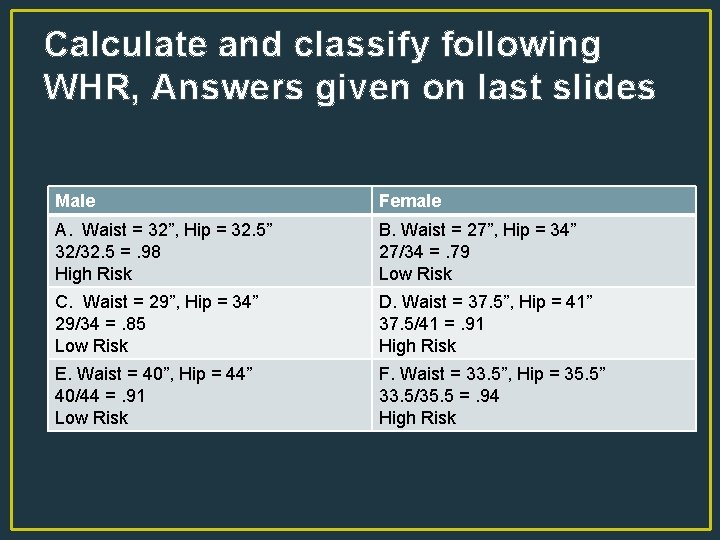
Calculate and classify following WHR, Answers given on last slides Male Female A. Waist = 32”, Hip = 32. 5” B. Waist = 27”, Hip = 34” C. Waist = 29”, Hip = 34” D. Waist = 37. 5”, Hip = 41” E. Waist = 40”, Hip = 44” F. Waist = 33. 5”, Hip = 35. 5”
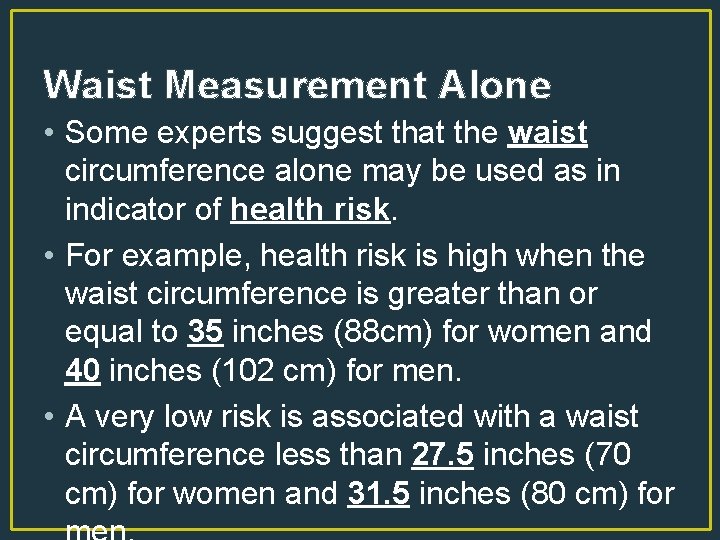
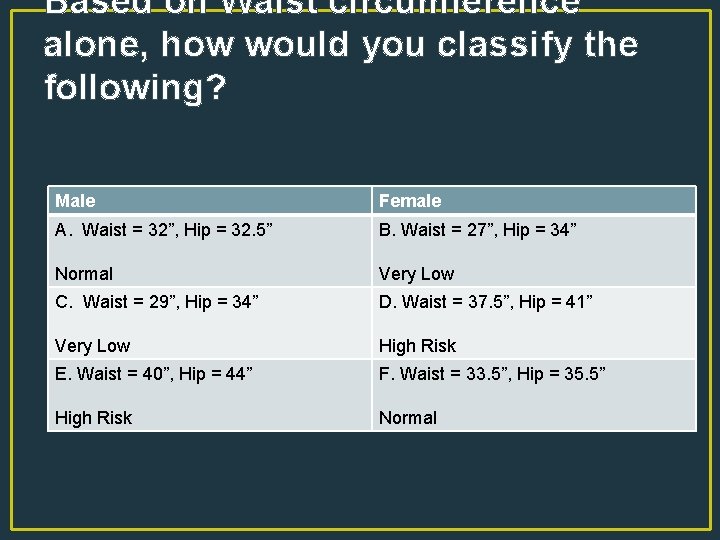
Waist Measurement Alone • Some experts suggest that the waist circumference alone may be used as in indicator of health risk. • For example, health risk is high when the waist circumference is greater than or equal to 35 inches (88 cm) for women and 40 inches (102 cm) for men. • A very low risk is associated with a waist circumference less than 27. 5 inches (70 cm) for women and 31. 5 inches (80 cm) for
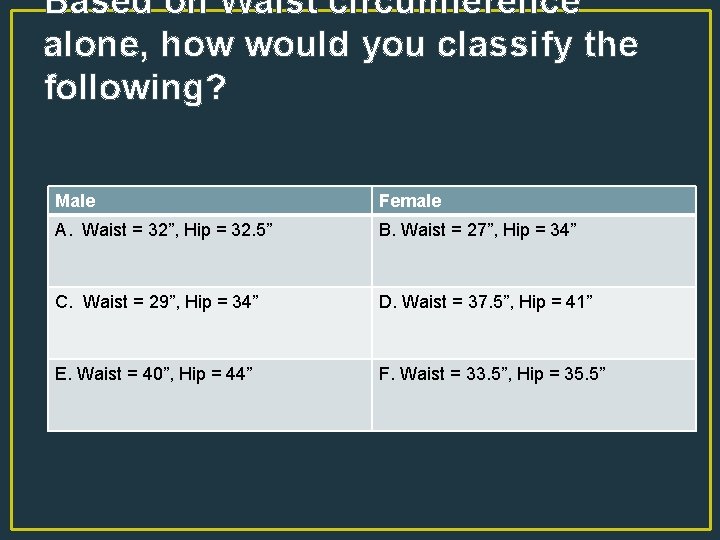
Based on Waist circumference alone, how would you classify the following? Male Female A. Waist = 32”, Hip = 32. 5” B. Waist = 27”, Hip = 34” C. Waist = 29”, Hip = 34” D. Waist = 37. 5”, Hip = 41” E. Waist = 40”, Hip = 44” F. Waist = 33. 5”, Hip = 35. 5”
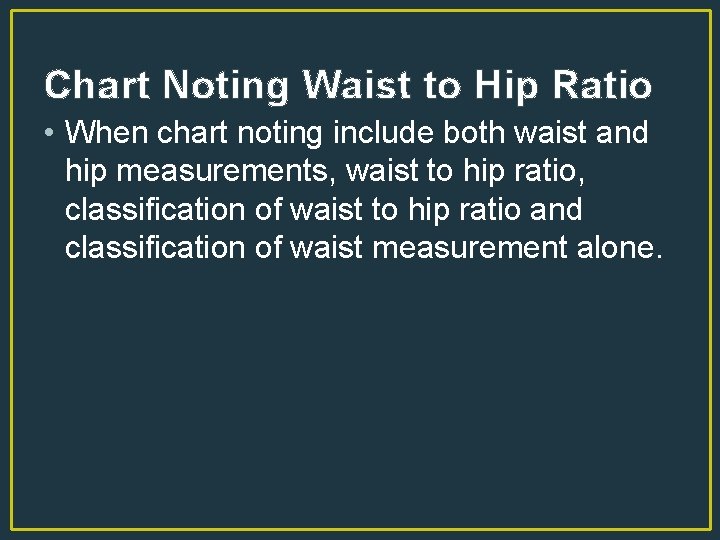
Chart Noting Waist to Hip Ratio • When chart noting include both waist and hip measurements, waist to hip ratio, classification of waist to hip ratio and classification of waist measurement alone.
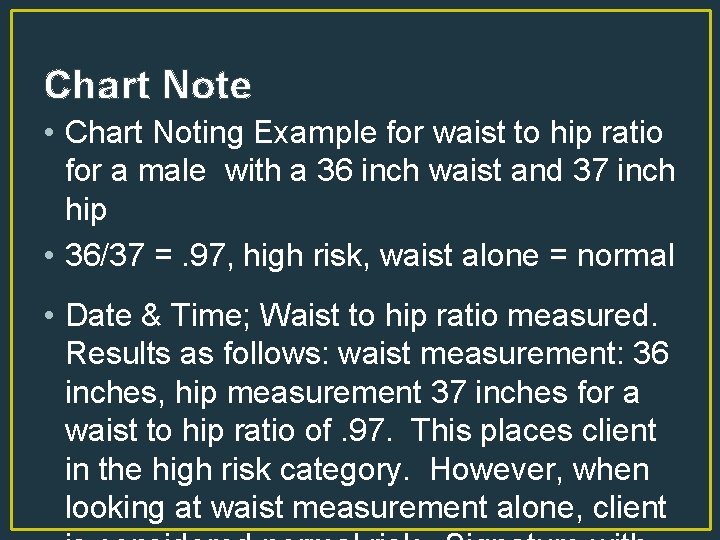
Chart Note • Chart Noting Example for waist to hip ratio for a male with a 36 inch waist and 37 inch hip • 36/37 =. 97, high risk, waist alone = normal • Date & Time; Waist to hip ratio measured. Results as follows: waist measurement: 36 inches, hip measurement 37 inches for a waist to hip ratio of. 97. This places client in the high risk category. However, when looking at waist measurement alone, client
Skinfold Caliper Measurements • Utilizes caliper measurements to determine amount of subcutaneous fat found on body to estimate total percent body fat
Bioelectrical Impedance • Less invasive method for measuring body fat. Uses a small electrical current measure fat free mass and fat mass
Hydrostatic Weighing • A technique used to determine percent body fat. The individual is weighed while fully submerged in water. Considered the gold standard when determining percent body fat.
BOD-POD Measurement • Technique used to measure percent body fat. Uses air displacement to determine the amount of muscle and fat an individual has on their body. Costs approximately $30, 000 for the machine.
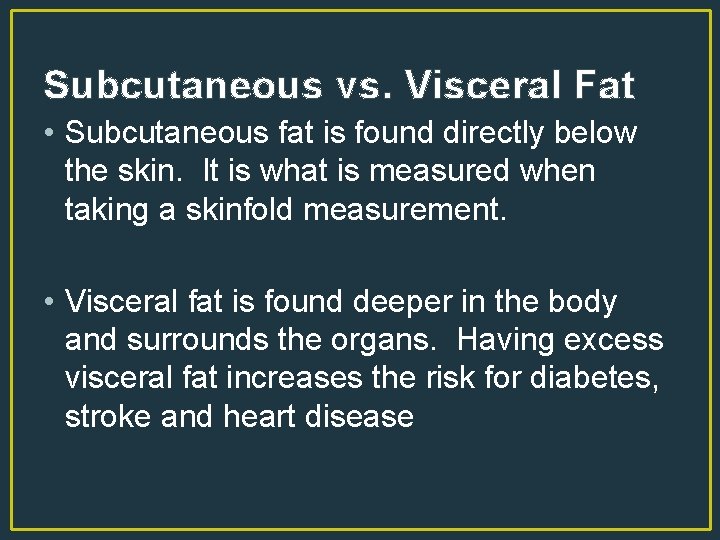
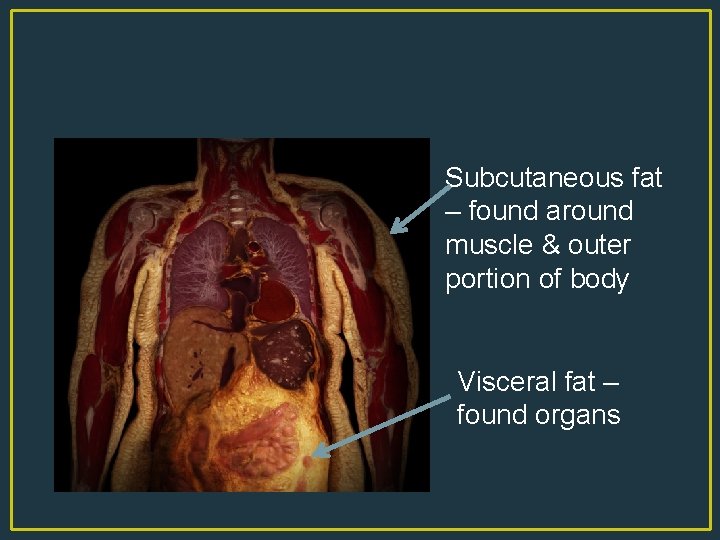
Subcutaneous vs. Visceral Fat • Subcutaneous fat is found directly below the skin. It is what is measured when taking a skinfold measurement. • Visceral fat is found deeper in the body and surrounds the organs. Having excess visceral fat increases the risk for diabetes, stroke and heart disease
Subcutaneous fat – found around muscle & outer portion of body Visceral fat – found organs
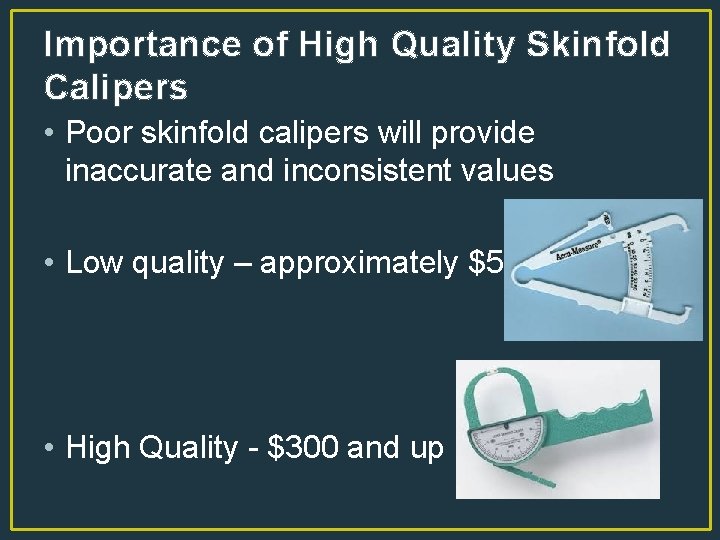
Importance of High Quality Skinfold Calipers • Poor skinfold calipers will provide inaccurate and inconsistent values • Low quality – approximately $50 • High Quality - $300 and up
Taking Skinfold Measurements • When taking skinfold caliper measurements all measurements are taken on the right side of the body. • Clients are instructed to flex the muscle below the site to help distinguish muscle from fat.
Taking Skinfold Measurements • Calipers should be placed directly on the skin 1 cm away from the thumb and finger, perpendicular to the skinfold, and halfway between the crest and the base of the fold. • Pinch should be maintained while reading the caliper.
Taking Skinfold Measurements • Wait 1 to 2 seconds before reading the caliper. • Take duplicate measures at each site and retest if duplicate measurements are not within 1 to 2 mm. • Rotate through measurement sites or allow time for skin to regain normal texture and thickness.
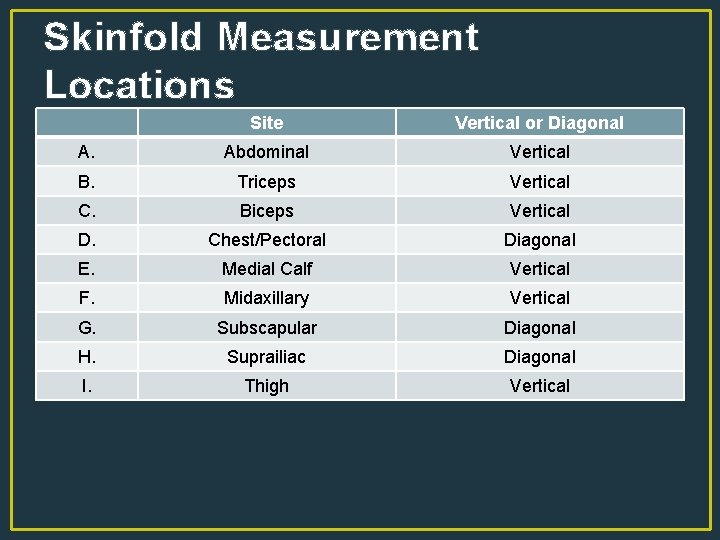
Skinfold Measurement Locations Site Vertical or Diagonal A. Abdominal Vertical B. Triceps Vertical C. Biceps Vertical D. Chest/Pectoral Diagonal E. Medial Calf Vertical F. Midaxillary Vertical G. Subscapular Diagonal H. Suprailiac Diagonal I. Thigh Vertical
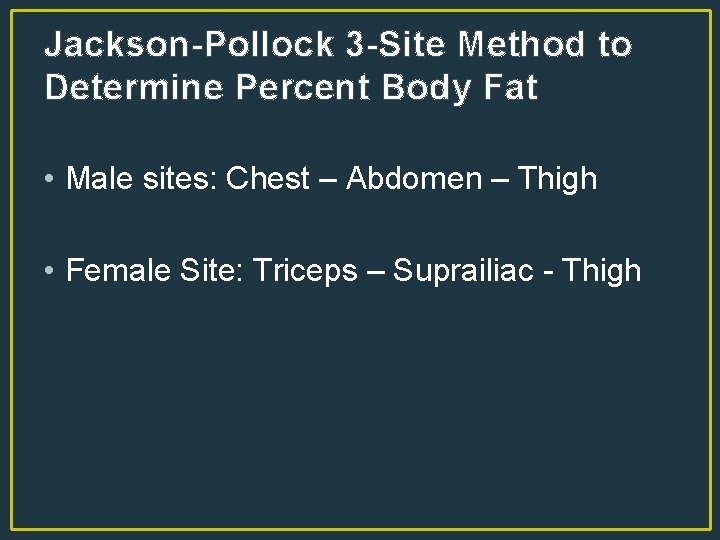
Jackson-Pollock 3 -Site Method to Determine Percent Body Fat • Male sites: Chest – Abdomen – Thigh • Female Site: Triceps – Suprailiac - Thigh
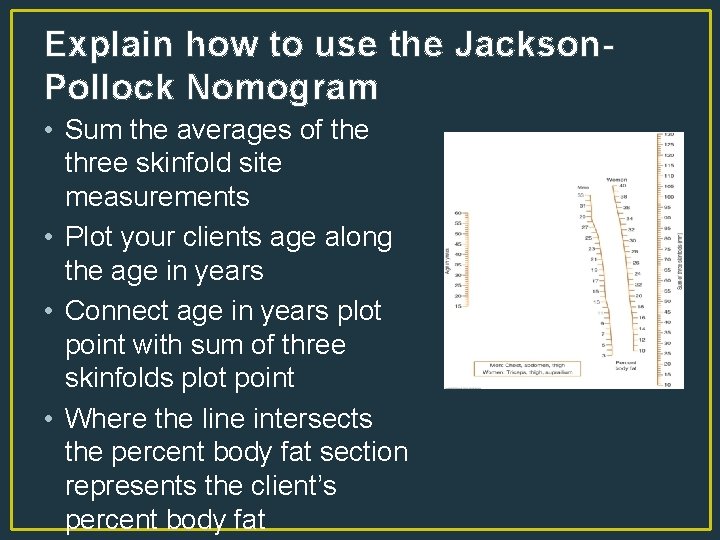
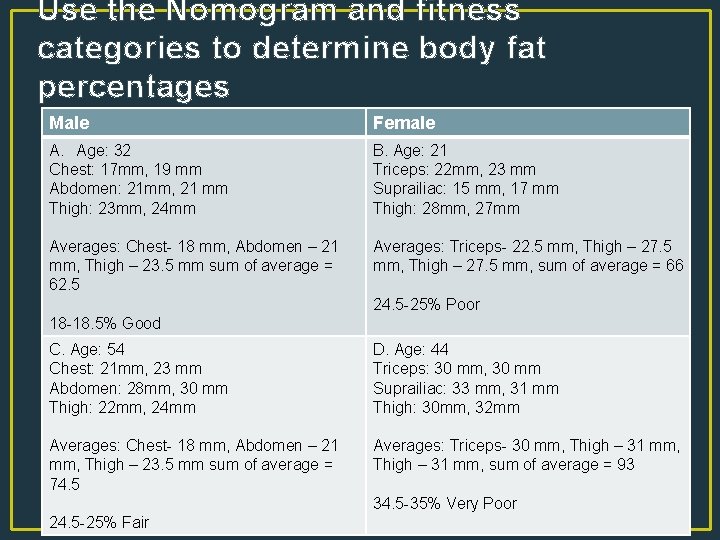
Explain how to use the Jackson. Pollock Nomogram • Sum the averages of the three skinfold site measurements • Plot your clients age along the age in years • Connect age in years plot point with sum of three skinfolds plot point • Where the line intersects the percent body fat section represents the client’s percent body fat
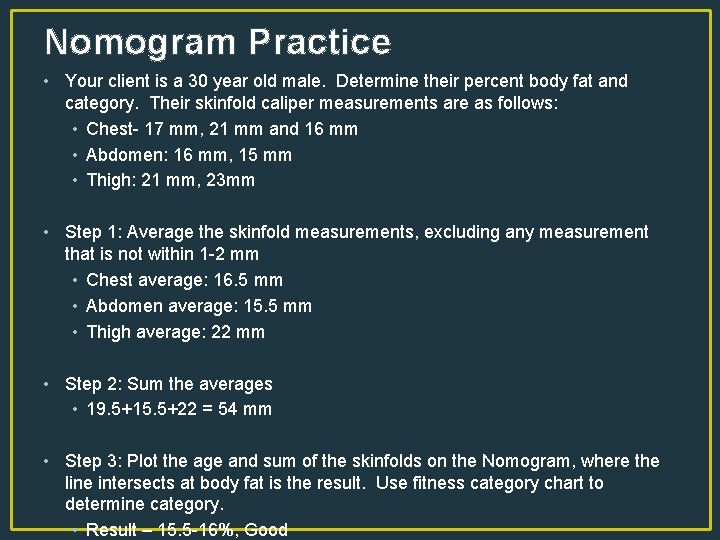
Nomogram Practice • Your client is a 30 year old male. Determine their percent body fat and category. Their skinfold caliper measurements are as follows: • Chest- 17 mm, 21 mm and 16 mm • Abdomen: 16 mm, 15 mm • Thigh: 21 mm, 23 mm • Step 1: Average the skinfold measurements, excluding any measurement that is not within 1 -2 mm • Chest average: 16. 5 mm • Abdomen average: 15. 5 mm • Thigh average: 22 mm • Step 2: Sum the averages • 19. 5+15. 5+22 = 54 mm • Step 3: Plot the age and sum of the skinfolds on the Nomogram, where the line intersects at body fat is the result. Use fitness category chart to determine category. • Result – 15. 5 -16%, Good
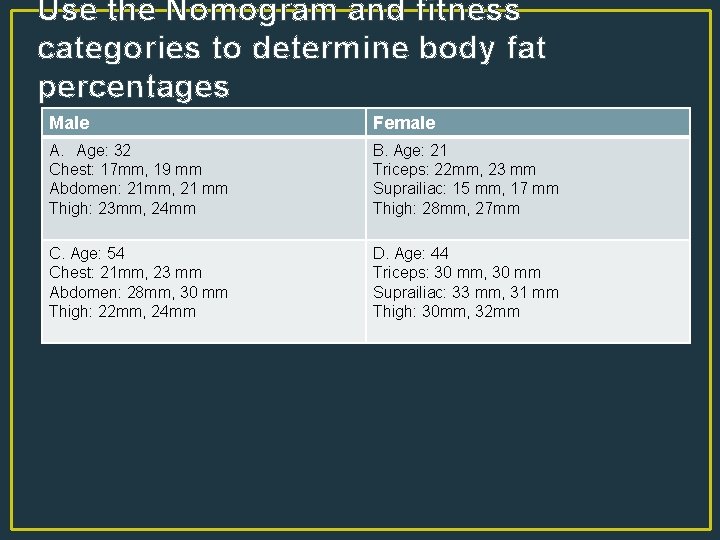
Use the Nomogram and fitness categories to determine body fat percentages Male Female A. Age: 32 Chest: 17 mm, 19 mm Abdomen: 21 mm, 21 mm Thigh: 23 mm, 24 mm B. Age: 21 Triceps: 22 mm, 23 mm Suprailiac: 15 mm, 17 mm Thigh: 28 mm, 27 mm C. Age: 54 Chest: 21 mm, 23 mm Abdomen: 28 mm, 30 mm Thigh: 22 mm, 24 mm D. Age: 44 Triceps: 30 mm, 30 mm Suprailiac: 33 mm, 31 mm Thigh: 30 mm, 32 mm
Chart Noting Percent Body Fat • When chart noting, include the average of each skinfold site in mm, the sum of the averages in mm, percent body fat and fitness category.
• Chart Note results for 30 year old male client, chest average – 16. 5 mm, Abdomen average – 15. 5 mm, thigh average – 22 mm, sum of 54 mm, % body fat 15. 5% good category. • Date, Time; Client’s percent body fat measured via skinfold calipers. Results are as follows: chest 16. 5 mm, abdomen 15. 5 mm, thigh 22 mm for a total of 54 mm. Percent body fat is 15. 5% which places the client in the good category. Signature with title.
Bioelectrical Impedance • Bioelectrical Impedance is also known as BIA is a noninvasive and easy to administer method for assessing body composition. • A bioelectrical impedance analyzer passes a small electrical current into the body and then measures the resistance to that current.
Bioelectrical Impedance • The theory behind BIA is that fat is a poor electrical conductor containing little water (14 to 22%) whereas lean tissue contains mostly water (more than 90%) and electrolytes and is a good electrical conductor.
Advantages of Bioelectrical Impedance • No physical discomfort associated with the procedure • Clients will feel less self-conscious as minimal skin exposure is required
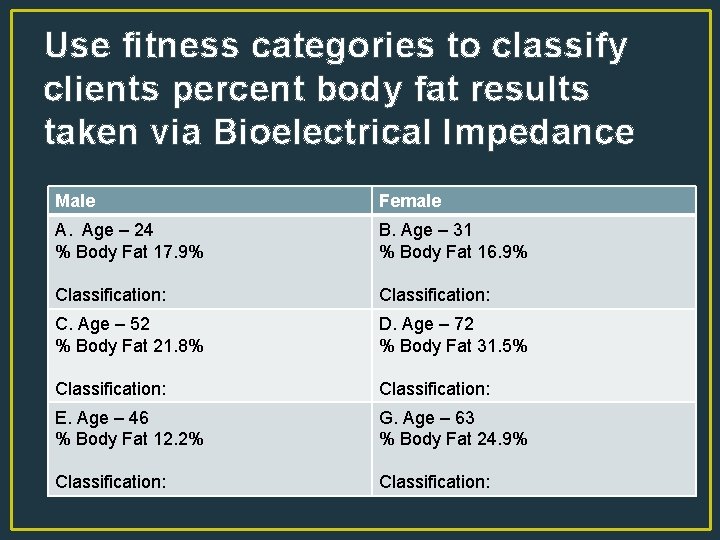
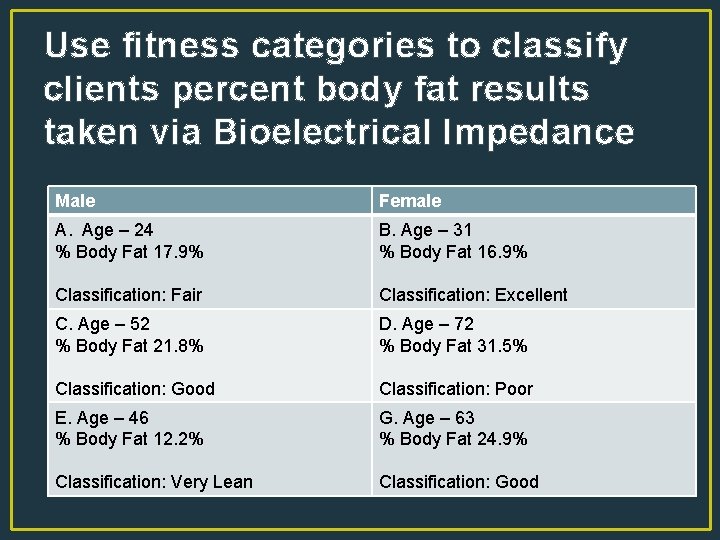
Use fitness categories to classify clients percent body fat results taken via Bioelectrical Impedance Male Female A. Age – 24 % Body Fat 17. 9% B. Age – 31 % Body Fat 16. 9% Classification: C. Age – 52 % Body Fat 21. 8% D. Age – 72 % Body Fat 31. 5% Classification: E. Age – 46 % Body Fat 12. 2% G. Age – 63 % Body Fat 24. 9% Classification:
Chart Noting Percent Body Fat • When chart noting, include percent body fat taken via bioelectrical impedance and fitness category.
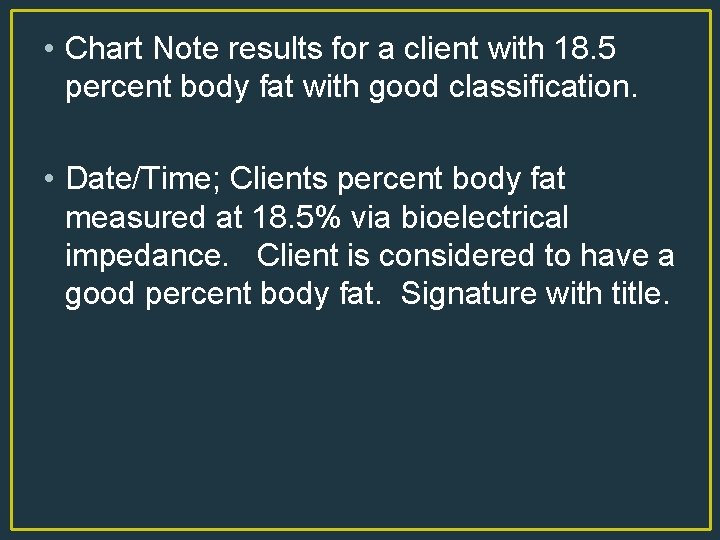
• Chart Note results for a client with 18. 5 percent body fat with good classification. • Date/Time; Clients percent body fat measured at 18. 5% via bioelectrical impedance. Client is considered to have a good percent body fat. Signature with title.
Fat Mass and Lean Body Mass • Fat mass is the amount of fat tissue found on an individual. Lean body mass is remaining part of body - muscles, bones, nervous tissue, skin, blood and organs. Determined by subtracting fat mass from total body weight.
Calculating Fat Mass and Lean Body Mass • Once percent body fat is determined fat mass and lean body mass can be calculated. • To determine fat mass multiply the individual’s current weight by the percent body fat. • For example is an individual weighs 100 pounds and has 10% body fat then the
Calculating Fat Mass and Lean Body Mass • To determine lean body mass subtract the amount of fat mass from the individuals weight. • From the example above, an individual weighs 100 pounds and has 10% body fat then the person has 10 pounds of fat mass. • Then subtract 10 pounds of fat for 90 pounds of lean body mass.
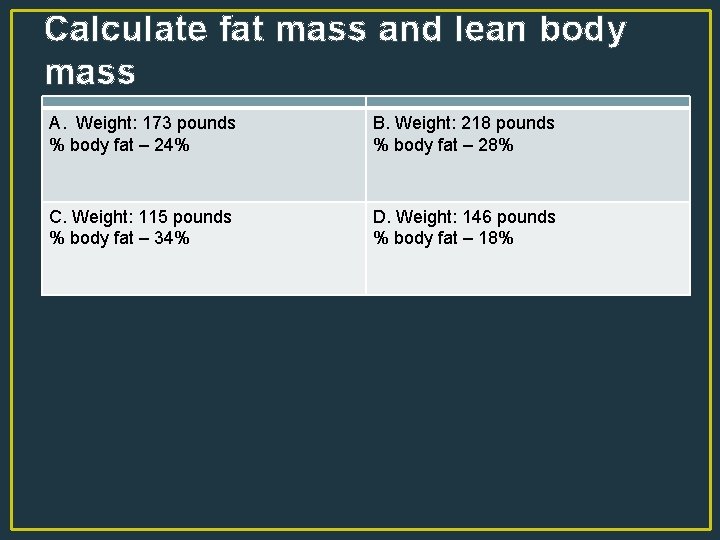
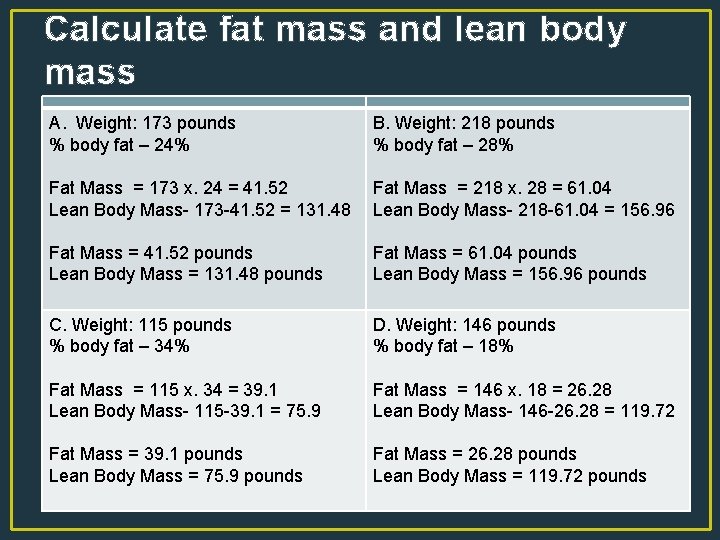
Calculate fat mass and lean body mass A. Weight: 173 pounds % body fat – 24% B. Weight: 218 pounds % body fat – 28% C. Weight: 115 pounds % body fat – 34% D. Weight: 146 pounds % body fat – 18%
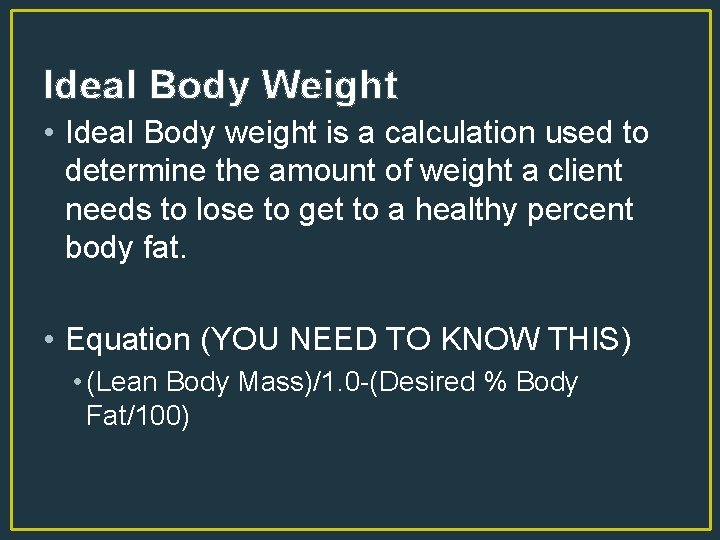
Ideal Body Weight • Ideal Body weight is a calculation used to determine the amount of weight a client needs to lose to get to a healthy percent body fat. • Equation (YOU NEED TO KNOW THIS) • (Lean Body Mass)/1. 0 -(Desired % Body Fat/100)
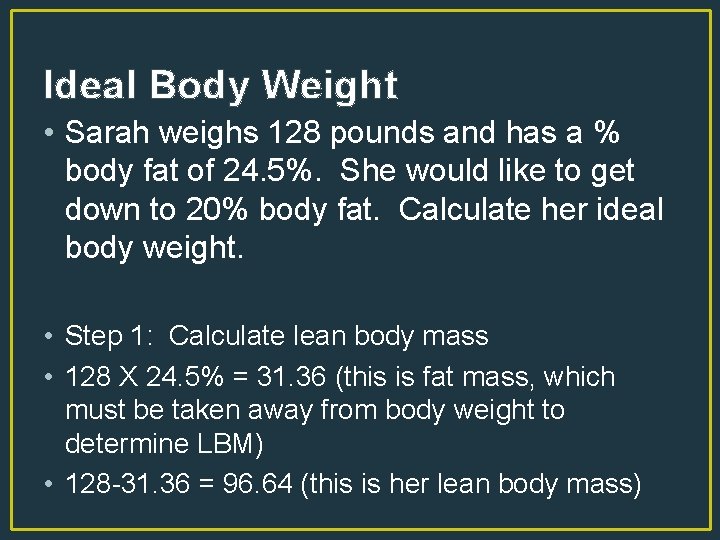
Ideal Body Weight • Sarah weighs 128 pounds and has a % body fat of 24. 5%. She would like to get down to 20% body fat. Calculate her ideal body weight. • Step 1: Calculate lean body mass • 128 X 24. 5% = 31. 36 (this is fat mass, which must be taken away from body weight to determine LBM) • 128 -31. 36 = 96. 64 (this is her lean body mass)
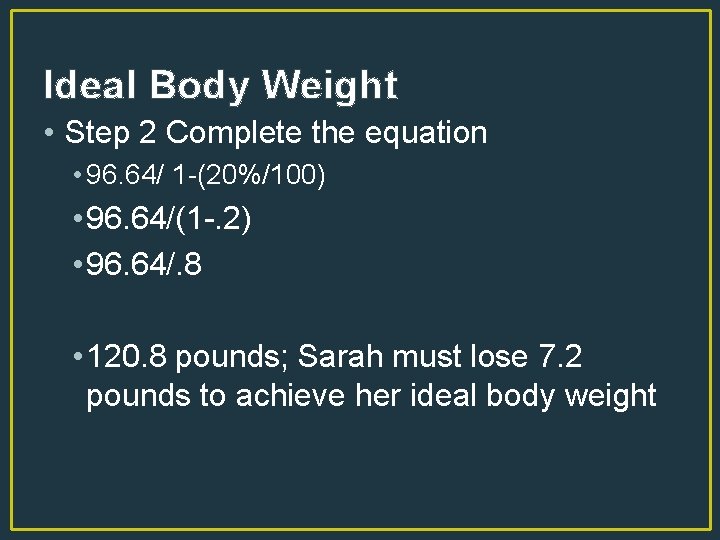
Ideal Body Weight • Step 2 Complete the equation • 96. 64/ 1 -(20%/100) • 96. 64/(1 -. 2) • 96. 64/. 8 • 120. 8 pounds; Sarah must lose 7. 2 pounds to achieve her ideal body weight
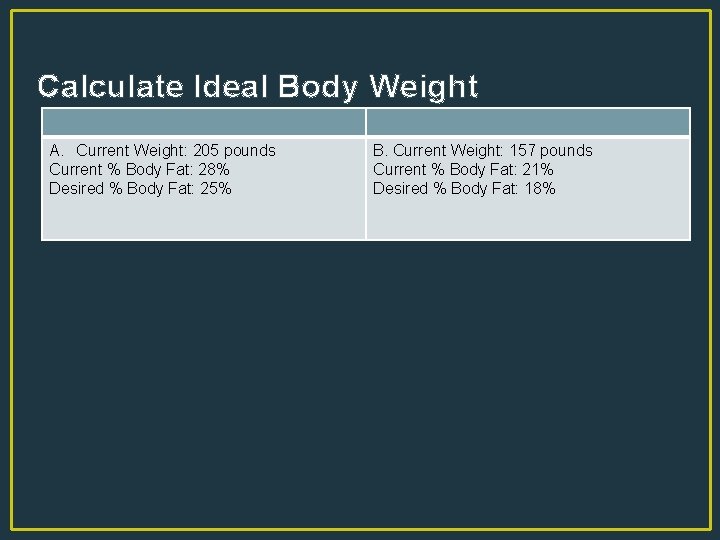
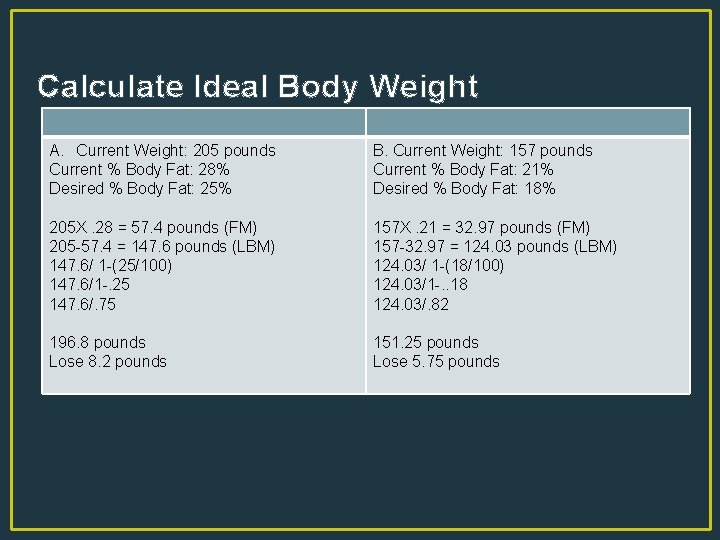
Calculate Ideal Body Weight A. Current Weight: 205 pounds Current % Body Fat: 28% Desired % Body Fat: 25% B. Current Weight: 157 pounds Current % Body Fat: 21% Desired % Body Fat: 18%
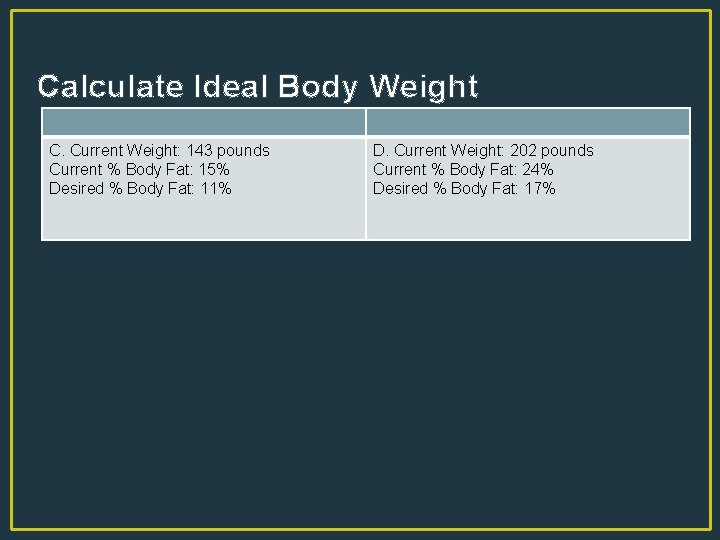
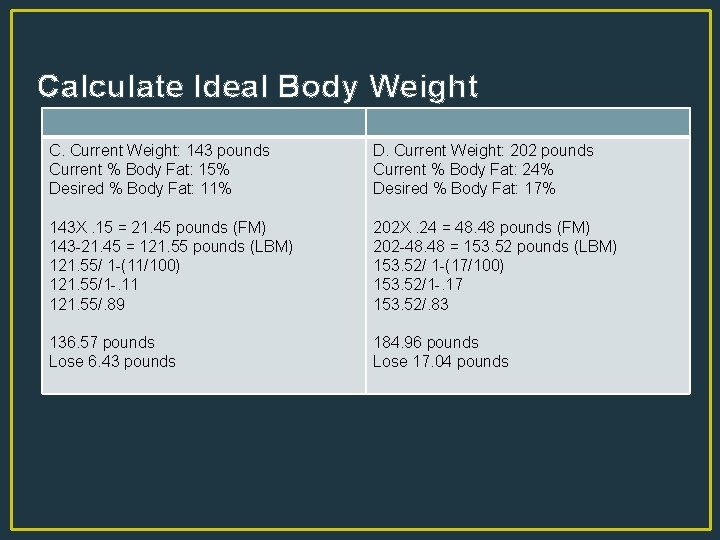
Calculate Ideal Body Weight C. Current Weight: 143 pounds Current % Body Fat: 15% Desired % Body Fat: 11% D. Current Weight: 202 pounds Current % Body Fat: 24% Desired % Body Fat: 17%
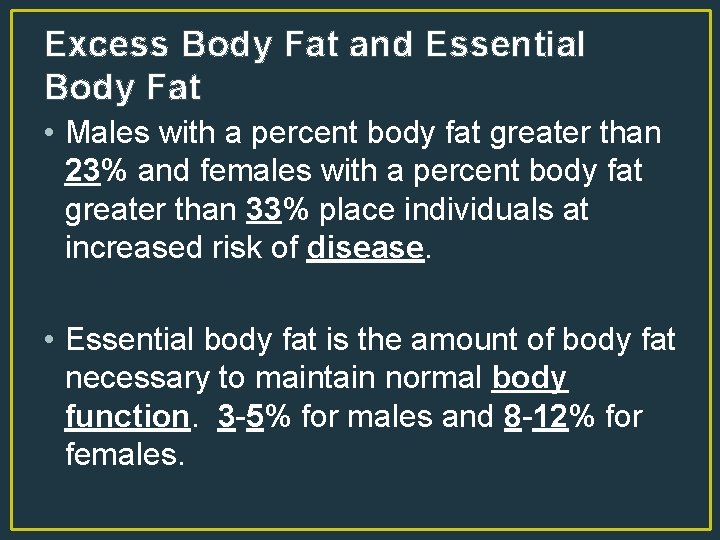
Excess Body Fat and Essential Body Fat • Males with a percent body fat greater than 23% and females with a percent body fat greater than 33% place individuals at increased risk of disease. • Essential body fat is the amount of body fat necessary to maintain normal body function. 3 -5% for males and 8 -12% for females.
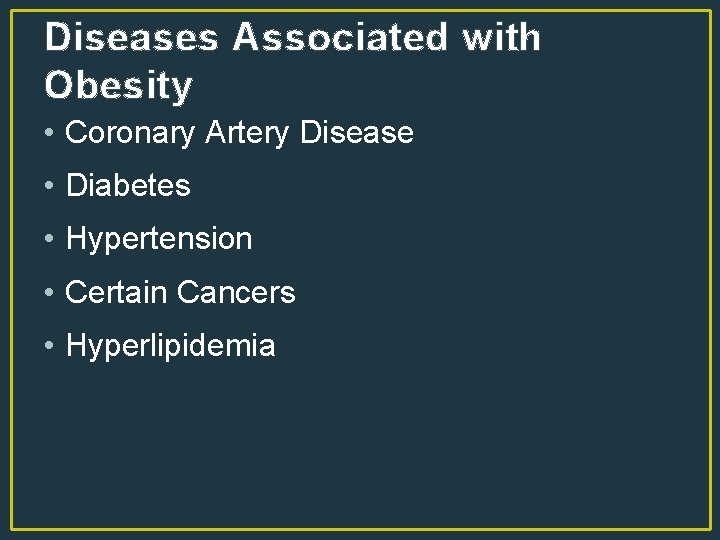
Diseases Associated with Obesity • Coronary Artery Disease • Diabetes • Hypertension • Certain Cancers • Hyperlipidemia
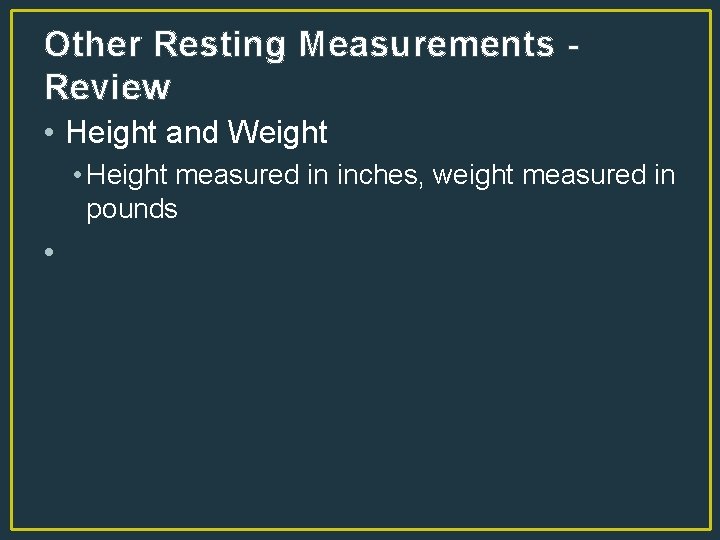
Other Resting Measurements Review • Height and Weight • Height measured in inches, weight measured in pounds •
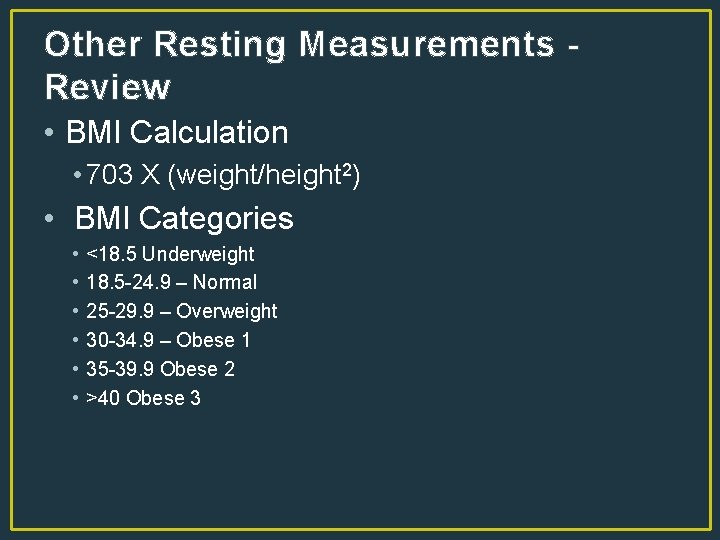
Other Resting Measurements Review • BMI Calculation • 703 X (weight/height 2) • BMI Categories • • • <18. 5 Underweight 18. 5 -24. 9 – Normal 25 -29. 9 – Overweight 30 -34. 9 – Obese 1 35 -39. 9 Obese 2 >40 Obese 3
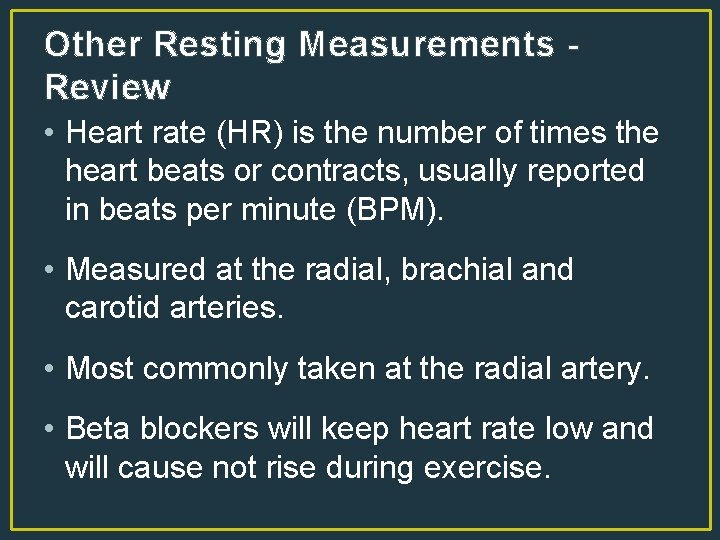
Other Resting Measurements Review • Heart rate (HR) is the number of times the heart beats or contracts, usually reported in beats per minute (BPM). • Measured at the radial, brachial and carotid arteries. • Most commonly taken at the radial artery. • Beta blockers will keep heart rate low and will cause not rise during exercise.
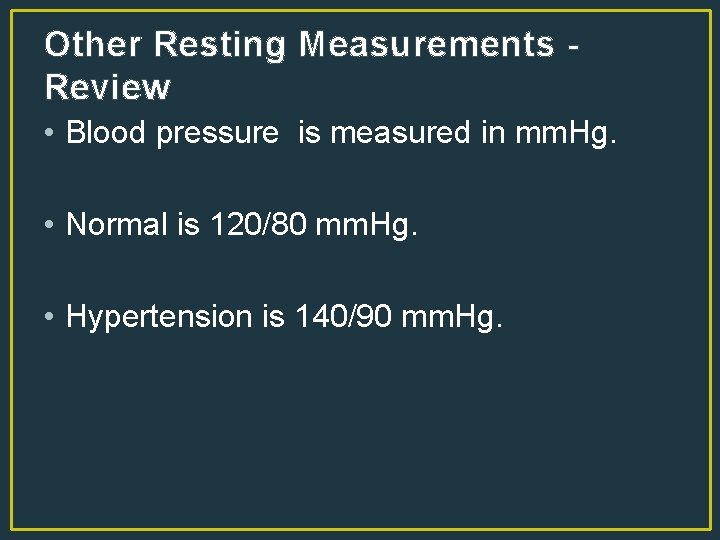
Other Resting Measurements Review • Blood pressure is measured in mm. Hg. • Normal is 120/80 mm. Hg. • Hypertension is 140/90 mm. Hg.
Fitness Assessments Answer Key
Calculate and classify following WHR, Answers given on last slides Male Female A. Waist = 32”, Hip = 32. 5” 32/32. 5 =. 98 High Risk B. Waist = 27”, Hip = 34” 27/34 =. 79 Low Risk C. Waist = 29”, Hip = 34” 29/34 =. 85 Low Risk D. Waist = 37. 5”, Hip = 41” 37. 5/41 =. 91 High Risk E. Waist = 40”, Hip = 44” 40/44 =. 91 Low Risk F. Waist = 33. 5”, Hip = 35. 5” 33. 5/35. 5 =. 94 High Risk
Based on Waist circumference alone, how would you classify the following? Male Female A. Waist = 32”, Hip = 32. 5” B. Waist = 27”, Hip = 34” Normal Very Low C. Waist = 29”, Hip = 34” D. Waist = 37. 5”, Hip = 41” Very Low High Risk E. Waist = 40”, Hip = 44” F. Waist = 33. 5”, Hip = 35. 5” High Risk Normal
Use the Nomogram and fitness categories to determine body fat percentages Male Female A. Age: 32 Chest: 17 mm, 19 mm Abdomen: 21 mm, 21 mm Thigh: 23 mm, 24 mm B. Age: 21 Triceps: 22 mm, 23 mm Suprailiac: 15 mm, 17 mm Thigh: 28 mm, 27 mm Averages: Chest- 18 mm, Abdomen – 21 mm, Thigh – 23. 5 mm sum of average = 62. 5 Averages: Triceps- 22. 5 mm, Thigh – 27. 5 mm, sum of average = 66 24. 5 -25% Poor 18 -18. 5% Good C. Age: 54 Chest: 21 mm, 23 mm Abdomen: 28 mm, 30 mm Thigh: 22 mm, 24 mm D. Age: 44 Triceps: 30 mm, 30 mm Suprailiac: 33 mm, 31 mm Thigh: 30 mm, 32 mm Averages: Chest- 18 mm, Abdomen – 21 mm, Thigh – 23. 5 mm sum of average = 74. 5 Averages: Triceps- 30 mm, Thigh – 31 mm, sum of average = 93 34. 5 -35% Very Poor 24. 5 -25% Fair
Use fitness categories to classify clients percent body fat results taken via Bioelectrical Impedance Male Female A. Age – 24 % Body Fat 17. 9% B. Age – 31 % Body Fat 16. 9% Classification: Fair Classification: Excellent C. Age – 52 % Body Fat 21. 8% D. Age – 72 % Body Fat 31. 5% Classification: Good Classification: Poor E. Age – 46 % Body Fat 12. 2% G. Age – 63 % Body Fat 24. 9% Classification: Very Lean Classification: Good
Calculate fat mass and lean body mass A. Weight: 173 pounds % body fat – 24% B. Weight: 218 pounds % body fat – 28% Fat Mass = 173 x. 24 = 41. 52 Lean Body Mass- 173 -41. 52 = 131. 48 Fat Mass = 218 x. 28 = 61. 04 Lean Body Mass- 218 -61. 04 = 156. 96 Fat Mass = 41. 52 pounds Lean Body Mass = 131. 48 pounds Fat Mass = 61. 04 pounds Lean Body Mass = 156. 96 pounds C. Weight: 115 pounds % body fat – 34% D. Weight: 146 pounds % body fat – 18% Fat Mass = 115 x. 34 = 39. 1 Lean Body Mass- 115 -39. 1 = 75. 9 Fat Mass = 146 x. 18 = 26. 28 Lean Body Mass- 146 -26. 28 = 119. 72 Fat Mass = 39. 1 pounds Lean Body Mass = 75. 9 pounds Fat Mass = 26. 28 pounds Lean Body Mass = 119. 72 pounds
Calculate Ideal Body Weight A. Current Weight: 205 pounds Current % Body Fat: 28% Desired % Body Fat: 25% B. Current Weight: 157 pounds Current % Body Fat: 21% Desired % Body Fat: 18% 205 X. 28 = 57. 4 pounds (FM) 205 -57. 4 = 147. 6 pounds (LBM) 147. 6/ 1 -(25/100) 147. 6/1 -. 25 147. 6/. 75 157 X. 21 = 32. 97 pounds (FM) 157 -32. 97 = 124. 03 pounds (LBM) 124. 03/ 1 -(18/100) 124. 03/1 -. . 18 124. 03/. 82 196. 8 pounds Lose 8. 2 pounds 151. 25 pounds Lose 5. 75 pounds
Calculate Ideal Body Weight C. Current Weight: 143 pounds Current % Body Fat: 15% Desired % Body Fat: 11% D. Current Weight: 202 pounds Current % Body Fat: 24% Desired % Body Fat: 17% 143 X. 15 = 21. 45 pounds (FM) 143 -21. 45 = 121. 55 pounds (LBM) 121. 55/ 1 -(11/100) 121. 55/1 -. 11 121. 55/. 89 202 X. 24 = 48. 48 pounds (FM) 202 -48. 48 = 153. 52 pounds (LBM) 153. 52/ 1 -(17/100) 153. 52/1 -. 17 153. 52/. 83 136. 57 pounds Lose 6. 43 pounds 184. 96 pounds Lose 17. 04 pounds