Fisheries Management I Renewable and Nonrenewable Resources II

Fisheries Management I. Renewable and Nonrenewable Resources II. Maximum Sustainable Yield III. IV. A. Schaefer Model V. B. Beverton-Holt Model III. Resource Limited Population IV. Practical and Theoretical Problems

Renewable and Nonrenewable Resources I. Geological Resources are Nonrenewable II. Biological Resources III. A. If managed properly, they can be Renewable B. If managed improperly, they become Nonrenewable

Renewable and Nonrenewable Resources Copper Petroleum Soils Dodo

Renewable and Nonrenewable Resources

Maximum Sustainable Yield I. Schaefer Model II. Relates Fish Catch to Fishing Effor II. Beverton-Holt Model III. Relates Fish Catch to Fish Population Dynamics
")
Schaefer Model Underfishing Overfishing (hours)
")
Schaefer Model Overfishing Underfishing (pounds/hour)

Beverton-Holt Model F

Beverton-Holt Model F

Beverton-Holt Model Schaefer FModel

Beverton-Holt Model: Application to a Resource-Limited Population Mortality declines with fishing because: 1. Caught fish don’t die 2. a natural death; F 2. A fished population is 3. a younger population, with a lower death rate; 3. Individuals in a fished 4. population have access more resources, so they are healthier and have a lower death rate.

Beverton-Holt Model: Application to a Resource-Limited Population Gross Production declines with fishing less rapidly than M declines because: F 1. Individuals in a fished 2. population have access to more resources, so they grow faster and have higher fecundity.

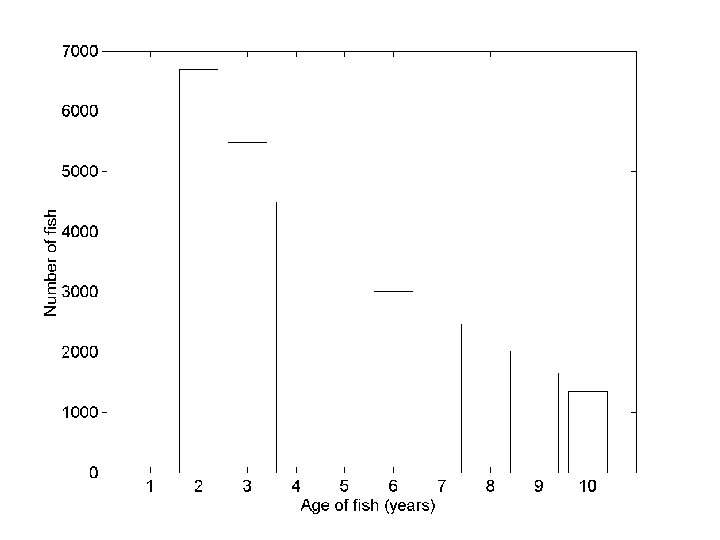
Table 4. 1. Probability of Survival for a Fish Recruited at Age Two and with an 80% Chance of Surviving Each Subsequent Year of Life Age of fish Probability that fish will reach the given age (%) 2 100 3 80 4 64 5 51 6 7 8 9 10 41 33 26 21 17
 Determination")
Practical and Theoretical Problems I. Practical Problems Determination of Population Parameters (Beverton-Holt Model) Determination of Fishing Effort (Schaeffer Model)

OTOLITHS: Information that can be obtained from the analysis of otolith biomineralization patterns Age

OTOLITHS: Information that can be obtained from the analysis of otolith biomineralization patterns Age Spawn Date Hatch Date Metamorphosis Growth History


For Those Who May Be Interested: More information on otoliths can be found at http: //www. marinebiodiversity. ca/ otolith/english/daily. html

Population Size: Estimate by Tagging 18, 055 herring tagged and released Subsequent to release, 810, 000 fish surveyed 13 tags recovered (13/810, 000) = (18, 055/1. 12 x 109) Population size estimated at 1. 12 x 109 herring

Determination of Fishing Effort I. Units used to measure effort must be defined II. Type of fish-finding technology and fish-harvesting technology must be taken into account III. “I fish, therefore I lie” must be factored in

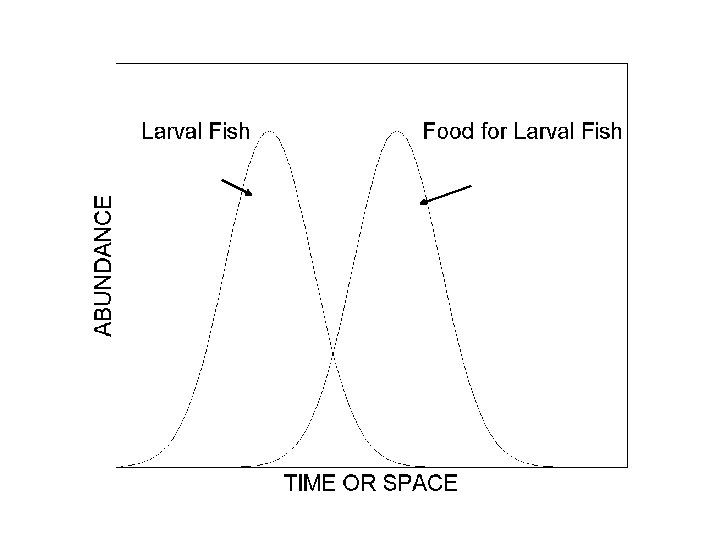
Theoretical Problems Variable Recruitment K and r Selection Stock Stability Effects of Competitors Recruitment - Reproduction Time Lag

Percentage contribution of year classes of Norwegian spring spawn herring to the adult stock from 1954 through 1962. The very good year class of 1950 began first appearing in significant numbers in 1954 and dominated the adult stock throughout this period.

rate of change =

Table 4. 2. Characteristics of r-selected and K-selected populations Environment r-selected K-selected variable and/or unpredictable constant and/or predictable Lifespan short long Growth rate fast slow Fecundity high low Natural mortality high low Population dynamics unstable

Stock Stability Fishing at 15% of MSY Fishing at 75% of MSY Fishing at 100% of MSY

Strategic Issues Economics Maximizing Yield How to Deal with Catch Variability

ECONOMICS

MAXIMIZING YIELD PER RECRUIT CLASS Table 4. 3. Example of effect of natural mortality and growth on yield of a year class Age Number of individuals Weight per individual Yield per recruit 3 1, 000 15 15. 000 4 900, 000 17 15. 300 5 810, 000 19 15. 390 6 729, 000 21 15. 309 7 656, 100 23 15. 090 8 590, 490 25 14. 762

How to Deal with Catch Variability The Canadian Cod Example: Fished to Commercial Extinction Before Establishment of a Moratorium: No Recovery of the Stock, No Recovery of the Fishery The Norwegian Cod Example: Moratorium Established in Response to Declining Catch: Stock Recovered, as did a Viable Fishery

HOW MANY FISH SHOULD WE CATCH? Given the uncertainties involved in estimating the maximum sustainable yield; and Given that the economics of attaining the maximum Sustainable yield don’t make sense; and Given that harvesting the maximum sustainable yield makes the population especially prone to collapse;

Stock Stability Fishing at 15% of MSY Fishing at 75% of MSY Fishing at 100% of MSY

HOW MANY FISH SHOULD WE CATCH? SUBSTANTIALLY LESS THAN THE MAXIMUM SUSTAINABLE YIELD!

Stock Stability Fishing at 15% of MSY Fishing at 75% of MSY Fishing at 100% of MSY

South African pilchard anchovy catches
- Slides: 37