Fish Ecology Species Diversity and Distribution Growth and

Fish Ecology Species Diversity and Distribution Growth and Spawning Population Dynamics Stocking

Species Diversity & Global Distribution • Marine biodiversity generally higher than freshwater. • ~70% of the earth covered by salt water, 1% freshwater • 97% of all water in the world is ocean (0. 009% freshwater) • Are there more marine or freshwater species of fish in the world? 58% of all species marine 41% freshwater 1% both (diadromous, euryhaline)

• More species on large than small continents. • Higher species richness in tropics. Why?

Lake Species Diversity • Seasonal stability / variability of lake habitats influences species presence. • Abiotic factors that most influence fish species distribution in lakes: – Temperature – Oxygen availability • Main biotic factor: primary productivity (i. e. , food availability)

Four groupings of fish communities based on lake temperature regime and trophic status.

Stream Species Diversity • Number of species increases as stream order increases. – Different species / predator types become more predominant due to changes in abiotic/biotic features of river habitat. – Relates to changes in flood frequency, temperature regime, substrate, riparian canopy, etc. • Functional groups (feeding strategies) change with increased stream order. What are these strategies? – Carnivores: • Piscivores • Benthophages • Zooplanktivores • Epifauna eaters • Parasites – Omnivores – Herbivores – Detritivores

Spawning, Hatching & Dispersal • Broadcast spawning – • Meroplanktonic (not seen in exclusively lotic species) Benthic spawning – – – • Brood hiding (trout) Brood guarding (cichlids) Nest spawning (bass, sticklebacks) Internal bearers: internal fertilization. – Oviparity: egg-laying fishes. Very little embryonic development before eggs are laid. – Ovoviviparity: embryos develop internally, but only receive nutrition from yolk-sac. – Viviparity: embryos develop internally, mother provides additional nutrition after yolk sac used up. Also some instances of in-utero cannibalism.

Juvenile Development and Growth • Transition from larvae to juvenile stage can involve a dramatic metamorphosis, but changes generally more subtle: – Appearance of fully formed fins – Organ systems fully formed (or nearly so) – Juvenile period lasts until first onset of sexual maturity (initial development of gonads) • Growth: G = C – (R + E) – Somatic (body) growth is a function of the balance between consumption/assimilation, respiration rate, and waste excretion

Factors Affecting Growth • Temperature: dependent on tolerance range of species. Growth increases with temperature to a point, then falls off as temperature increases further • DO: decrease in DO associated with decrease in growth rate • Salinity: Important in euryhaline / diadromous fishes • Food abundance, competition (inter- and intraspecific),

Growth for Reproduction • Gonadal development occurs prior to spawning, claims a significant percentage of ingested nutrition – Testes: up to ~ 12% of male body weight – Ovaries: up to ~70% of female body weight • Sexual dimorphism: – Females often larger (to produce more/larger eggs) – Males sometimes larger when territorial during spawn (e. g. salmon) – Sometimes accompanied by changes in color (dichromatism) and body structure during spawning season

Timing of Spawning • Semelparity: Fish reproduce once, then die. • Iteroparity: Fish reproduce repeatedly during adult lifespan. • Seasonal cycles: – In temperate areas where seasonal fluctuations in climate are significant, spawning usually happens as a discrete event (once per year) – In tropics, many fish species spawn year-round in either distinct peaks or at a constant rate. – Timing of spawning usually linked to corresponding conditions for larval development and early growth.

Spawning Migrations • Some fishes undergo directed movements to a specific location for spawning – In less dramatic instances, spawning may merely involve a shift in habitat preference. • Anadromy: Most growth takes place in salt water, adult migrates into freshwater to spawn (e. g. coastal salmonids) – Lentic salmonids often migrate into feeder streams to spawn. • Catadromy: Most growth in freshwater, migrate to saltwater to spawn (e. g. anguillid eels)

Note more catodromous species in the tropics and the reverse for temperate latitudes; why? • Tropical oceans are extremely oligotrophic; yet rainforest streams are rich. • Temperate coastal oceans and higher latitude open ocean are very productive relative to some streams. Atlantic salmon (Salmo salar) mountain mullet (Agonostomus monticola)

Overview of Tolerance Range versus Survival, Growth, & Reproduction

Population Dynamics & Management • Stock: total numbers of a population. • Production: growth rate of population. • Age (size) classes: sub-groupings or cohorts within a population. • Recruitment: Numbers entering a new class; can be defined for each class. • Mortality: Loss between classes. • Fecundity: Offspring numbers per female; may differ between mature classes.

Age and Growth • The patterns of abundance at age gives an indication of the annual mortality of the population; the number of individuals in each age class will decline at a rate dictated by the total annual mortality. – Therefore, characterizing the age structure of the population is a central component in studying fish population dynamics. – Age structure can be monitored to determine impacts of exploitation / environmental perturbation on population Determining Age of Fishes: 1. Length frequency analysis 2. Estimation from analysis of “hard parts” (scales, otoliths, etc).

Length Frequency Analysis • A comprehensive sampling of fish in the system is required for complete age analysis; bias in the sample leads to poor characterization of ages and lifespan. Percent Frequency • Lengths of all fish in sample measured, frequencies of each length (i. e. number of fish present of a given length) plotted, and distinct “groups” of length distributions are identified:

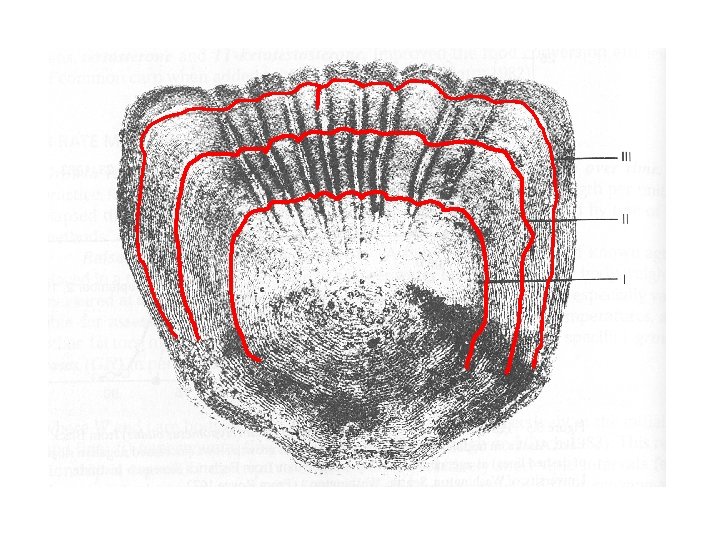
Analysis of Hard Structures • Seasonal variation in growth rates creates distinct “marks” in radial expansion of hard structures such as scales, otoliths (ear bones), spines, etc. • Similar to rings on trees, these marks can be used to count the number of days or annual cycles the fish has experienced. • Distinct changes in growth rate associated with seasonal variation in temperature, seasonal variation in resource availability, energetic losses due to reproduction / spawning, etc. • Growth can be verified by chemical “marking” of hard parts (Oxy. Tertra. Cycline, etc. ) and rearing / recapture of fish.

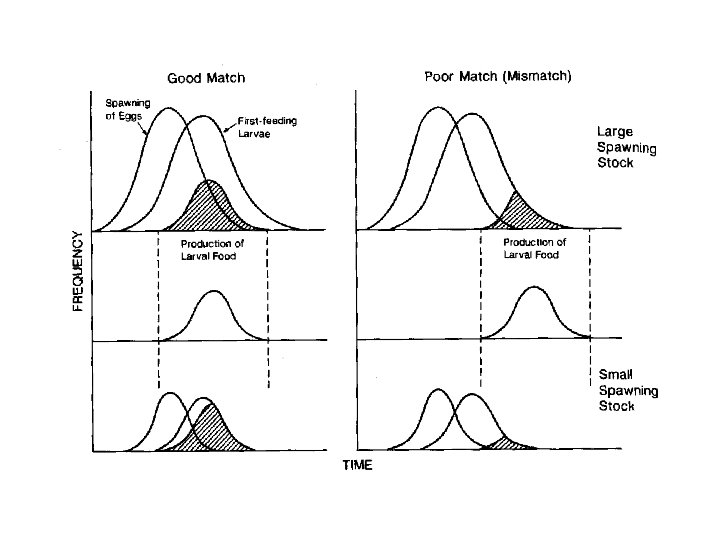
Recruitment • Recruitment is a function of spawning stock size, densitydependent forces, and physical influences on mortality and survival. – Increasing numbers of mature classes produces large number of offspring up to a limit. – Too many mature individuals leads to competition for limited resources, meaning more energy goes toward competing and growth; less toward reproduction -> lower number of offspring. – Large number of offspring compete for limited food supply, leading to slower growth and increased mortality under crowded conditions. – Physical and disease conditions play an unpredictable role. • Environmental influences on spawning and juvenile recruitment: – Spawning habitat; including physical and chemical conditions. – Timing of hatching and larval development with prey resources.

Fisheries • Commercial fisheries: Large numbers of fish harvested for sale, generally on significant scales of exploitation. Fisheries hold high importance both as food source and as source of income. • Sport / Recreational Fisheries: Fewer numbers of fish harvested per individual; however, much greater numbers of individuals participating in fishery. Very difficult to assess impact of these fisheries due to cryptic catches and mortality. • Sustenance Fisheries: Can be small-scale commercial fishing operations limited to local sale, or consistent harvest from a fishery for purposes of nutrition / sustenance.

Fishery Data • Historical catch data from fisheries provide best indications on stock status compared to previous (especially unexploited) levels. • Trends in historic data can be difficult to interpret due to changing abilities of fisheries (technological advancements, improved techniques, etc. ) • Number / biomass of fish caught (catch) is not an unbiased means of estimating of stock size; instead, must consider catch per unit effort (hooks deployed, hours fished, # net sets, etc. ) or yield. • This requires understanding efficiency of different fishing approaches and standardizing them against to a single unit of effort.
 of a stock functions")
Response to Exploitation • Under the simplest assumptions, exploitation (harvest) of a stock functions as an increase in mortality. We would expect a compensatory response of increased production due to decreased density and competition (see Maximum Sustainable Yield approach). • However, it is not always that simple: – Stock is made up of fish of different ages, sizes, maturity levels, reproductive capacity (i. e. fecundity). – Fishing often targets largest & easiest-to-catch fish foremost, leaving smaller, less fecund and sexually immature fish. – This can at best reduce the reproductive capacity of the stock (spawning stock biomass as indicator of stock health). – At worst, this can in time change the biological characteristics of the stock (size at maturity, growth rates, etc. ).

Methods for Managing Fisheries • Controlling effort: – By limiting or allocating effort, stock can be kept at sustainable levels. – Difficulties in enforcement, sources of cryptic mortality (hooking mortality, etc. ). – Example: bag limits, gear restrictions, etc. • Managing Production: – Size restrictions are designed to increase reproductive potential of unexploited stock. – Minimum size of capture set above size (age) of maturity. – Slot limits allow removal of medium sized fish, keep large (highly fecund) fish in stock.

• Protecting vulnerable stages: – Spawning aggregations – Easily exploitable stages – Example: closed seasons, closed areas • Providing refuge: Protected Areas – Allocates an area closed to harvest, provides spatial refuge for stock. – Can provide a consistent source of spawning stock, dispersal extends recruitment to surrounding / outlying areas. – Currently at the forefront of fishery management.

Stock Enhancement • Fish are artificially reared for release into natural systems to augment natural reproduction. – Upside: consistent recruitment managed to offset harvest. – Downside: dangers to genetic makeup of wild stock, deficiencies of hatchery fish. – Stock enhancement vs. “Put-and-Take”

Trout stocked in PA! Brook Trout Salvelinus fontinalis Brown Trout Salmo trutta Rainbow Trout Oncorhynchus mykiss

Aquaculture: • Has potential to relieve pressure on wild stocks if net profit can exceed that of commercial fishing. • Becoming more widespread and including more prominent fish species (salmon, shrimp, seabass) due to improving technology.
- Slides: 29