Fiscal Year 2012 13 Budget Second Budget Workshop
 August 21, 2012")
Fiscal Year 2012 -13 Budget (Second Budget Workshop) August 21, 2012

Major Services The Biggies: The Outside Economic Generators: General Fund – Economic Development Office – Gen. Fund Law Enforcement/Jails Visitor & Convention Bureau – Special Revenue EMS/Public Safety Sports Authority, including Baseball – Special Rev. Court System Parks – Regional The Unincorporated Services (MSTU Tax): Lee. Transportation – Gas taxes/impact fees Human Services Building Services Facilities Natural Resources Other – Animal Services Roads – Unincorporated Parks & Recreation - Community Libraries – own tax Conservation 20/20 – own tax The Enterprise Businesses: Solid Waste Utilities Toll Bridges The Outside Fundees (General Fund): Sheriff’s Office ($143 million) Court System Constitutional Officers
 General Fund")
Spending Levels Population 2004 -05 2005 -06 2006 -07 Today (2012 -13) General Fund All Bo. CC Departments Constitutional Officers 521, 253 549, 442 585, 608 638, 029 Cyclical Shortfall “One resulting from a temporary collapse of revenue due to the recession. ” Structural Shortfall (i. e. over-promising) “Chronic, longer-term, and massive structural imbalances that have developed largely due to policy choices made in better times. ”

Continued next page

Continued next page

Continued next page
 • • • 12— 13 11— 12 10— 11")
Property Tax Base ($ Billions) • • • 12— 13 11— 12 10— 11 09— 10 08— 09 07— 08 06— 07 05— 06 04— 05 03— 04 02— 03 Base 53. 2 53. 6 55. 5 64. 9 84. 5 96. 5 89. 7 64. 1 50. 3 43. 2 36. 9 Countywide Tax Rate 4. 15 4. 48 4. 95 5. 27 5. 34

Property Tax Revenues • • • 11— 12 10— 11 09— 10 08— 09 07— 08 Millions $252 $264 $308 $399 $462

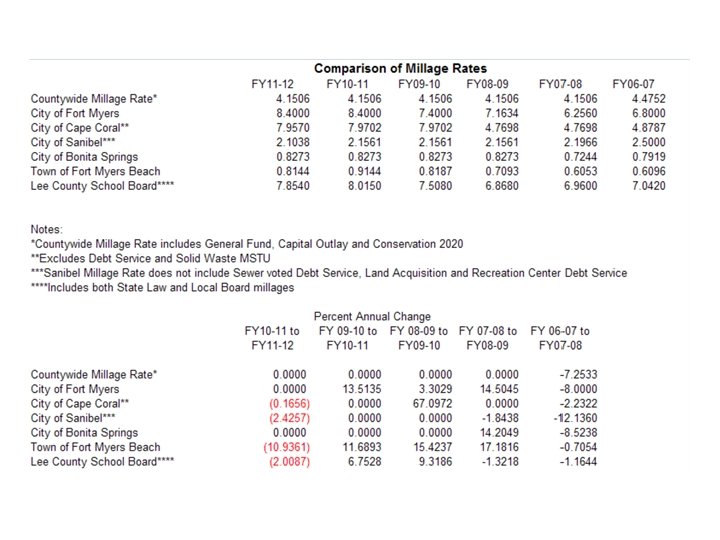
Property Tax RATES Rate 01 -02 12 -13 • • General Fund Capital Outlay Cons. 20/20 Uninc. MSTU Libraries All Hazards TOTAL 4. 3277 0. 5124 0. 5000 1. 2114 0. 9630 0. 0733 7. 5878 3. 6506 0. 0000 0. 5000 0. 8398 0. 3541 0. 0693 5. 4138
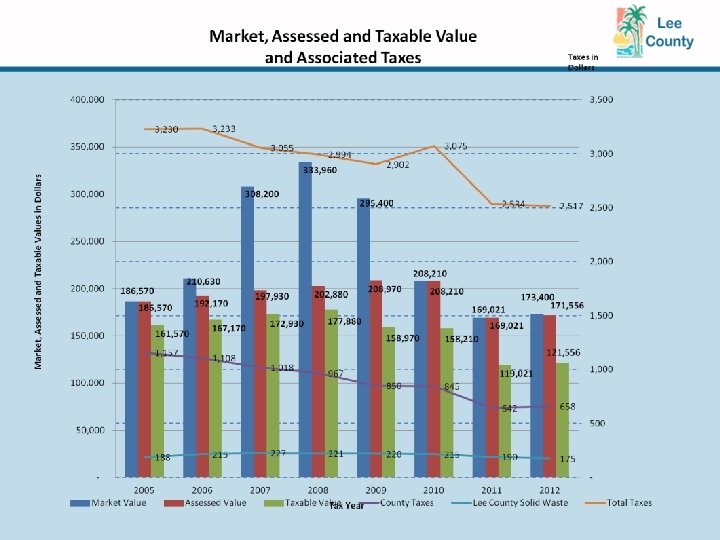

Illustrative Tax History Prop. Tax Garbage Rate Total Diff. $3, 230 $2, 517 $188 $175 $3, 418 $2, 692 $(726) County Portion • 2005 $1, 157 • 2012 $658 $188 $175 $1, 345 $833 $(512) • 2005 • 2012 • County Portion is 70% of decrease

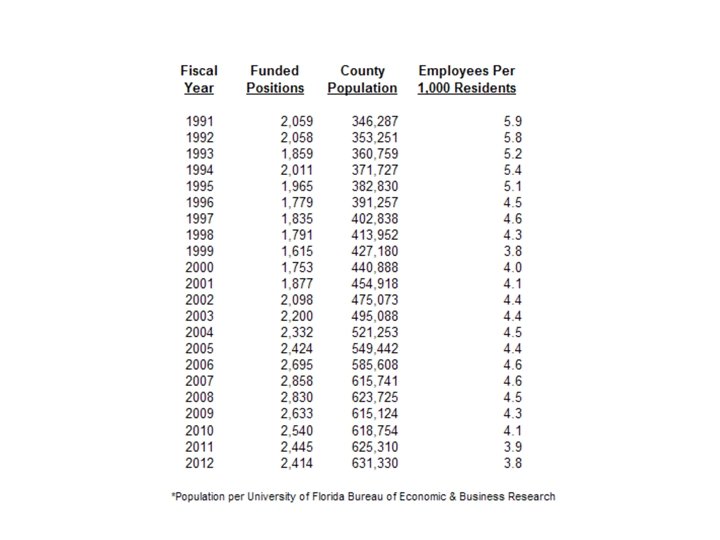
Still Fiscally Challenged The Good – – Reduced Taxes Cut Spending Decreased Size of Government (reduced workforce by 16%) Silver Lining – we are a more efficient operation • “Purposeful Abandonment” – Indications of economic improvement The Bad – Service levels are becoming “frayed” – We are much more reactive, than proactive, in our budgeting – Reserves spending is unsustainable OVER THE LONG TERM

General Fund Undesignated Reserves Sep. 30 2005 2006 2007 2008 2009 2010 2011 2012 $ 70. 0 million $ 57. 4 million $ 123. 9 million $163. 8 million $173. 9 million $191. 1 million $158. 3 million $136. 3 million (projected)

Continued next page
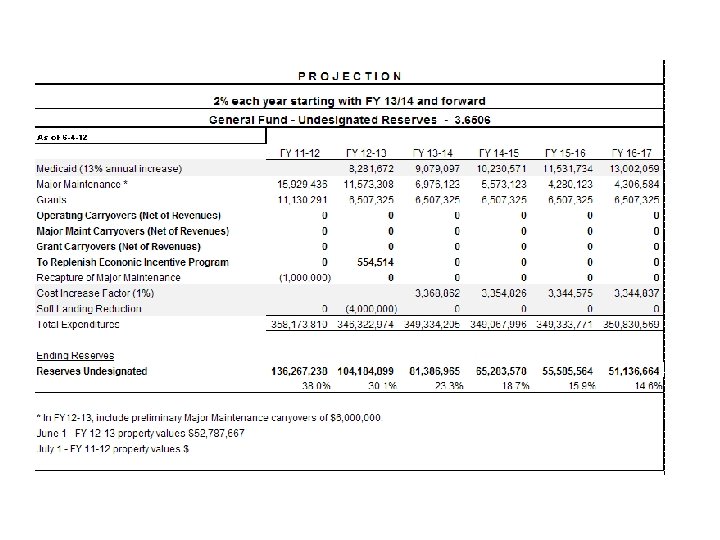

General Fund – Current Model • • • 2012 2013 2014 2015 2016 2017 Rev. Exp. Shortfall Reserves % $323* $314 $327 $333 $340 $346 358 346 349 349 351 (35) (33)** (22) (16) (9) (5) 136 104 81 65 56 51 38% 30% 23% 19% 16% 15% *In $millions **Includes $6 million of major maintenance carryovers and $4. 1 million increase in state mandates. Note: No increase in tax base until FY 13 -14; then 2% per year

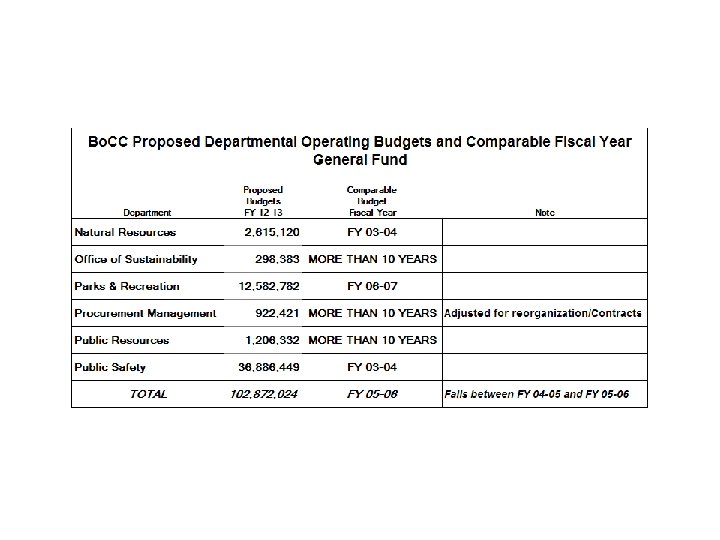
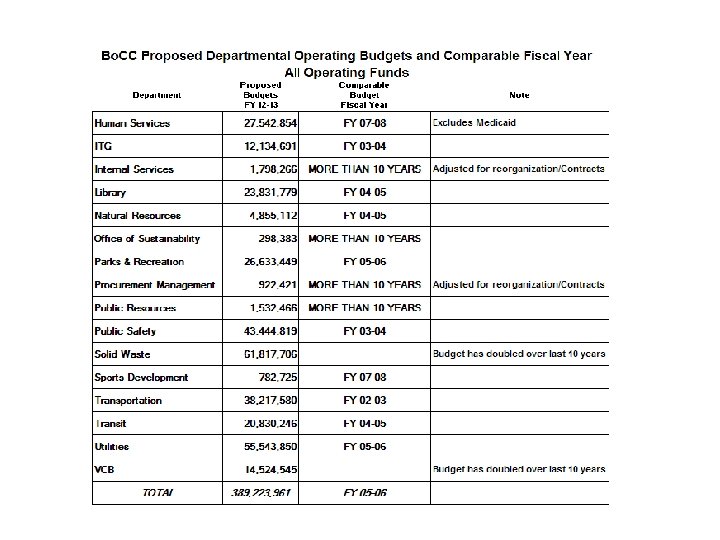
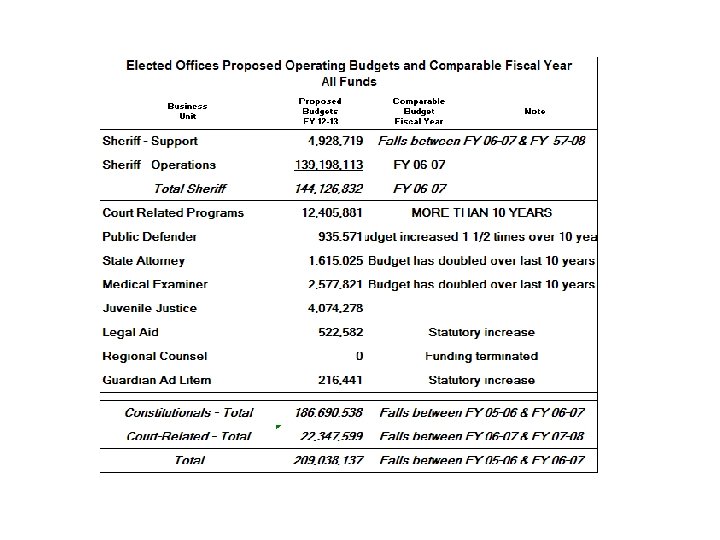
General Fund Expenditures Constitutionals $195 million 55% County Depts. $107 million 30% Joint Costs $ 54 million 15% TOTAL 100% $356 million

Continued on next page

Continued from previous page

QUESTIONS?
- Slides: 27