
FISCAL LITERACY February 6 2015 Lauren Klein CPA
FISCAL LITERACY February 6, 2015 Lauren Klein, CPA, MAcc Cleveland Clinic Health System
Learning Objectives By the end of this presentation you will be able to: q. Define Fiscal Literacy & understand why it is necessary to be a leader q. Recognize the components of an operating statement & utilize to manage your business q. Create a departmental budget q Interactive budget exercise q. Complete a variance analysis q Interactive variance exercise
Fiscal Literacy q. Fiscal Literacy is defined as: q Possessing the skills and knowledge on financial matters to confidently take effective action that best fulfills an individual’s goals
Fiscal Literacy And Leadership q. A good leader understands daily operations and the impact of decisions on financial performance q. Leaders need to be able to effectively communicate financial issues of an entity

Fiscal Literacy And Leadership q. A good leader should be able to successfully tell the story of their department/entity by weaving together the clinical (provider, patient, quality) AND financial issues

How Do I Improve My Fiscal Literacy? I e b y Ma ould sh me a o bec PA? C Should I go back to college? Is there an APP on my IPhone? Wh a a p t if I art get t im jo ban b at a e tha k? W i th elp ll ?

How Do I Improve My Fiscal Literacy? q. Develop a good working knowledge of key financial terms, reports & processes q. Put together the right team q You don’t need to be a subject matter expert q You should, however, know what to look for q It’s important to know what type of questions to ask q Go to subject matter experts for help! q. Collaborate & communicate within the department q Physician lead, Administrative & Finance Leads all working together, leveraging the different skill sets

A Good Place to Start: The Operating Statement

What Is An Operating Statement? q. Core financial statement q. Presents a company’s operating results over a specific period of time q. Starts with revenue and then subtracts expenses to calculate net income q. Sometimes referred to as an income statement, a P&L (profit & loss), statement of operations, earnings report
Why Do We Need An Operating Statement? q. Required by Regulatory Agencies, Banks, etc. q. Provides a uniform and understandable mechanism for measuring financial performance q. To monitor financial results q Over the passage of time; allows for comparison to previous periods q Vs a Budget
Components Of An Operating Statement Actual REVENUES Revenues – inflows resulting from the provision of goods and services
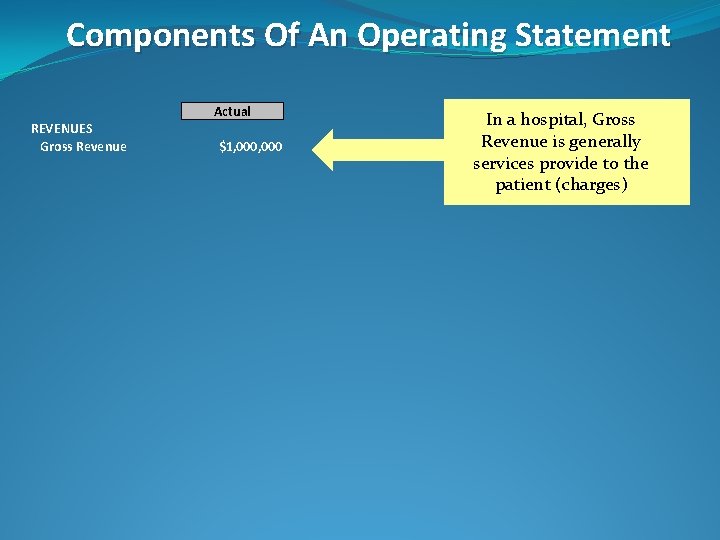
Components Of An Operating Statement Actual REVENUES Gross Revenue $1, 000 In a hospital, Gross Revenue is generally services provide to the patient (charges)
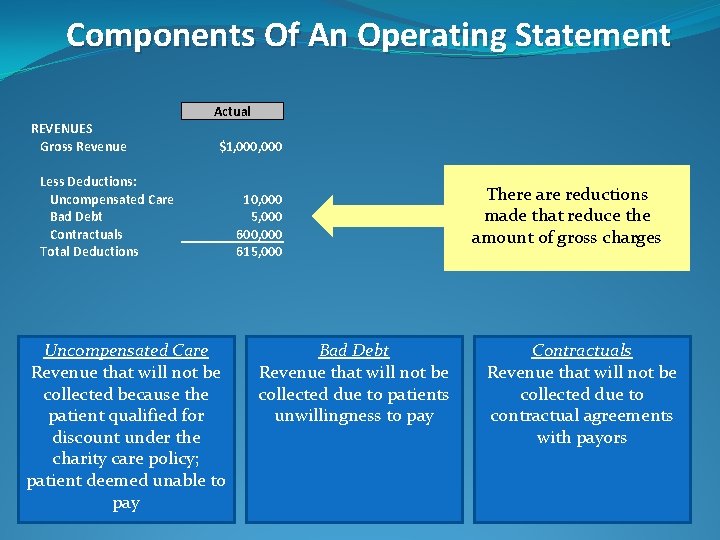
Components Of An Operating Statement Actual REVENUES Gross Revenue $1, 000 Less Deductions: Uncompensated Care Bad Debt Contractuals Total Deductions Uncompensated Care Revenue that will not be collected because the patient qualified for discount under the charity care policy; patient deemed unable to pay 10, 000 5, 000 600, 000 615, 000 Bad Debt Revenue that will not be collected due to patients unwillingness to pay There are reductions made that reduce the amount of gross charges Contractuals Revenue that will not be collected due to contractual agreements with payors
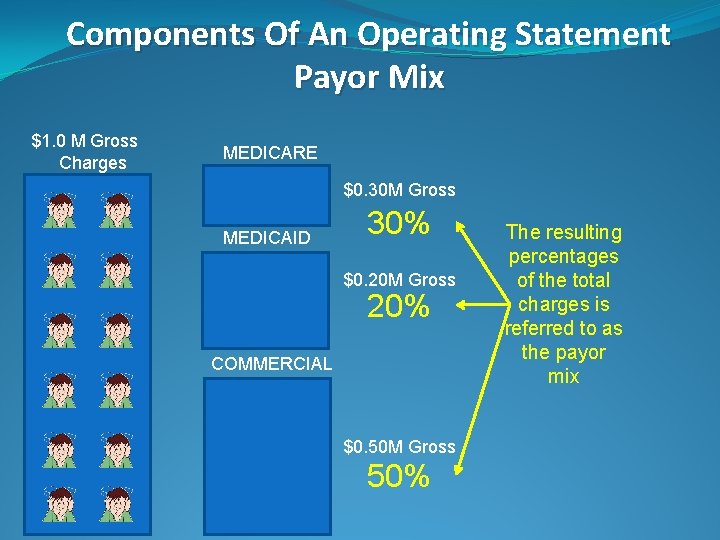
Components Of An Operating Statement Payor Mix $1. 0 M Gross Charges MEDICARE $0. 30 M Gross MEDICAID 30% $0. 20 M Gross 20% COMMERCIAL $0. 50 M Gross 50% The resulting percentages of the total charges is referred to as the payor mix
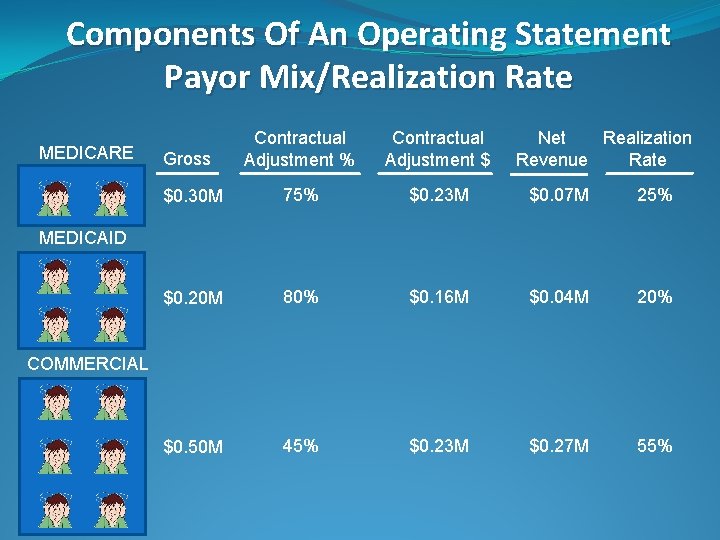
Components Of An Operating Statement Payor Mix/Realization Rate MEDICARE Contractual Adjustment % Contractual Adjustment $ $0. 30 M 75% $0. 23 M $0. 07 M 25% $0. 20 M 80% $0. 16 M $0. 04 M 20% $0. 50 M 45% $0. 23 M $0. 27 M 55% Gross Net Realization Revenue Rate MEDICAID COMMERCIAL
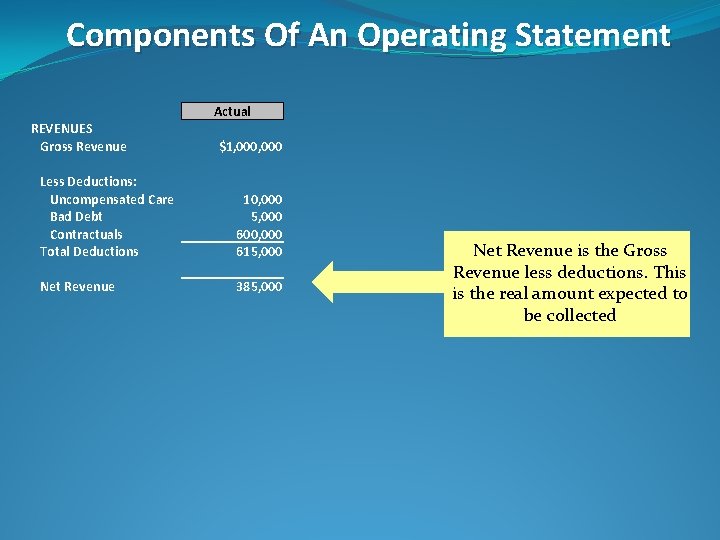
Components Of An Operating Statement Actual REVENUES Gross Revenue $1, 000 Less Deductions: Uncompensated Care Bad Debt Contractuals Total Deductions 10, 000 5, 000 600, 000 615, 000 Net Revenue 385, 000 Net Revenue is the Gross Revenue less deductions. This is the real amount expected to be collected
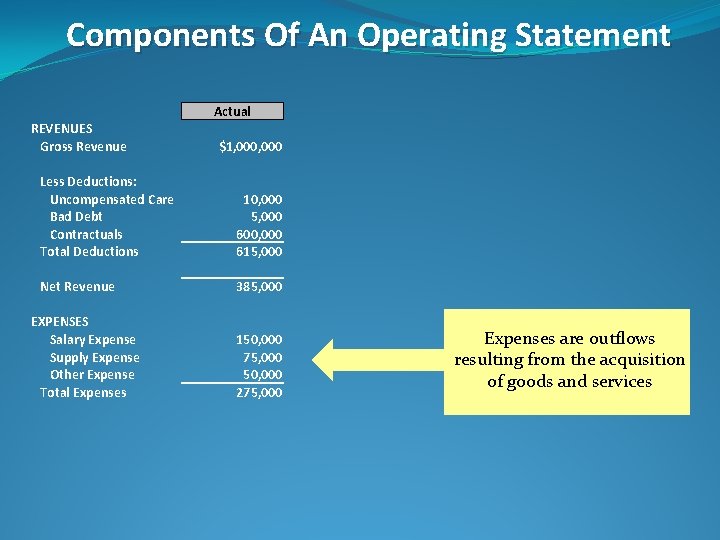
Components Of An Operating Statement Actual REVENUES Gross Revenue $1, 000 Less Deductions: Uncompensated Care Bad Debt Contractuals Total Deductions 10, 000 5, 000 600, 000 615, 000 Net Revenue 385, 000 EXPENSES Salary Expense Supply Expense Other Expense Total Expenses 150, 000 75, 000 50, 000 275, 000 Expenses are outflows resulting from the acquisition of goods and services
Types of Expenses q. Variable- costs move up and down dependent upon changes in volume q. Fixed- costs consistent regardless of changes in volume q. Step Variable- costs remain consistent, but do change at certain discrete changes in volume
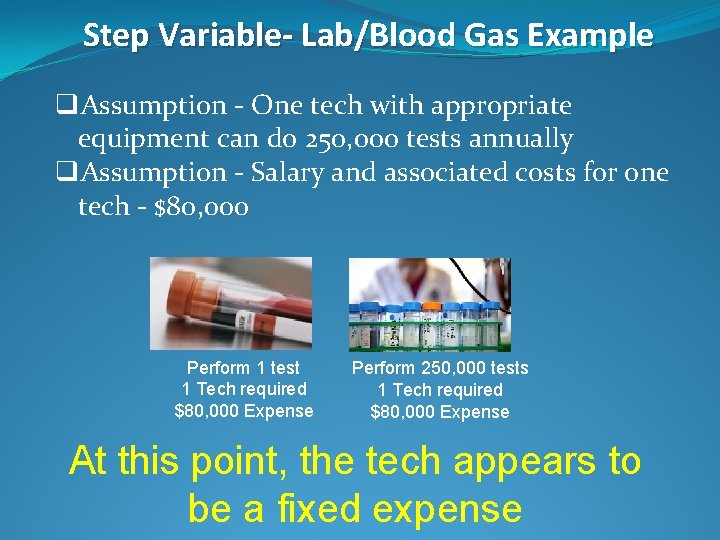
Step Variable- Lab/Blood Gas Example q. Assumption - One tech with appropriate equipment can do 250, 000 tests annually q. Assumption - Salary and associated costs for one tech - $80, 000 Perform 1 test 1 Tech required $80, 000 Expense Perform 250, 000 tests 1 Tech required $80, 000 Expense At this point, the tech appears to be a fixed expense
Step Variable- Lab/Blood Gas Example Perform 250, 001 tests 2 Techs required $160, 000 Expense The $80, 000 cost remained fixed, until we reached a discreet change in volume. At that point, our expenses went up.
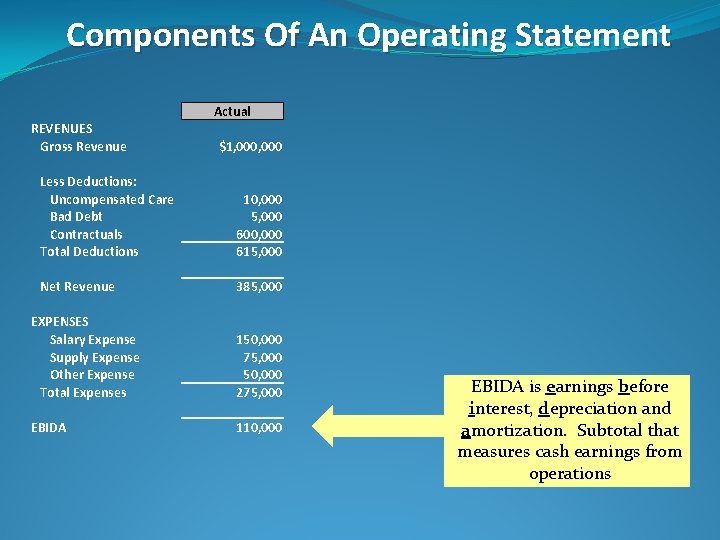
Components Of An Operating Statement Actual REVENUES Gross Revenue $1, 000 Less Deductions: Uncompensated Care Bad Debt Contractuals Total Deductions 10, 000 5, 000 600, 000 615, 000 Net Revenue 385, 000 EXPENSES Salary Expense Supply Expense Other Expense Total Expenses 150, 000 75, 000 50, 000 275, 000 EBIDA 110, 000 EBIDA is earnings before interest, depreciation and amortization. Subtotal that measures cash earnings from operations
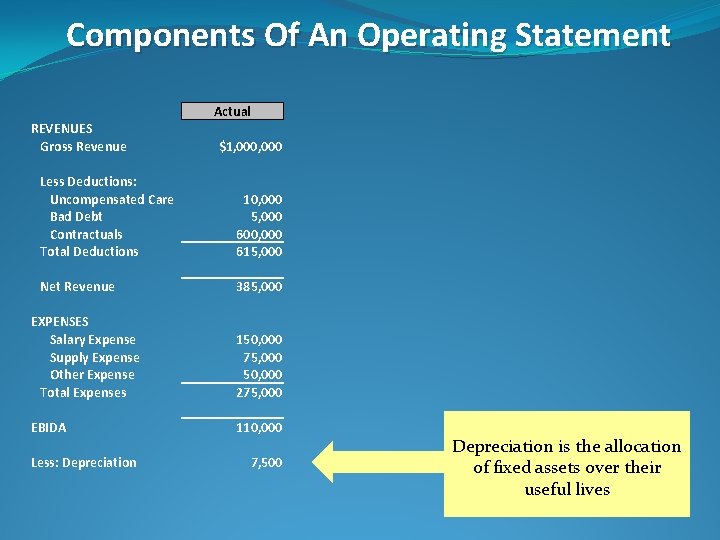
Components Of An Operating Statement Actual REVENUES Gross Revenue $1, 000 Less Deductions: Uncompensated Care Bad Debt Contractuals Total Deductions 10, 000 5, 000 600, 000 615, 000 Net Revenue 385, 000 EXPENSES Salary Expense Supply Expense Other Expense Total Expenses 150, 000 75, 000 50, 000 275, 000 EBIDA 110, 000 Less: Depreciation 7, 500 Depreciation is the allocation of fixed assets over their useful lives
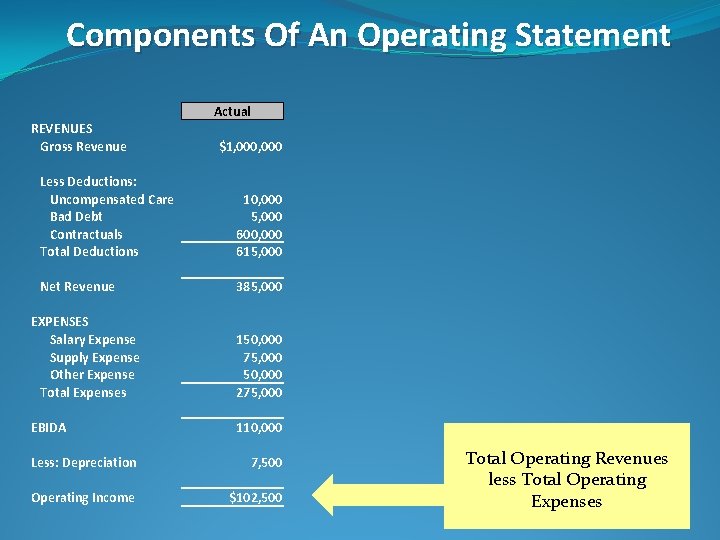
Components Of An Operating Statement Actual REVENUES Gross Revenue $1, 000 Less Deductions: Uncompensated Care Bad Debt Contractuals Total Deductions 10, 000 5, 000 600, 000 615, 000 Net Revenue 385, 000 EXPENSES Salary Expense Supply Expense Other Expense Total Expenses 150, 000 75, 000 50, 000 275, 000 EBIDA 110, 000 Less: Depreciation 7, 500 Operating Income $102, 500 Total Operating Revenues less Total Operating Expenses
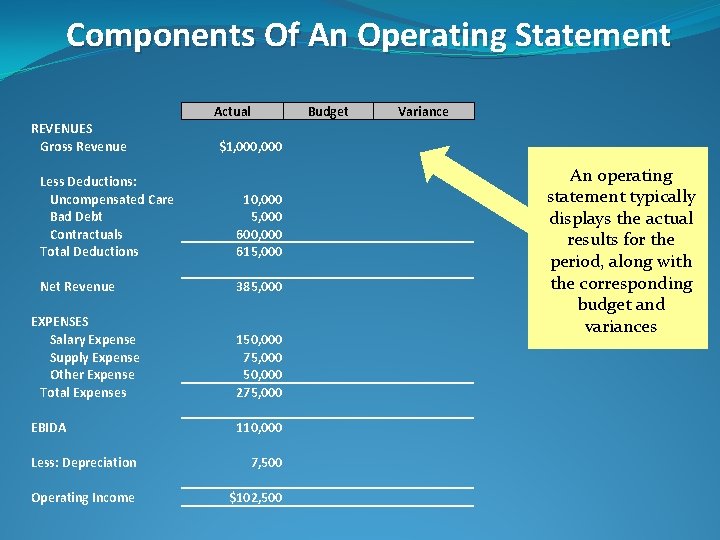
Components Of An Operating Statement Actual REVENUES Gross Revenue Budget Variance $1, 000 Less Deductions: Uncompensated Care Bad Debt Contractuals Total Deductions 10, 000 5, 000 600, 000 615, 000 Net Revenue 385, 000 EXPENSES Salary Expense Supply Expense Other Expense Total Expenses 150, 000 75, 000 50, 000 275, 000 EBIDA 110, 000 Less: Depreciation 7, 500 Operating Income $102, 500 An operating statement typically displays the actual results for the period, along with the corresponding budget and variances
What Is A Budget? q. A revenue and expense forecast describing an entity’s financial goals q. The estimates for each line item reflect what management wants and expects to achieve in upcoming periods BUT WHY? ? ?
Why Do We Need A Budget? q. Assists in making sure goals are met q Capital q Debt q Pension Funding q Etc. q. Accountability of management q. Can help control spending q. Helps with allocation of limited resources q Can use to control direction of company
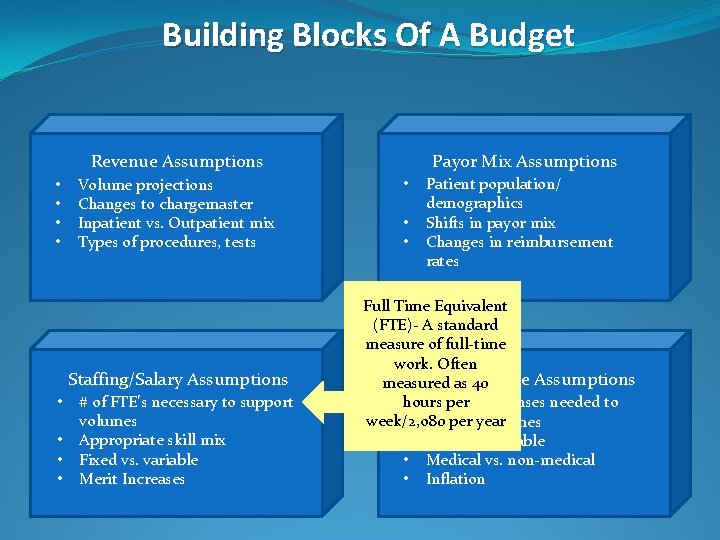
Building Blocks Of A Budget Payor Mix Assumptions Revenue Assumptions • • Volume projections Changes to chargemaster Inpatient vs. Outpatient mix Types of procedures, tests Staffing/Salary Assumptions • • # of FTE’s necessary to support volumes Appropriate skill mix Fixed vs. variable Merit Increases • • • Patient population/ demographics Shifts in payor mix Changes in reimbursement rates Full Time Equivalent (FTE)- A standard measure of full-time work. Often Otheras. Expense Assumptions measured 40 hours perof expenses needed to • Level week/2, o 80 per year support volumes • Fixed vs. variable • Medical vs. non-medical • Inflation
Operating Statement Exercise – Step #1 q. For Step #1, we’re going to build a budget…. . q. Refer to your handout for assumptions q. Using the assumptions, calculate out the values for each line item, and transfer them to the budget column of the worksheet q. We’ll take about 10 minutes to complete…. .
Step #1 – Build A Budget REVENUES Gross Revenue
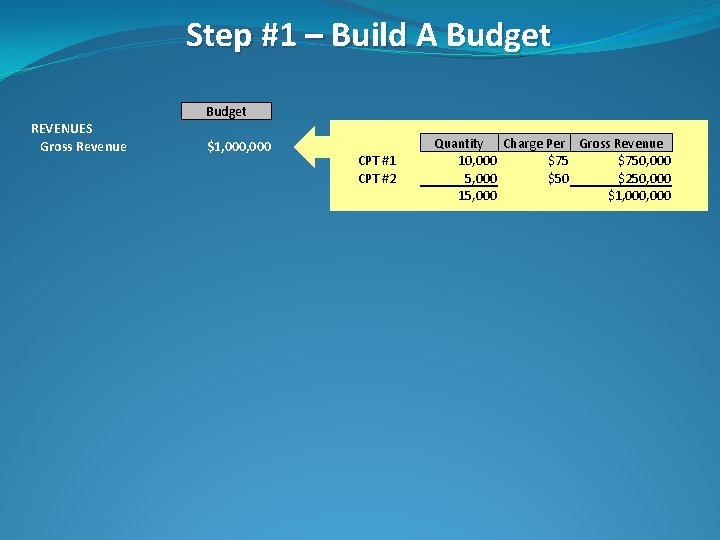
Step #1 – Build A Budget REVENUES Gross Revenue $1, 000 CPT #1 CPT #2 Quantity Charge Per Gross Revenue 10, 000 $750, 000 5, 000 $50 $250, 000 15, 000 $1, 000
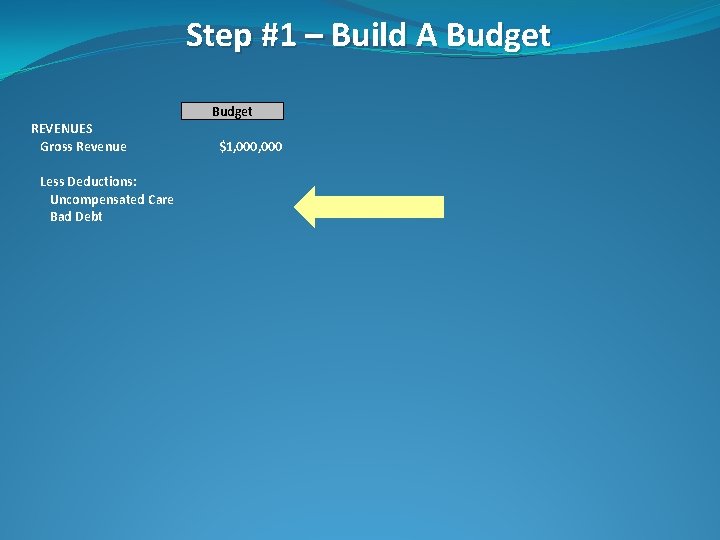
Step #1 – Build A Budget REVENUES Gross Revenue Less Deductions: Uncompensated Care Bad Debt $1, 000
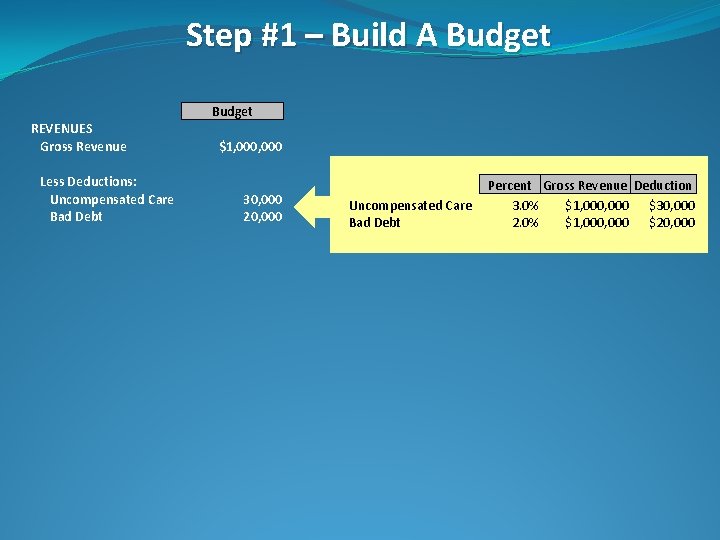
Step #1 – Build A Budget REVENUES Gross Revenue Less Deductions: Uncompensated Care Bad Debt $1, 000 30, 000 20, 000 Uncompensated Care Bad Debt Percent Gross Revenue Deduction 3. 0% $1, 000 $30, 000 2. 0% $1, 000 $20, 000
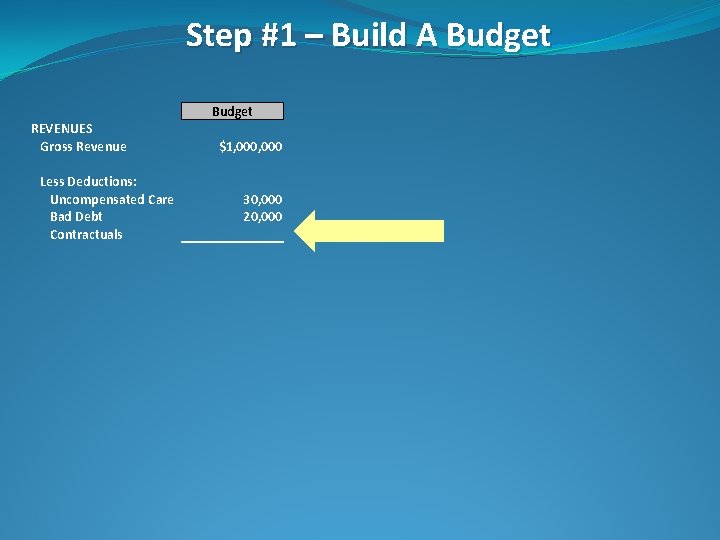
Step #1 – Build A Budget REVENUES Gross Revenue Less Deductions: Uncompensated Care Bad Debt Contractuals $1, 000 30, 000 20, 000
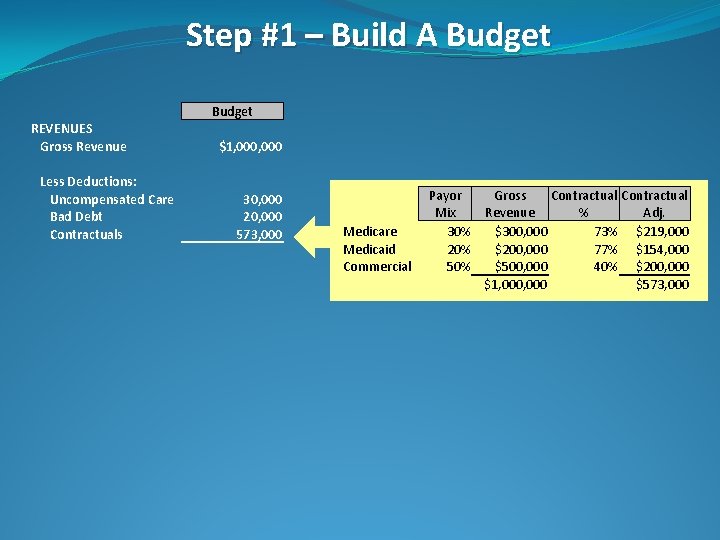
Step #1 – Build A Budget REVENUES Gross Revenue Less Deductions: Uncompensated Care Bad Debt Contractuals $1, 000 30, 000 20, 000 573, 000 Medicare Medicaid Commercial Payor Mix 30% 20% 50% Gross Contractual Revenue % Adj. $300, 000 73% $219, 000 $200, 000 77% $154, 000 $500, 000 40% $200, 000 $1, 000 $573, 000
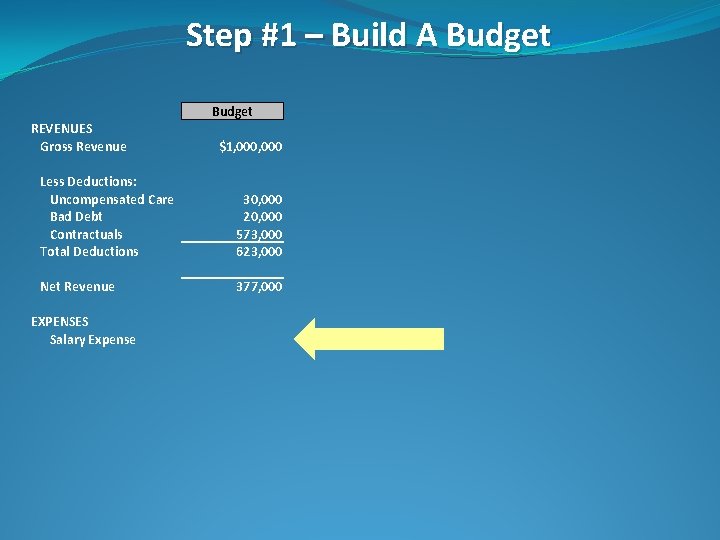
Step #1 – Build A Budget REVENUES Gross Revenue $1, 000 Less Deductions: Uncompensated Care Bad Debt Contractuals Total Deductions 30, 000 20, 000 573, 000 623, 000 Net Revenue 377, 000 EXPENSES Salary Expense
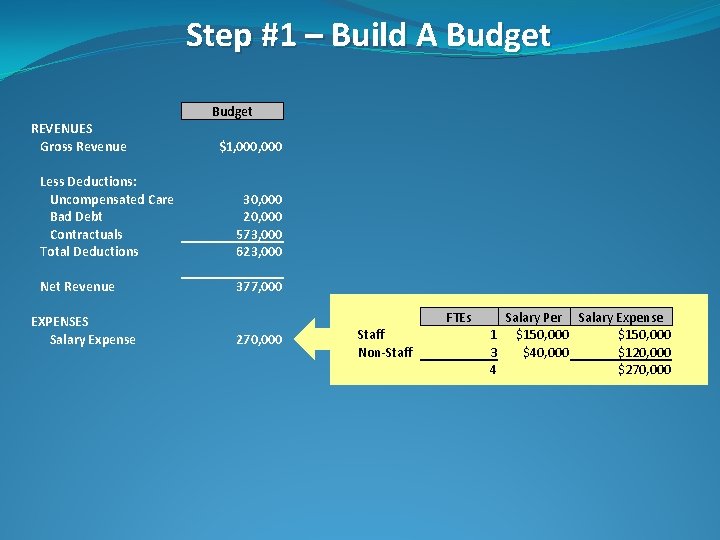
Step #1 – Build A Budget REVENUES Gross Revenue $1, 000 Less Deductions: Uncompensated Care Bad Debt Contractuals Total Deductions 30, 000 20, 000 573, 000 623, 000 Net Revenue 377, 000 EXPENSES Salary Expense FTEs 270, 000 Staff Non-Staff Salary Per Salary Expense 1 $150, 000 3 $40, 000 $120, 000 4 $270, 000
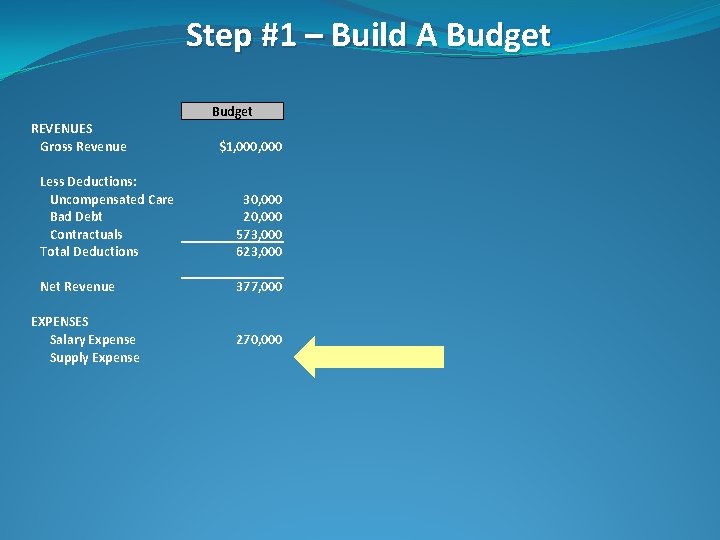
Step #1 – Build A Budget REVENUES Gross Revenue $1, 000 Less Deductions: Uncompensated Care Bad Debt Contractuals Total Deductions 30, 000 20, 000 573, 000 623, 000 Net Revenue 377, 000 EXPENSES Salary Expense Supply Expense 270, 000
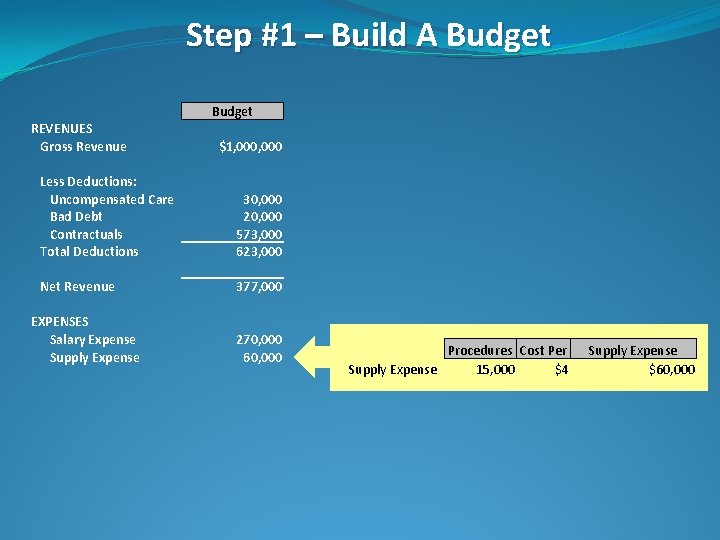
Step #1 – Build A Budget REVENUES Gross Revenue $1, 000 Less Deductions: Uncompensated Care Bad Debt Contractuals Total Deductions 30, 000 20, 000 573, 000 623, 000 Net Revenue 377, 000 EXPENSES Salary Expense Supply Expense 270, 000 60, 000 Procedures Cost Per Supply Expense 15, 000 $4 Supply Expense $60, 000
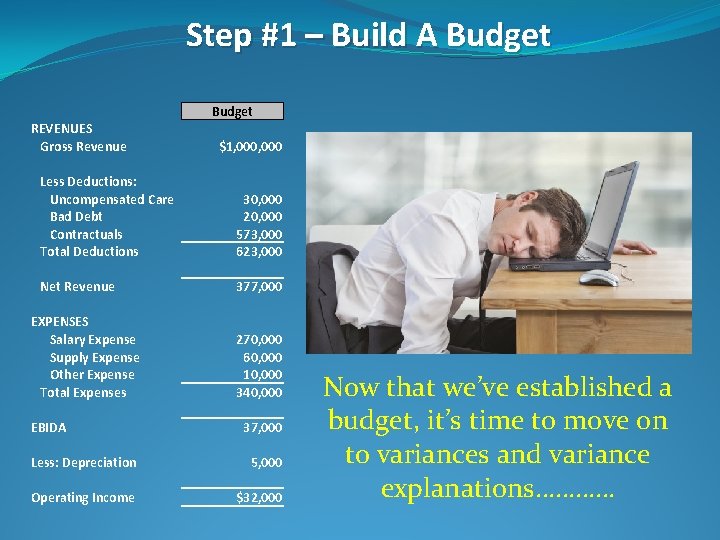
Step #1 – Build A Budget REVENUES Gross Revenue $1, 000 Less Deductions: Uncompensated Care Bad Debt Contractuals Total Deductions 30, 000 20, 000 573, 000 623, 000 Net Revenue 377, 000 EXPENSES Salary Expense Supply Expense Other Expense Total Expenses 270, 000 60, 000 10, 000 340, 000 EBIDA 37, 000 Less: Depreciation 5, 000 Operating Income $32, 000 Now that we’ve established a budget, it’s time to move on to variances and variance explanations…………
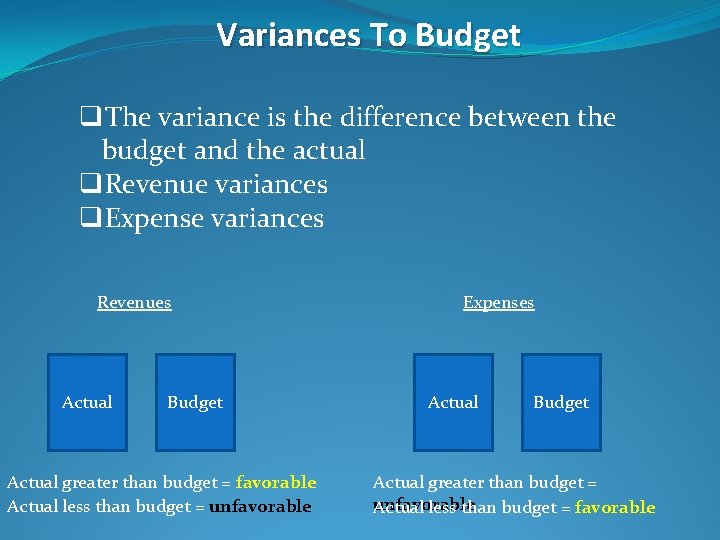
Variances To Budget q. The variance is the difference between the budget and the actual q. Revenue variances q. Expense variances Revenues Actual Budget Actual greater than budget = favorable Actual less than budget = unfavorable Expenses Actual Budget Actual greater than budget = unfavorable Actual less than budget = favorable
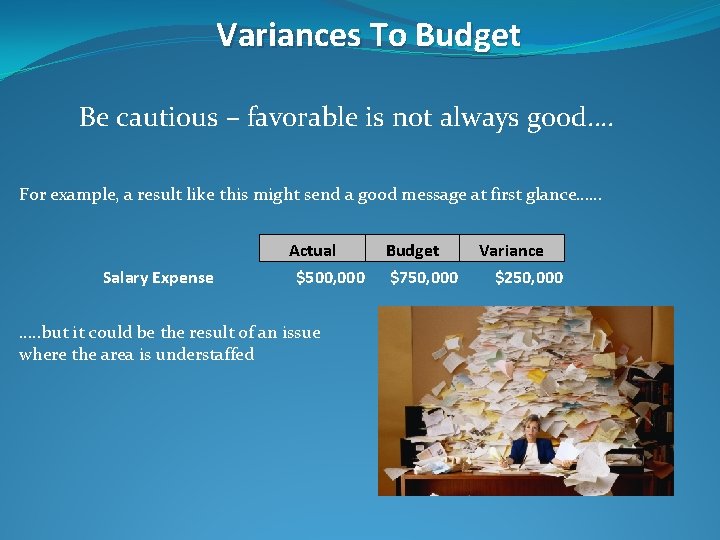
Variances To Budget Be cautious – favorable is not always good…. For example, a result like this might send a good message at first glance…… Salary Expense Actual $500, 000 …. . but it could be the result of an issue where the area is understaffed Budget $750, 000 Variance $250, 000
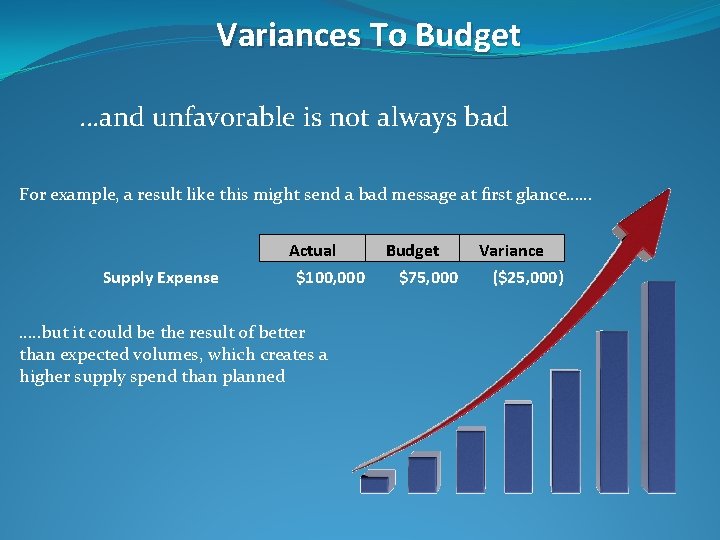
Variances To Budget …and unfavorable is not always bad For example, a result like this might send a bad message at first glance…… Supply Expense Actual $100, 000 …. . but it could be the result of better than expected volumes, which creates a higher supply spend than planned Budget $75, 000 Variance ($25, 000)
Operating Statement Exercise – Step #2 q. For Step #2, we saved you a little work by giving you the actual results for the period q. You will need to : q calculate the variances against the budget you prepared q do your best to come up with the variance explanations, using the detail of the actual results provided q. We’ll take about 15 minutes to complete….
Operating Statement Exercise – Step #2
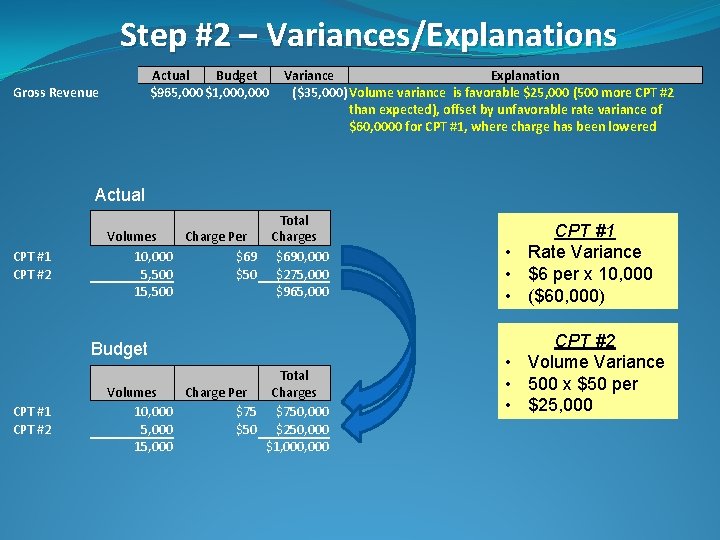
Step #2 – Variances/Explanations Actual Budget Variance Explanation $965, 000 $1, 000 ($35, 000) Volume variance is favorable $25, 000 (500 more CPT #2 than expected), offset by unfavorable rate variance of $60, 0000 for CPT #1, where charge has been lowered Gross Revenue Actual CPT #1 CPT #2 Volumes Charge Per 10, 000 $69 5, 500 $50 15, 500 Total Charges $690, 000 $275, 000 $965, 000 Budget CPT #1 CPT #2 Total Volumes Charge Per Charges 10, 000 $750, 000 5, 000 $50 $250, 000 15, 000 $1, 000 CPT #1 • Rate Variance • $6 per x 10, 000 • ($60, 000) CPT #2 • Volume Variance • 500 x $50 per • $25, 000
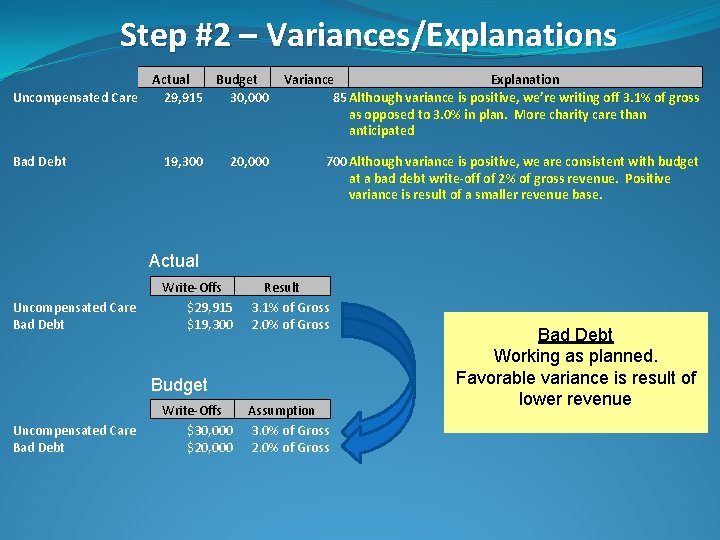
Step #2 – Variances/Explanations Uncompensated Care Bad Debt Actual Budget 29, 915 30, 000 19, 300 20, 000 Variance Explanation 85 Although variance is positive, we’re writing off 3. 1% of gross as opposed to 3. 0% in plan. More charity care than anticipated 700 Although variance is positive, we are consistent with budget at a bad debt write-off of 2% of gross revenue. Positive variance is result of a smaller revenue base. Actual Uncompensated Care Bad Debt Write-Offs $29, 915 $19, 300 Result 3. 1% of Gross 2. 0% of Gross Budget Uncompensated Care Bad Debt Write-Offs $30, 000 $20, 000 Assumption 3. 0% of Gross 2. 0% of Gross Uncompensated Bad Debt Care The. Working favorable asvariance planned. is misleading. variance Write-offs are aof Favorable is result higher percentage of gross lower revenue than anticipated
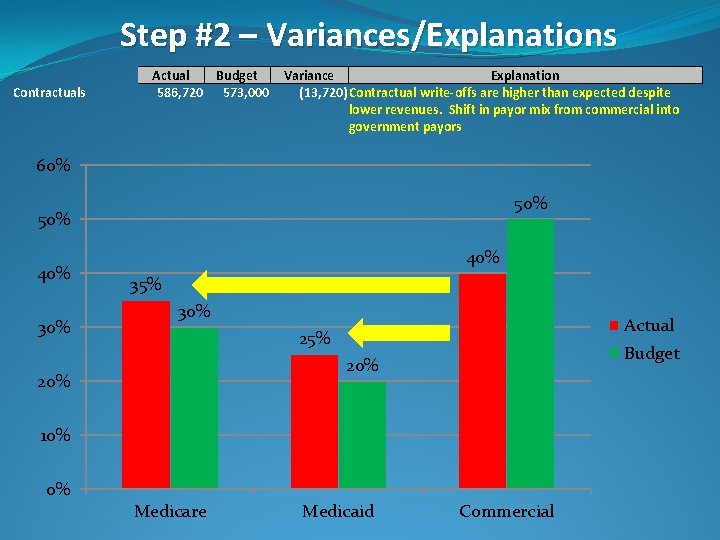
Step #2 – Variances/Explanations Contractuals Actual Budget 586, 720 573, 000 Variance Explanation (13, 720) Contractual write-offs are higher than expected despite lower revenues. Shift in payor mix from commercial into government payors 60% 50% 40% 35% 30% Actual 25% Budget 20% 10% 0% Medicare Medicaid Commercial
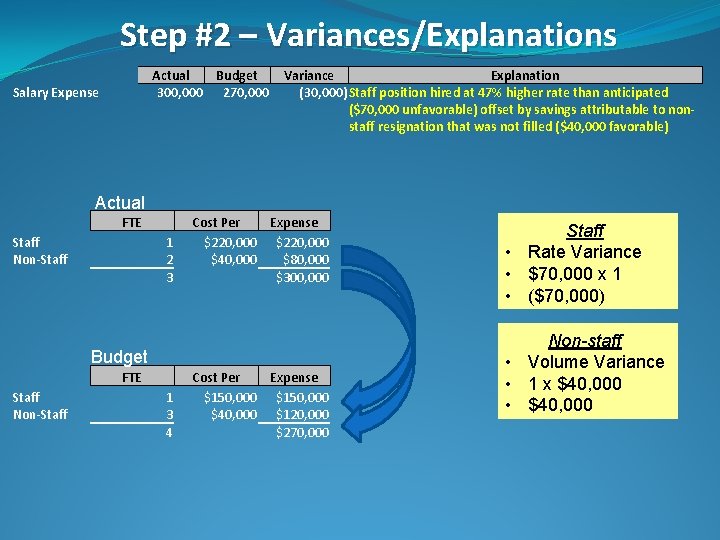
Step #2 – Variances/Explanations Actual Budget 300, 000 270, 000 Salary Expense Variance Explanation (30, 000) Staff position hired at 47% higher rate than anticipated ($70, 000 unfavorable) offset by savings attributable to nonstaff resignation that was not filled ($40, 000 favorable) Actual FTE Staff Non-Staff 1 2 3 Cost Per Expense $220, 000 $40, 000 $80, 000 $300, 000 Budget FTE Staff Non-Staff 1 3 4 Cost Per Expense $150, 000 $40, 000 $120, 000 $270, 000 Staff • Rate Variance • $70, 000 x 1 • ($70, 000) Non-staff • Volume Variance • 1 x $40, 000 • $40, 000
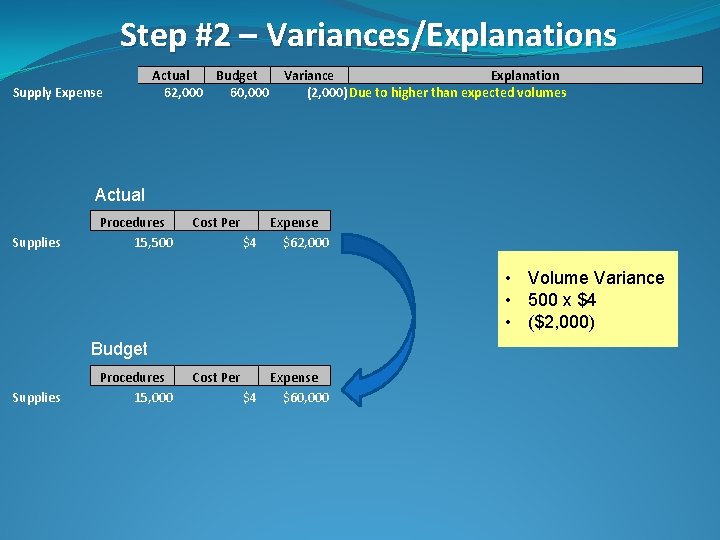
Step #2 – Variances/Explanations Supply Expense Actual Budget 62, 000 60, 000 Variance Explanation (2, 000) Due to higher than expected volumes Actual Supplies Procedures 15, 500 Cost Per Expense $4 $62, 000 • Volume Variance • 500 x $4 • ($2, 000) Budget Supplies Procedures 15, 000 Cost Per Expense $4 $60, 000
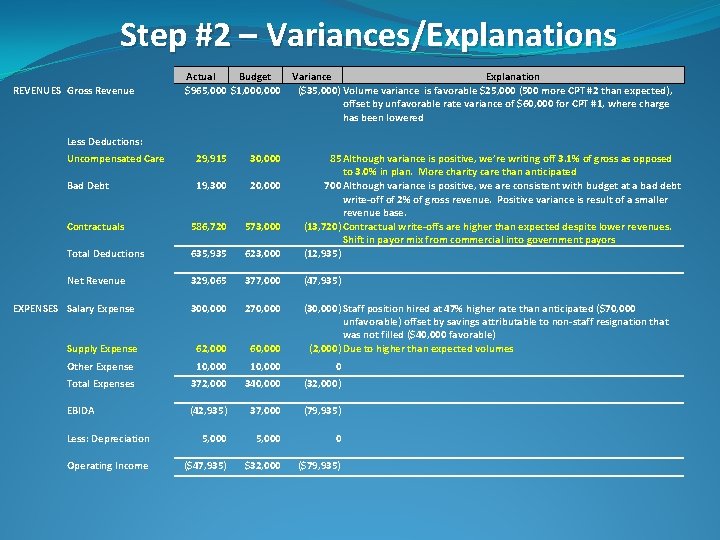
Step #2 – Variances/Explanations REVENUES Gross Revenue Actual Budget Variance Explanation $965, 000 $1, 000 ($35, 000) Volume variance is favorable $25, 000 (500 more CPT #2 than expected), offset by unfavorable rate variance of $60, 000 for CPT #1, where charge has been lowered Less Deductions: Uncompensated Care 29, 915 30, 000 Bad Debt 19, 300 20, 000 Contractuals 586, 720 573, 000 Total Deductions 635, 935 623, 000 85 Although variance is positive, we’re writing off 3. 1% of gross as opposed to 3. 0% in plan. More charity care than anticipated 700 Although variance is positive, we are consistent with budget at a bad debt write-off of 2% of gross revenue. Positive variance is result of a smaller revenue base. (13, 720) Contractual write-offs are higher than expected despite lower revenues. Shift in payor mix from commercial into government payors (12, 935) Net Revenue 329, 065 377, 000 (47, 935) EXPENSES Salary Expense 300, 000 270, 000 Supply Expense 62, 000 60, 000 (30, 000) Staff position hired at 47% higher rate than anticipated ($70, 000 unfavorable) offset by savings attributable to non-staff resignation that was not filled ($40, 000 favorable) (2, 000) Due to higher than expected volumes Other Expense 10, 000 0 Total Expenses 372, 000 340, 000 (32, 000) EBIDA (42, 935) 37, 000 (79, 935) Less: Depreciation 5, 000 0 Operating Income ($47, 935) $32, 000 ($79, 935)
Key Points q. A good leader understands daily operations and the impact of decisions on financial performance – “Fiscal Literacy” q. You don’t need to do it alone q Create the right team q Know what to ask q Leverage the different skill sets

Questions?
- Slides: 52