Fiscal Effects of COVID19 Alan J Auerbach William

Fiscal Effects of COVID-19 Alan J. Auerbach, William Gale, Byron Lutz, Louise Sheiner The views expressed here are solely those of the authors and should not be attributed to any other person or any organization, including the Board of Governors of the Federal Reserve.

Outline • What has COVID-19 shock done to the federal budget outlook over the next 10 and 30 years? • What is the short- and medium-term impact of the fiscal condition of state and local governments, in the aggregate and across states?

Federal Outlook: Basic Approach • Consider three “baselines” for fiscal policy 1. Pre-COVID “current law” baseline 2. Post-COVID “current law” baseline 3. Post-COVID “current policy” baseline • Comparing 2 to 1 gives an estimate of the impact of the COVID shock, including both direct effects and policy responses • Use CBO (January) vs. CBO (September) as starting points for estimating these two baselines • For longer-term projections (2030 -2050), make a series of small adjustments

Federal Outlook: Basic Approach • Consider three “baselines” for fiscal policy 1. Pre-COVID “current law” baseline 2. Post-COVID “current law” baseline 3. Post-COVID “current policy” baseline • Third baseline intended as a more realistic measure of where we actually are • Adjusts several assumptions where “current law” deviates from likely path (e. g. , “temporary” provisions intended to be permanent)

Key Results 1. Short-run COVID fiscal shock is enormous, virtually all on the spending side • Non-interest spending up 11% of GDP in FY 2020 • Revenues down 0. 5% of GDP in FY 2020 • Primary deficit >14% of GDP

Key Results 1. Short-run COVID fiscal shock is enormous, virtually all on the spending side • Non-interest spending up 11% of GDP in FY 2020 • Revenues down 0. 5% of GDP in FY 2020 • Primary deficit >14% of GDP 2. Impact on primary deficits projected to dissipate quickly • By FY 2022, an increase of only 2% of GDP

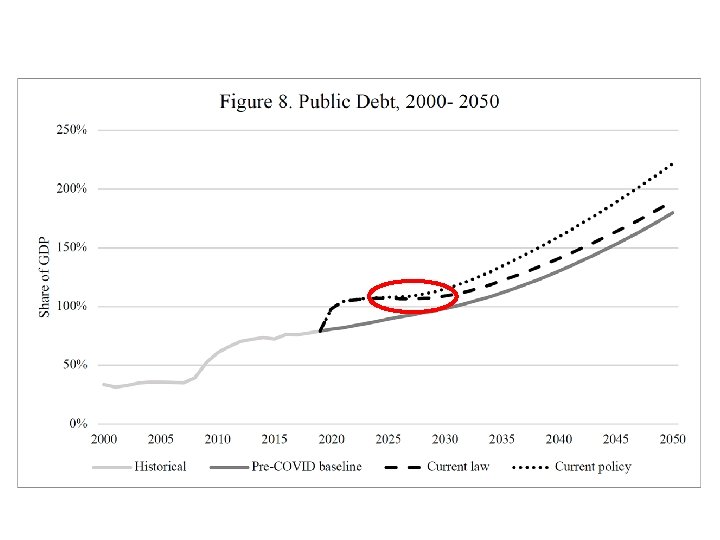
Key Results 1. Short-run COVID fiscal shock is enormous, virtually all on the spending side • Non-interest spending up 11% of GDP in FY 2020 • Revenues down 0. 5% of GDP in FY 2020 • Primary deficit >14% of GDP 2. Impact on primary deficits projected to dissipate quickly • By FY 2022, an increase of only 2% of GDP 3. Even so, debt-GDP ratio at all-time high (106%) by end of FY 2022 (vs. 84% pre-COVID estimate)

Key Results 4. Projected interest rates sharply lower for a time
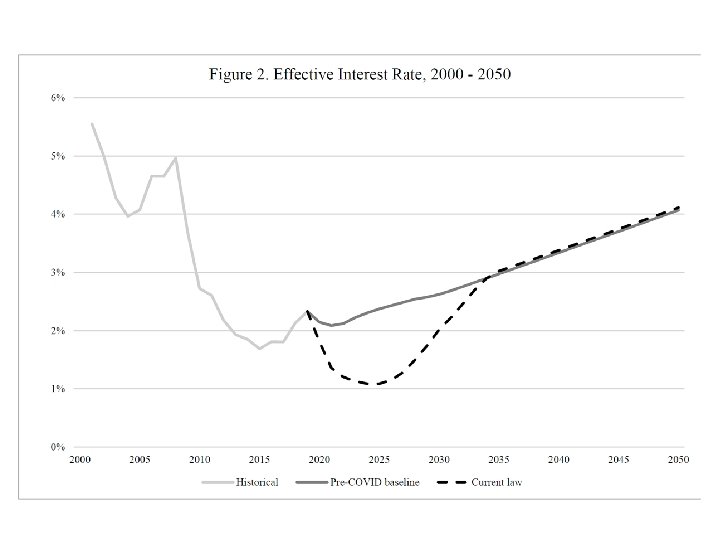

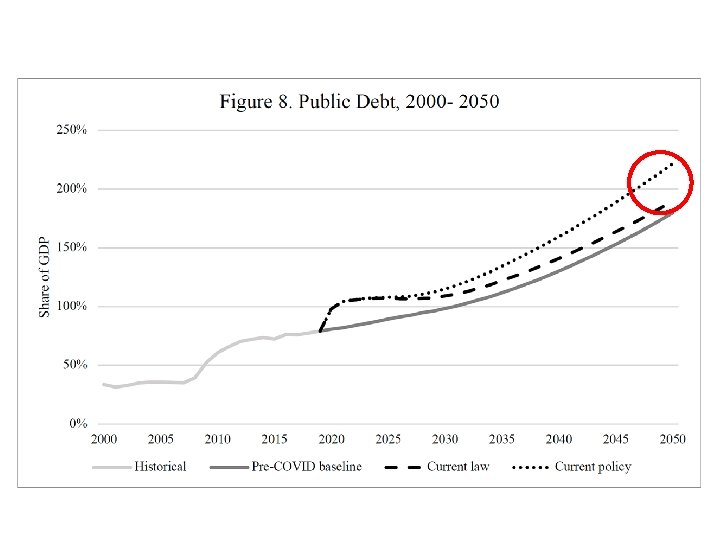
Key Results 4. Projected interest rates sharply lower for a time 5. Over longer term, this mutes impact of higher primary deficits arising from structural imbalances • Debt-GDP ratio under current law now 190% in 2050, vs. 180% pre-COVID

Key Results 4. Projected interest rates sharply lower for a time 5. Over longer term, this mutes impact of higher primary deficits arising from structural imbalances • Debt-GDP ratio under current law now 190% in 2050, vs. 180% pre-COVID 6. Under current policy, debt accumulation is higher

Key Results 4. Projected interest rates sharply lower for a time 5. Over longer term, this mutes impact of higher primary deficits, arising from structural imbalances • Debt-GDP ratio under current law now 190% in 2050, vs. 180% pre-COVID 6. Under current policy, debt accumulation is higher 7. Projections may be pessimistic in some respects (e. g. , don’t incorporate faster 2020 recovery), but also don’t include possibility of slower short-term growth (as in GFC) or upcoming policy changes, for which pressure is largely in one direction

Fiscal Outlook of the State and Local Sector S&L balanced budget requirements → revenue losses offset by spending cuts or tax increases These are a drag on the economy and also make it hard to provide essential services Wide range of projected S&L losses over next 2 years: from $130 b - $875 b Estimates mostly from historical relationships between macro variables and tax collections. Paper shows that these relationships vary over time and that accounting for stock market returns weakens the relationship between tax collections and unemployment or personal income And this recession very unusual: Unemployment unusually concentrated among low-income workers Taxable UI expansions and PPP Very different consumption patterns No stock market downturn Just as tax losses might be different, so too may spending pressures associated with virtual learning and public health

Our Approach “Bottom up” approach for each category of taxes and fees. We use data from Opportunity Insights (among other sources), which track, by state, consumption by category and employment by wage group (low, middle, high) We extend data using CBO economic projections for degree of social distancing, unemployment, wages, and consumption. For income taxes: we “shock” CPS data with unemployment and lower wages and capital income and feed through NBER’s Taxsim to calculate state tax liabilities. For sales taxes and other taxes and fees, we use data on consumption declines to calculate revenue effects. We also account for federal aid to state and local governments enacted to date.

Summary of Our Results for Nation as a Whole

Recent Data on State Tax Collections this Year Tax collections reflect data for 41 states accounting for 87 percent of national personal income tax and national sales tax collections and 83 percent of national corporate income tax collections. Source: Analysis is based on data provided by the Urban Institute available at: https: //www. urban. org/policycenters/cross-centerinitiatives/state-and-localfinance-initiative/projects/statetax-and-economic-review/datasubscriptions

This Recession IS Very Different Income tax declines likely to be lower than many had expected. But declines in sales taxes and fees larger than usual. Federal aid enacted to date covers revenue losses this year, but not next year or thereafter. Knowing this, states will likely cut back on spending. Furthermore, distribution of aid very uneven. Aid MUCH more generous relative to needs in smaller states. $150 billion Coronavirus Relief Fund had $1. 25 billion minimum for each state. Large share of general revenues for the smaller states. Even without accounting for multi-year nature of recession (according to CBO) and additional spending needs, some states will face tough budget choices.

Measuring Fiscal Stress Ability to maintain pre-COVID spending not the right metric for measuring fiscal stress. From macroeconomic perspective, maintaining spending means sector not a drag on the economy. But from a public service perspective, not so. If spending needs go up significantly, states will still be under stress and have to cut necessary services. e. g. Important for S&L govs to ensure all students continue to get good education and that other needs met. This is likely to involve more $. State and local governments seeing fiscal stress in coming years without additional aid may not be willing to spend adequately.
- Slides: 20