
Finishing Phase I Improving Results through Systemic Improvement



- Slides: 56
Finishing Phase I: Improving Results through Systemic Improvement Planning Stacy Kong, Hawaii Part C Ruth Littlefield, New Hampshire 619 Anne Lucas, ECTA/WRRC Brenda Sharp, Louisiana Part C
Session Goals • Understand SSIP requirements related to coherent improvement strategies • Gain ideas about how data and infrastructure analysis lead to identifying improvement strategies
Session Outline • Introduction • Sharing from 3 states – Hawaii Part C – Louisiana Part C – New Hampshire 619 • Discussion
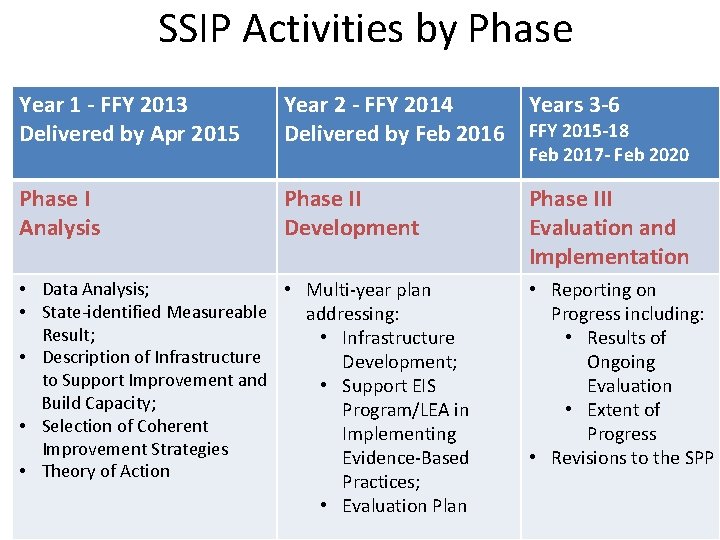
SSIP Activities by Phase Year 1 - FFY 2013 Delivered by Apr 2015 Year 2 - FFY 2014 Years 3 -6 Delivered by Feb 2016 FFY 2015 -18 Phase I Analysis Phase II Development Feb 2017 - Feb 2020 • Data Analysis; • Multi-year plan • State-identified Measureable addressing: Result; • Infrastructure • Description of Infrastructure Development; to Support Improvement and • Support EIS Build Capacity; Program/LEA in • Selection of Coherent Implementing Improvement Strategies Evidence-Based • Theory of Action Practices; • Evaluation Plan Phase III Evaluation and Implementation • Reporting on Progress including: • Results of Ongoing Evaluation • Extent of Progress • Revisions to the SPP
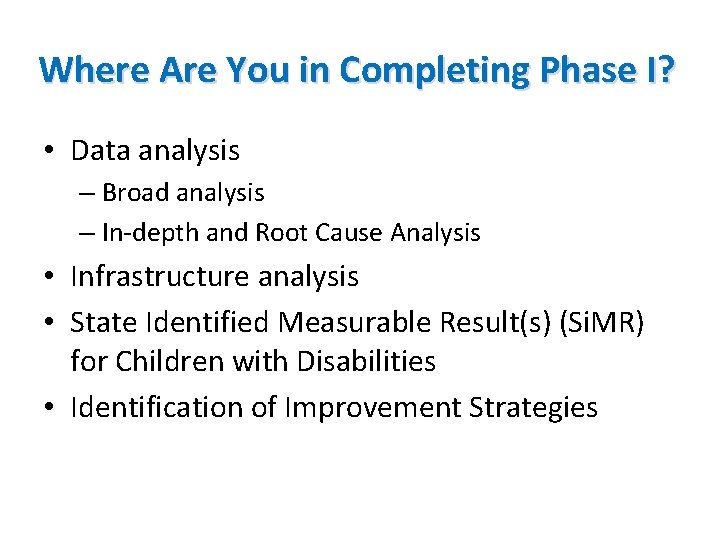
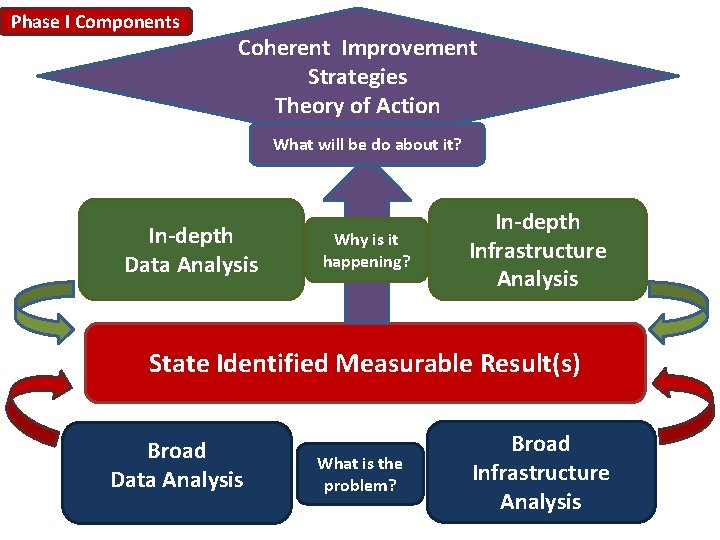
Where Are You in Completing Phase I? • Data analysis – Broad analysis – In-depth and Root Cause Analysis • Infrastructure analysis • State Identified Measurable Result(s) (Si. MR) for Children with Disabilities • Identification of Improvement Strategies
Phase I Components Coherent Improvement Strategies Theory of Action What will be do about it? In-depth Data Analysis Why is it happening? In-depth Infrastructure Analysis State Identified Measurable Result(s) Broad Data Analysis What is the problem? Broad Infrastructure Analysis
Coherent Improvement Strategies • Must provide explanation of: – How improvement strategies were selected – Why they are sound, logical and aligned – How they will lead to measurable improvement in Si. MR
Coherent Improvement Strategies • Includes strategies, identified through Data and State Infrastructure Analyses, that are needed to: – Improve State infrastructure – To support EIS program and/or EIS provider implementation of evidence-based practices to improve Si. MR
Coherent Improvement Strategies • Describe how implementation of improvement strategies will: – Address identified root causes for low performance – Ultimately build EIS program and/or EIS provider capacity to achieve the Si. MR
Suggested Process • Use information from data and infrastructure analyses to identify: – Root causes (practices and infrastructure) – Barriers as to why root causes have not previously been addressed – Leverage points (things that are working well, existing initiatives and state improvement plans, things that will turn the curve) • Review evidence for potential solutions
Potential Selection Criteria • Select strategies that: – Address root causes and barriers – Build on leverage points – Are appropriate and fit well – Are doable within resources available – Are aligned with each other – Build capacity of LEAs/EIS programs – Are evidence-based – Will make a difference in results (Si. MR)
Suggested Considerations • Use DEC Recommended Practices and the Agreed Upon Practices as resources for identifying key practices • Incorporate active implementation frameworks (from implementation science) as improvement strategies are designed to evaluate appropriateness and fit • Evaluate effectiveness and impact of improvement strategies
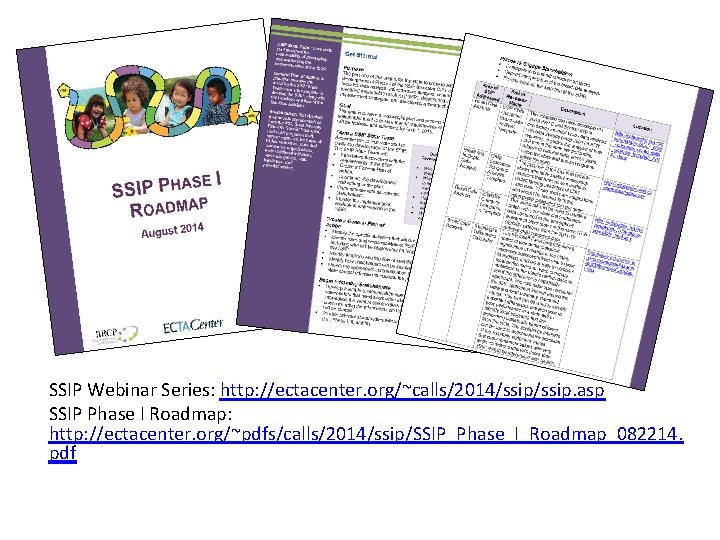
SSIP Webinar Series: http: //ectacenter. org/~calls/2014/ssip. asp SSIP Phase I Roadmap: http: //ectacenter. org/~pdfs/calls/2014/ssip/SSIP_Phase_I_Roadmap_082214. pdf
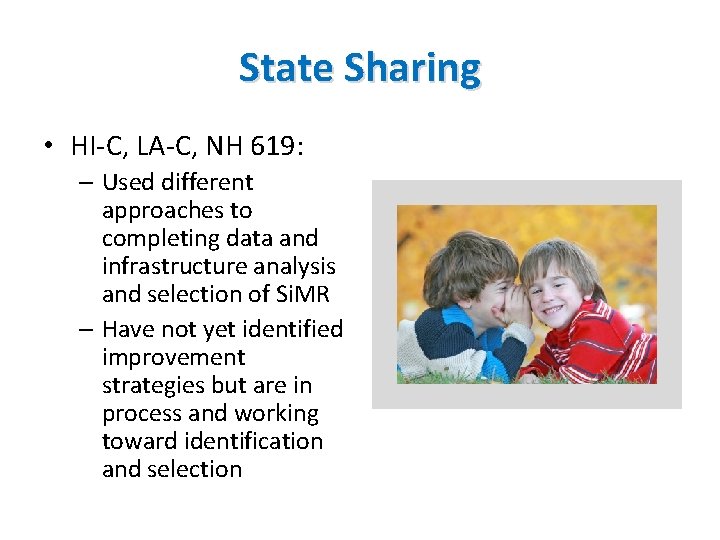
State Sharing • HI-C, LA-C, NH 619: – Used different approaches to completing data and infrastructure analysis and selection of Si. MR – Have not yet identified improvement strategies but are in process and working toward identification and selection
State Systemic Improvement Plan (SSIP) Hawaii Part C
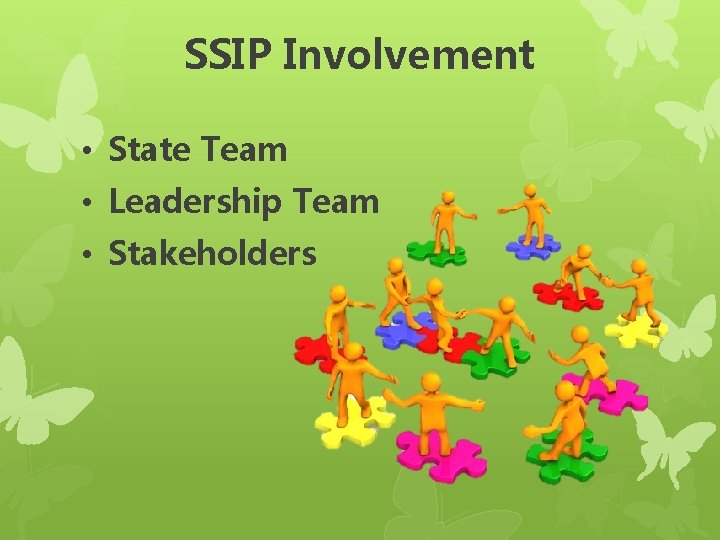
SSIP Involvement • State Team • Leadership Team • Stakeholders
Phase I – Data Analysis • Child Outcomes Data üLocal Programs üState üNational • 618 Child Count Data • Anecdotal Information
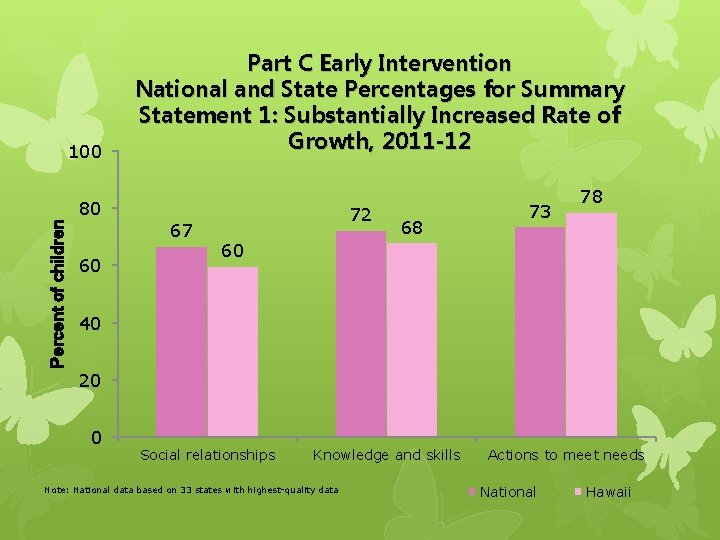
100 Part C Early Intervention National and State Percentages for Summary Statement 1: Substantially Increased Rate of Growth, 2011 -12 Percent of children 80 67 60 72 68 73 78 60 40 20 0 Social relationships Knowledge and skills Note: National data based on 33 states with highest-quality data Actions to meet needs National Hawaii
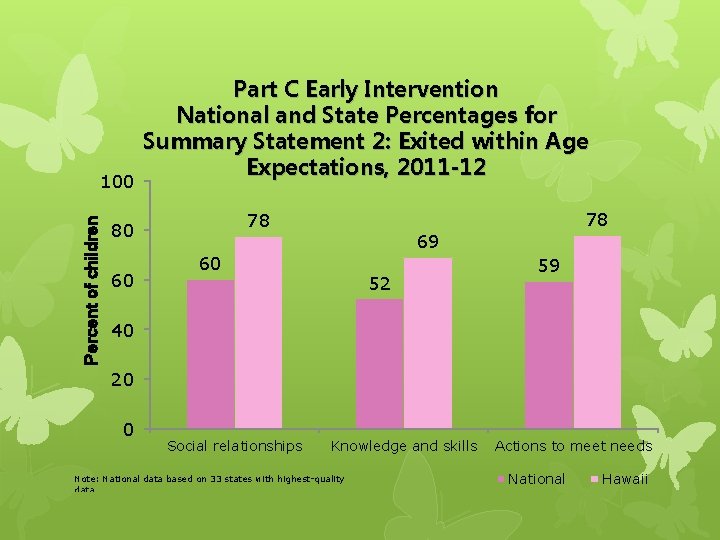
Percent of children 100 Part C Early Intervention National and State Percentages for Summary Statement 2: Exited within Age Expectations, 2011 -12 60 78 78 80 69 60 52 59 40 20 0 Social relationships Knowledge and skills Note: National data based on 33 states with highest-quality data Actions to meet needs National Hawaii
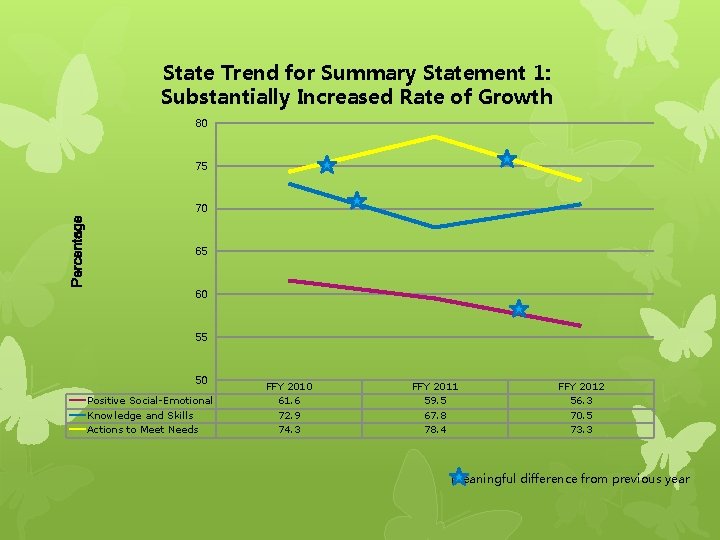
State Trend for Summary Statement 1: Substantially Increased Rate of Growth 80 75 Percentage 70 65 60 55 50 Positive Social-Emotional Knowledge and Skills Actions to Meet Needs FFY 2010 61. 6 72. 9 74. 3 FFY 2011 59. 5 67. 8 78. 4 FFY 2012 56. 3 70. 5 73. 3 Meaningful difference from previous year
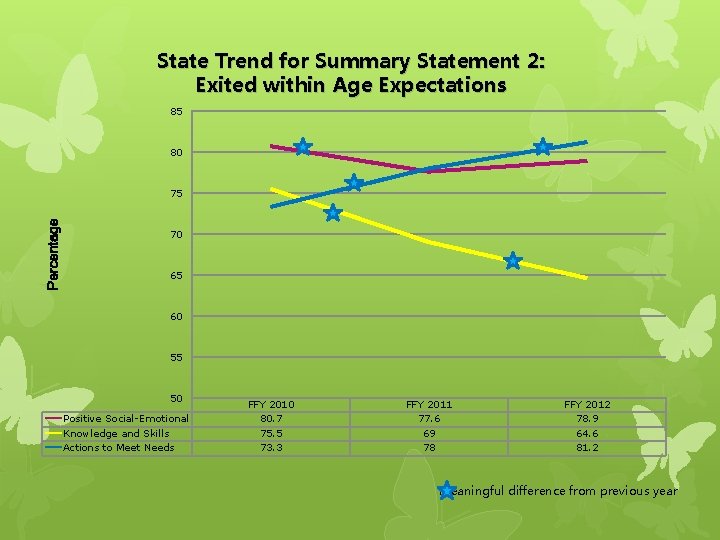
State Trend for Summary Statement 2: Exited within Age Expectations 85 80 Percentage 75 70 65 60 55 50 Positive Social-Emotional Knowledge and Skills Actions to Meet Needs FFY 2010 80. 7 75. 5 73. 3 FFY 2011 77. 6 69 78 FFY 2012 78. 9 64. 6 81. 2 Meaningful difference from previous year
Focus Area “Social Emotional Skills” • Broad Data Analysis • Hot topic üInterest üInformation/resources available • Alignment with State Initiative • Mental health services are costly • Critical for overall development
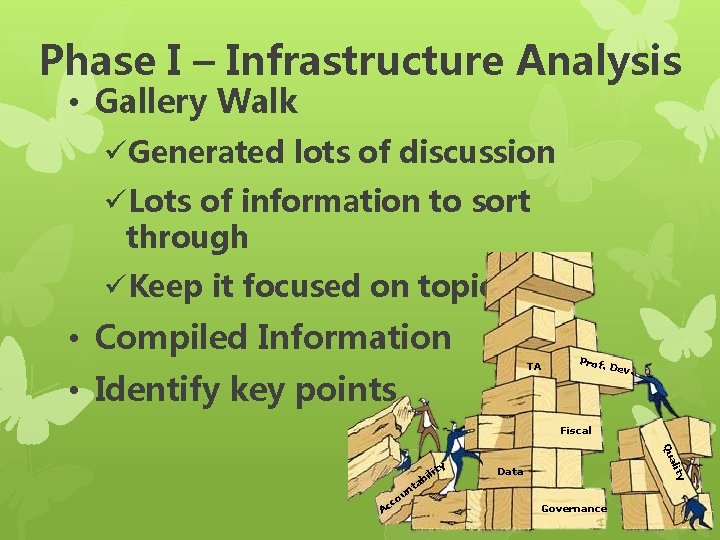
Phase I – Infrastructure Analysis • Gallery Walk üGenerated lots of discussion üLots of information to sort through üKeep it focused on topic area • Compiled Information TA • Identify key points Prof. Dev. Fiscal nt Ac u co ty ali Qu ty ili ab Data Governance
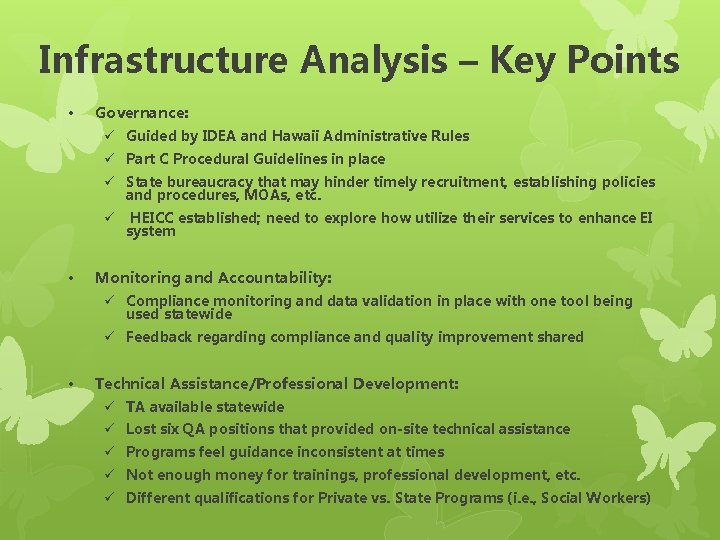
Infrastructure Analysis – Key Points • Governance: ü Guided by IDEA and Hawaii Administrative Rules ü Part C Procedural Guidelines in place ü State bureaucracy that may hinder timely recruitment, establishing policies and procedures, MOAs, etc. ü • HEICC established; need to explore how utilize their services to enhance EI system Monitoring and Accountability: ü Compliance monitoring and data validation in place with one tool being used statewide ü Feedback regarding compliance and quality improvement shared • Technical Assistance/Professional Development: ü TA available statewide ü Lost six QA positions that provided on-site technical assistance ü Programs feel guidance inconsistent at times ü Not enough money for trainings, professional development, etc. ü Different qualifications for Private vs. State Programs (i. e. , Social Workers)
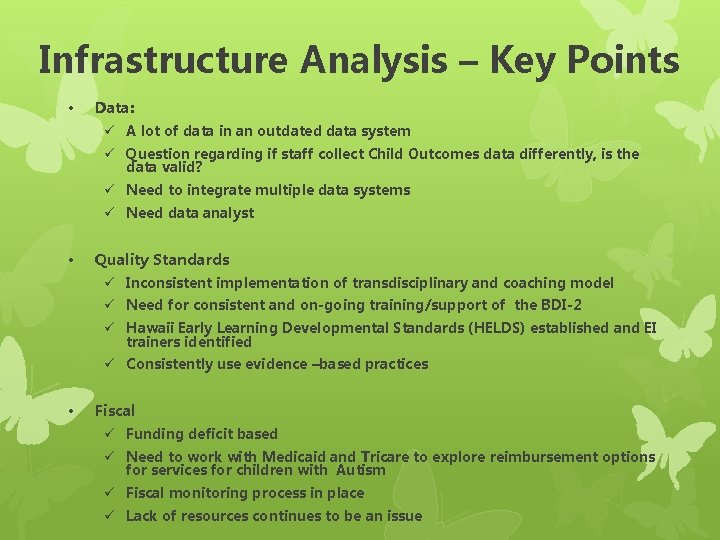
Infrastructure Analysis – Key Points • Data: ü A lot of data in an outdated data system ü Question regarding if staff collect Child Outcomes data differently, is the data valid? ü Need to integrate multiple data systems ü Need data analyst • Quality Standards ü Inconsistent implementation of transdisciplinary and coaching model ü Need for consistent and on-going training/support of the BDI-2 ü Hawaii Early Learning Developmental Standards (HELDS) established and EI trainers identified ü Consistently use evidence –based practices • Fiscal ü Funding deficit based ü Need to work with Medicaid and Tricare to explore reimbursement options for services for children with Autism ü Fiscal monitoring process in place ü Lack of resources continues to be an issue
Phase I – Focus Area • State-identified Measurable Result for Infants and Toddlers with Special Needs “What identified area, which when implemented or resolved, has the potential to generate the highest leverage for improving outcomes/results for children with disabilities? ”
Phase I – Root Cause Analysis • Small group discussion with stakeholders • Compiled information • Identified additional data that must be analyzed.
SSIP Status • Activities completed üInformed broad stakeholder group about SSIP üBroad data analysis üIdentified focus area üBroad infrastructure analysis üBroad root cause analysis
Next Steps • Identify SIMR • Identify root causes including barriers and leverage points to address root causes ü Create hypotheses of potential root causes ü Develop questions to confirm/reject hypotheses ü Interview high/low performing programs ü Determine root causes • Develop evidence-based improvement strategies • Create Theory of Action
Louisiana: SICC Strategic Plan and State System Improvem ent Process (SSIP) State Interagency Coordinating Council
Stakeholder involvement in Early. Steps Louisiana SICC+ Lead Agency + Stakeholders= Louisiana Part C
Early. Steps Strategic Plan: 3 Strategic Directions: Improving the System Enhancing Services and Accountability Improving Efficiency and Access
Beginning the new APR and SSIP discussion Where to Start? Review the Proposed SSIP with initial release Discussions with SERRC July 2013 presentation to SICC on proposed APR/SSIP SICC voted to host a retreat to begin planning for the SSIP—held September, 2013 Smaller workgroup planning in December, 2013 February and March 2014 Regular calls with SERRC Full Workgroup meetings at April and July, 2014 SICC meetings
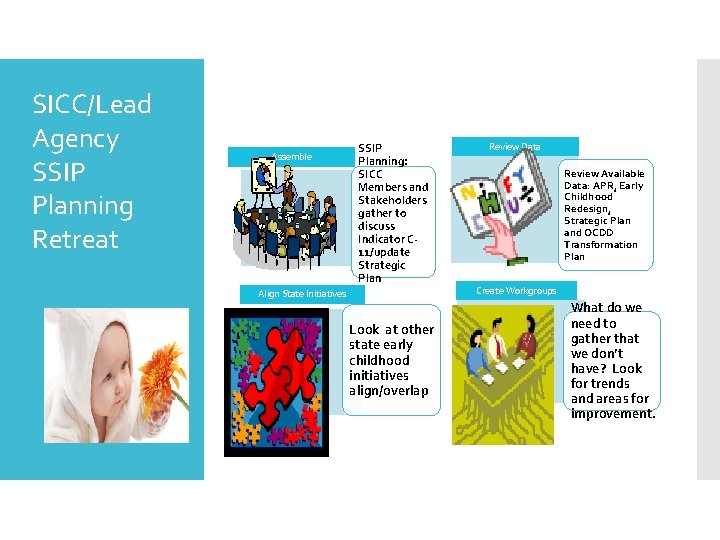
SICC/Lead Agency SSIP Planning Retreat Assemble SSIP Planning: SICC Members and Stakeholders gather to discuss Indicator C 11/update Strategic Plan Align State Initiatives Look at other state early childhood initiatives align/overlap Review Data Review Available Data: APR, Early Childhood Redesign, Strategic Plan and OCDD Transformation Plan Create Workgroups What do we need to gather that we don’t have? Look for trends and areas for improvement.
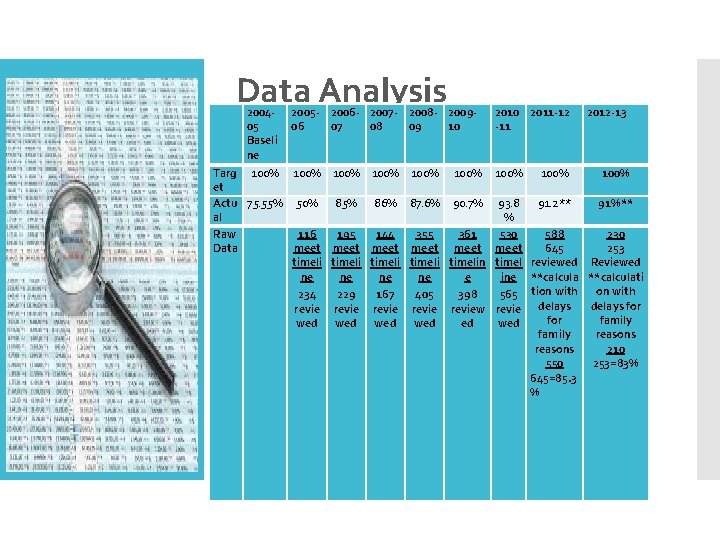
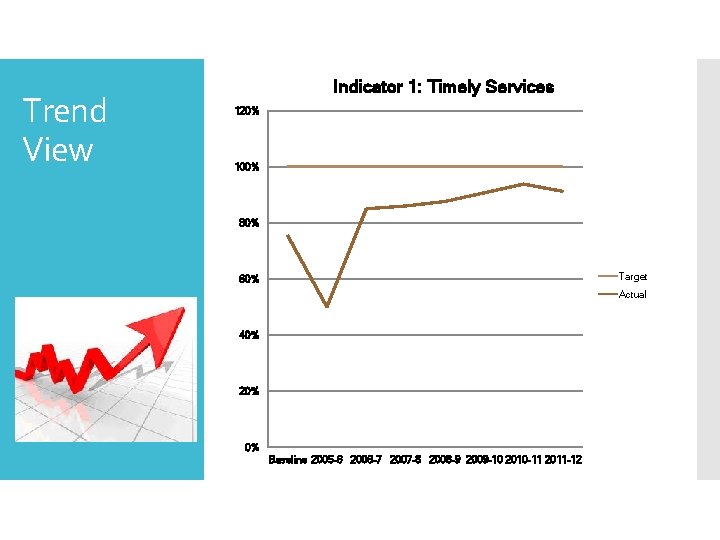
Data Analysis 200405 Baseli ne Targ 100% et Actu 75. 55% al Raw Data 2005 - 2006 - 2007 - 2008 - 200906 07 08 09 10 2011 -12 -11 100% 100% 50% 90. 7% 85% 86% 87. 6% 100% 2012 -13 100% 93. 8 91. 2** 91%** % 116 195 144 355 361 530 588 230 meet meet 645 253 timeli timelin timel reviewed Reviewed ne ne e ine **calculati 234 229 167 405 398 565 tion with revie review revie delays for family wed wed family reasons 210 550 253=83% 645=85. 3 %
Trend View Indicator 1: Timely Services 120% 100% 80% Target 60% Actual 40% 20% 0% Baseline 2005 -6 2006 -7 2007 -8 2008 -9 2009 -10 2010 -11 2011 -12
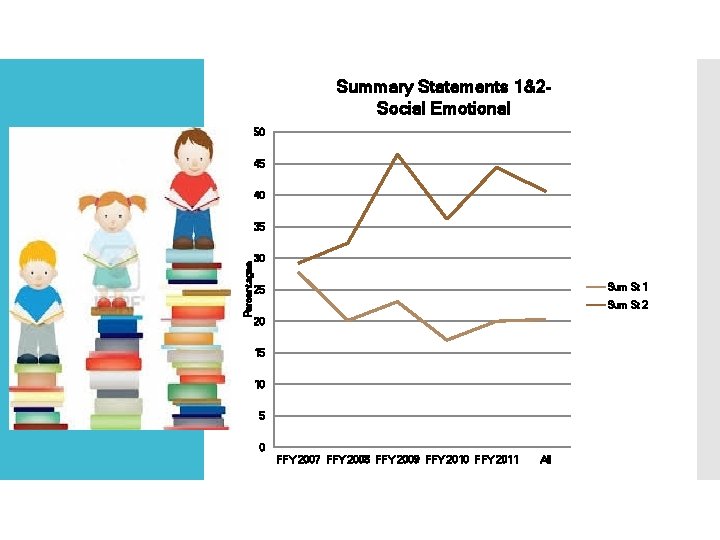
Summary Statements 1&2 Social Emotional 50 45 40 Percentagee 35 30 Sum St 1 25 Sum St 2 20 15 10 5 0 FFY 2007 FFY 2008 FFY 2009 FFY 2010 FFY 2011 All
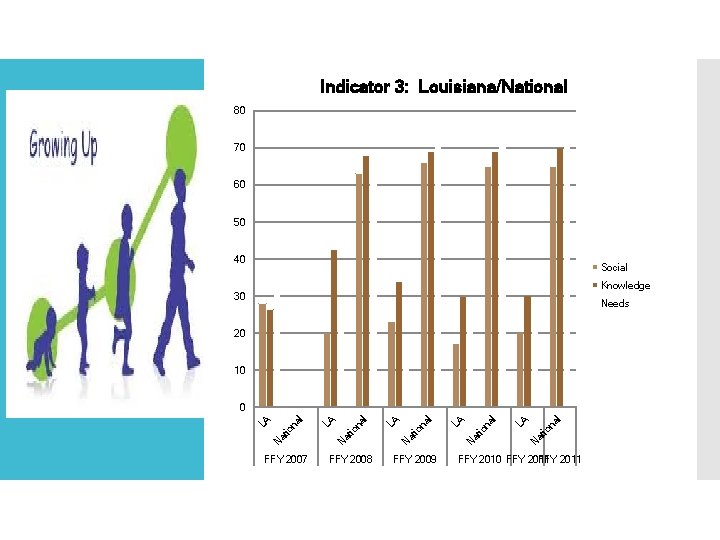
Indicator 3: Louisiana/National 80 70 60 50 40 Social Knowledge 30 Needs 20 10 FFY 2007 FFY 2008 FFY 2009 l at io na LA N l N at io na LA l at io na LA N N at io na LA l 0 FFY 2011
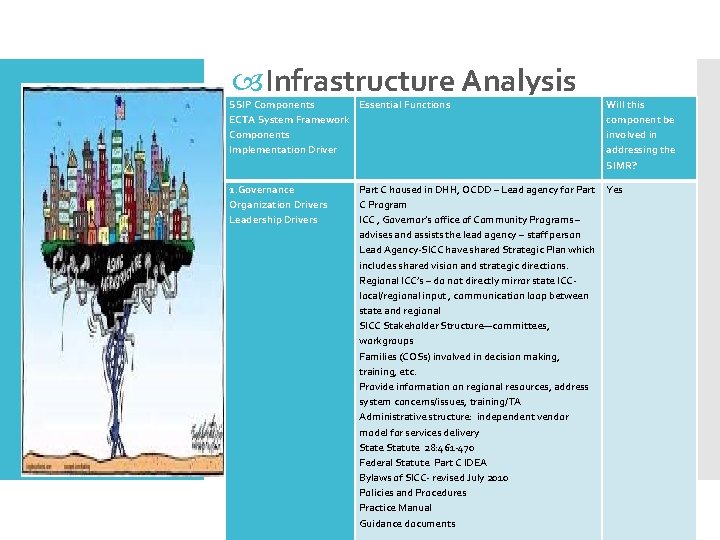
Infrastructure Analysis SSIP Components Essential Functions ECTA System Framework Components Implementation Driver 1. Governance Organization Drivers Leadership Drivers Will this component be involved in addressing the SIMR? Part C housed in DHH, OCDD – Lead agency for Part Yes C Program ICC , Governor’s office of Community Programs – advises and assists the lead agency – staff person Lead Agency-SICC have shared Strategic Plan which includes shared vision and strategic directions. Regional ICC’s – do not directly mirror state ICC- local/regional input , communication loop between state and regional SICC Stakeholder Structure—committees, workgroups Families (COSs) involved in decision making, training, etc. Provide information on regional resources, address system concerns/issues, training/TA Administrative structure: independent vendor model for services delivery State Statute 28: 461 -470 Federal Statute Part C IDEA Bylaws of SICC- revised July 2010 Policies and Procedures Practice Manual Guidance documents
Next Steps: Finalizing the Measureable Result Use identified areas of improvement from Strategic Plan Improve Child Outcome indicator measurement process Align with Louisiana’s Early Care and Education Initiative Address fragmentation of service delivery
New Hampshire: On the road to Improving Outcomes for Children with Disabilities Presented By Ruth Littlefield NH Department of Education 619 Coordinator
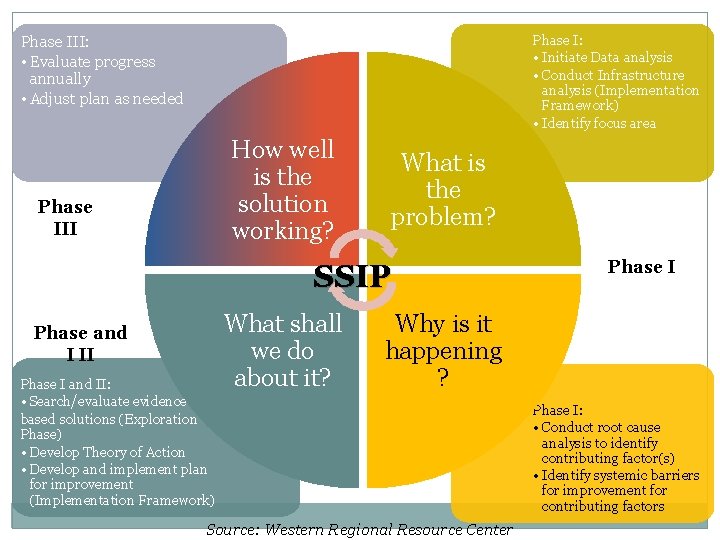
Phase III: • Evaluate progress annually • Adjust plan as needed Phase I: • Initiate Data analysis • Conduct Infrastructure analysis (Implementation Framework) • Identify focus area How well is the solution working? Phase III What is the problem? SSIP Phase and I II Phase I and II: • Search/evaluate evidencebased solutions (Exploration Phase) • Develop Theory of Action • Develop and implement plan for improvement (Implementation Framework) What shall we do about it? Phase I Why is it happening ? Source: Western Regional Resource Center Phase I: • Conduct root cause analysis to identify contributing factor(s) • Identify systemic barriers for improvement for contributing factors
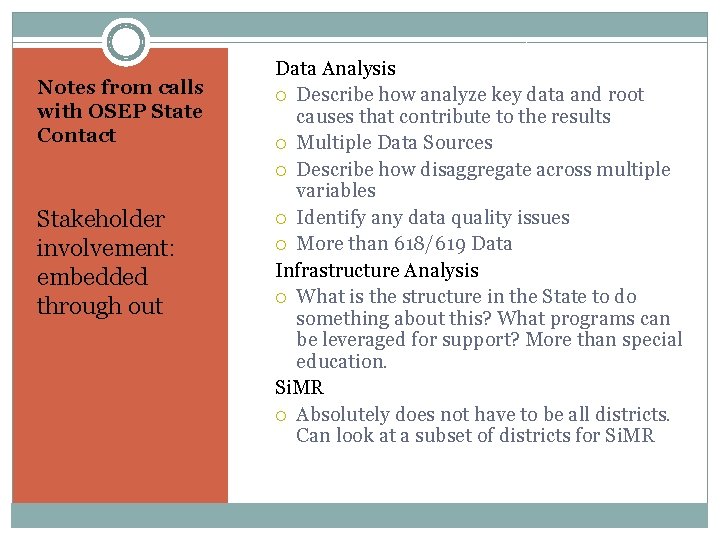
Notes from calls with OSEP State Contact Stakeholder involvement: embedded through out Data Analysis Describe how analyze key data and root causes that contribute to the results Multiple Data Sources Describe how disaggregate across multiple variables Identify any data quality issues More than 618/619 Data Infrastructure Analysis What is the structure in the State to do something about this? What programs can be leveraged for support? More than special education. Si. MR Absolutely does not have to be all districts. Can look at a subset of districts for Si. MR
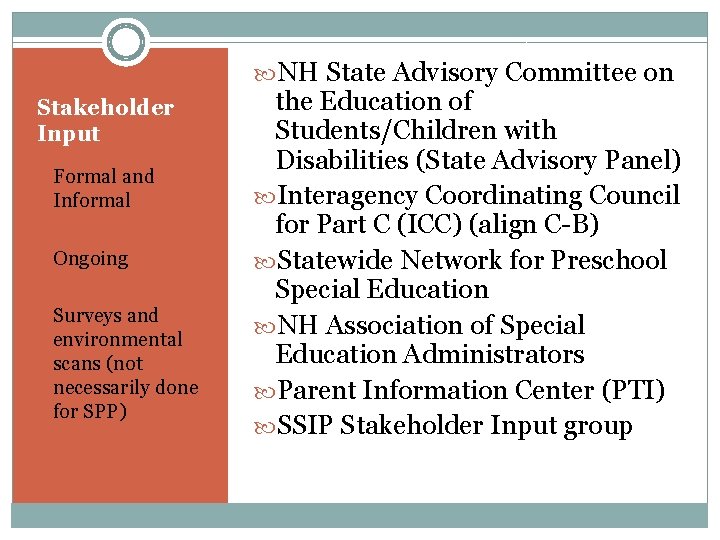
NH State Advisory Committee on Stakeholder Input Formal and Informal Ongoing Surveys and environmental scans (not necessarily done for SPP) the Education of Students/Children with Disabilities (State Advisory Panel) Interagency Coordinating Council for Part C (ICC) (align C-B) Statewide Network for Preschool Special Education NH Association of Special Education Administrators Parent Information Center (PTI) SSIP Stakeholder Input group
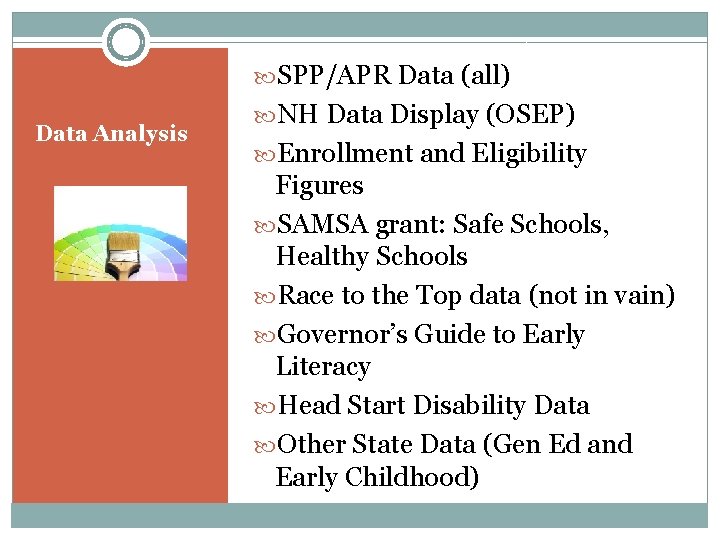
SPP/APR Data (all) Data Analysis NH Data Display (OSEP) Enrollment and Eligibility Figures SAMSA grant: Safe Schools, Healthy Schools Race to the Top data (not in vain) Governor’s Guide to Early Literacy Head Start Disability Data Other State Data (Gen Ed and Early Childhood)
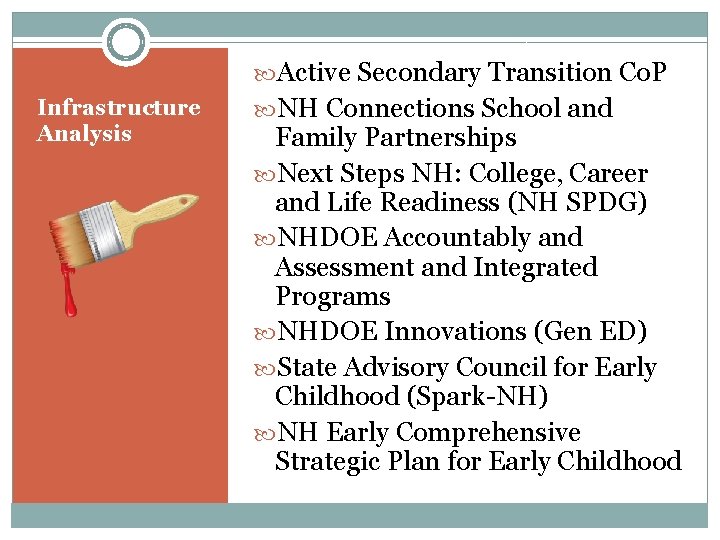
Active Secondary Transition Co. P Infrastructure Analysis NH Connections School and Family Partnerships Next Steps NH: College, Career and Life Readiness (NH SPDG) NHDOE Accountably and Assessment and Integrated Programs NHDOE Innovations (Gen ED) State Advisory Council for Early Childhood (Spark-NH) NH Early Comprehensive Strategic Plan for Early Childhood
Begin in-depth analysis of child Data Analysis Outcome Data Compare to National Results Compare tool to tool Review Cell Size(of 174 districts, 88 have fewer than 5 exiting, 34 have 6 -10 exiting and only 7 have more than 25) District Enrollment for PSE Compare over time (targets, SS 1 and SS 2 by Outcome area) LRE data, Parent Survey, Kindergarten Entry, Exit Part C, Referral Source Identify data challenges/limitations
Data Drill Down Can get messy
Pairing Indicator 6 with Indicator Data 7 (by district) Considering factors such as: Race/ethnicity Poverty Regional differences Rural vs urban (District Size) Referral source (Part C and other)
Infrastructure Drill down Infrastructure Analysis Spark NH (EC Advisory Council) Family Centered Early Supports and Services (Part C) Title 1 Preschool Special Education Special Projects (networks, TA systems) SEE-Change TQRIS &Early Learning Standards NH Association of School Principals and Coos Coalition for Young Children and Families Infant Mental Health Association Institutes of Higher Education
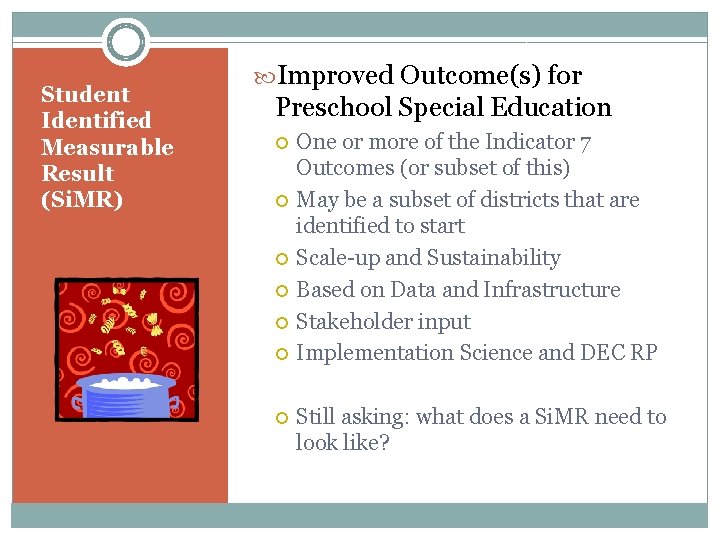
Student Identified Measurable Result (Si. MR) Improved Outcome(s) for Preschool Special Education One or more of the Indicator 7 Outcomes (or subset of this) May be a subset of districts that are identified to start Scale-up and Sustainability Based on Data and Infrastructure Stakeholder input Implementation Science and DEC RP Still asking: what does a Si. MR need to look like?
Need more Improvement Activities and Theory of Action To Be Determined…. . Drill-down of data and root cause analysis Exploration of infrastructure (strengths and weaknesses) Stakeholder input
Small Group Discussion • At your table decide if you will discuss: – data analysis – infrastructure analysis • Discuss the following: – What is working well – How you designed your process for conducting analysis of this component to help you identify improvement strategies – Lessons Learned • Decide what 1 item to share back with the full group from each
Large Group Discussion • What are your thoughts about your Si. MR? • What might it look like?
Contact Information Stacy Kong stacy. kong@doh. hawaii. gov Brenda Sharp Brenda. Sharp@LA. gov Littlefield, Ruth. Littlefield@doe. nh. gov Anne Lucas Anne. Lucas@unc. edu