
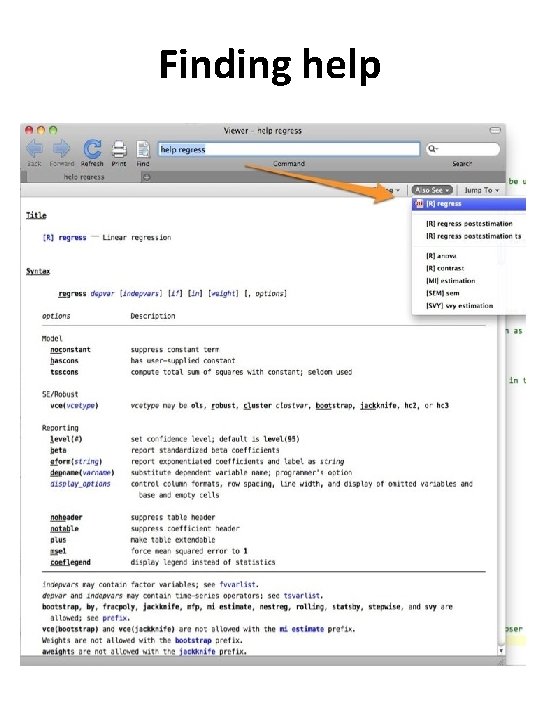
Finding help Stata manuals You have all these



- Slides: 25
Finding help
Stata manuals You have all these as pdf! Check the folder /Stata 12/docs
ASSUMPTION CHECKING AND OTHER NUISANCES • In regression analysis with Stata • In logistic regression analysis with Stata NOTE: THIS WILL BE EASIER IN Stata THAN IT WAS IN SPSS
Assumption checking in “normal” multiple regression with Stata
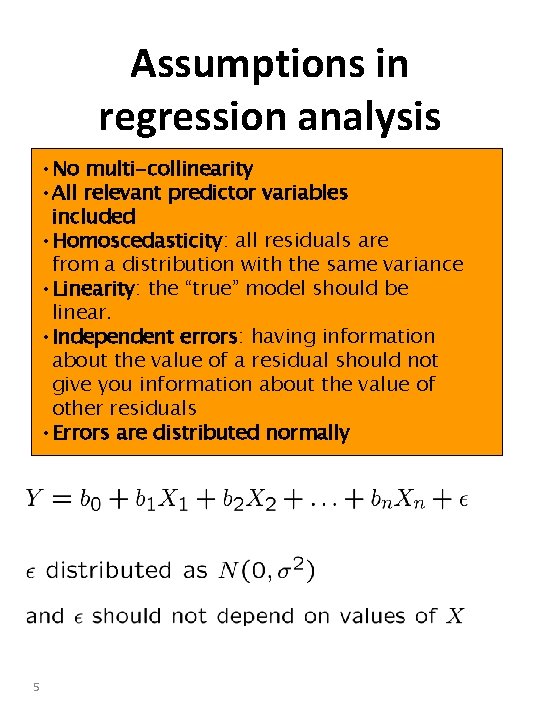
Assumptions in regression analysis • No multi-collinearity • All relevant predictor variables included • Homoscedasticity: all residuals are from a distribution with the same variance • Linearity: the “true” model should be linear. • Independent errors: having information about the value of a residual should not give you information about the value of other residuals • Errors are distributed normally 5
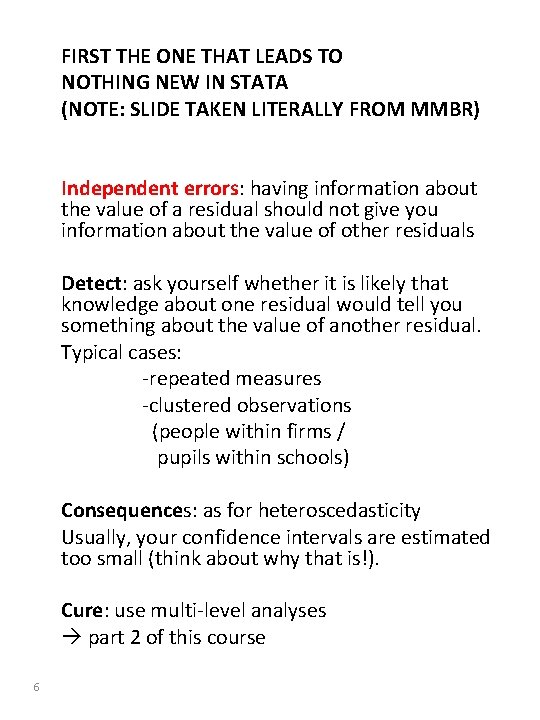
FIRST THE ONE THAT LEADS TO NOTHING NEW IN STATA (NOTE: SLIDE TAKEN LITERALLY FROM MMBR) Independent errors: having information about the value of a residual should not give you information about the value of other residuals Detect: ask yourself whether it is likely that knowledge about one residual would tell you something about the value of another residual. Typical cases: -repeated measures -clustered observations (people within firms / pupils within schools) Consequences: as for heteroscedasticity Usually, your confidence intervals are estimated too small (think about why that is!). Cure: use multi-level analyses part 2 of this course 6
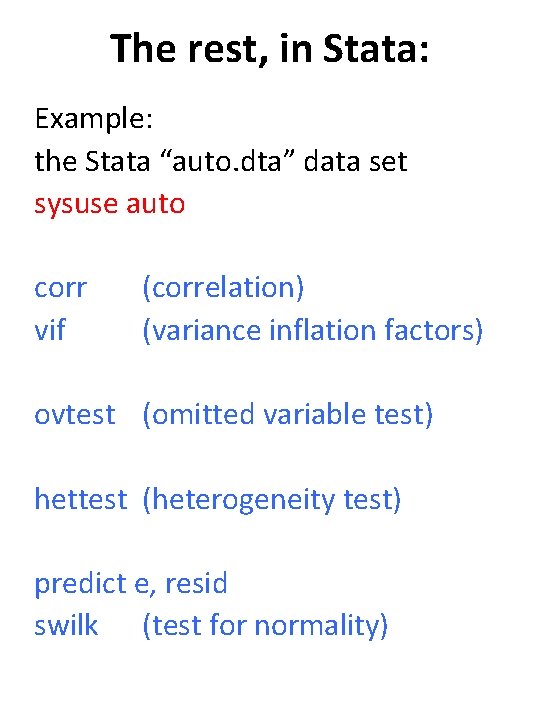
The rest, in Stata: Example: the Stata “auto. dta” data set sysuse auto corr vif (correlation) (variance inflation factors) ovtest (omitted variable test) hettest (heterogeneity test) predict e, resid swilk (test for normality)
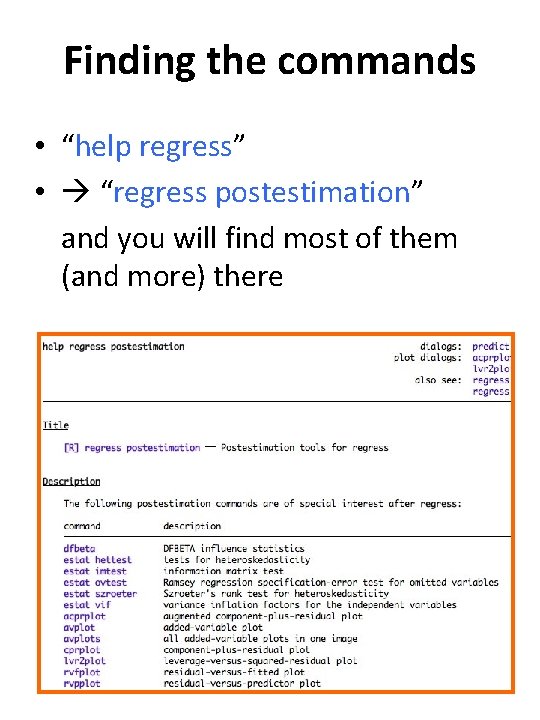
Finding the commands • “help regress” • “regress postestimation” and you will find most of them (and more) there
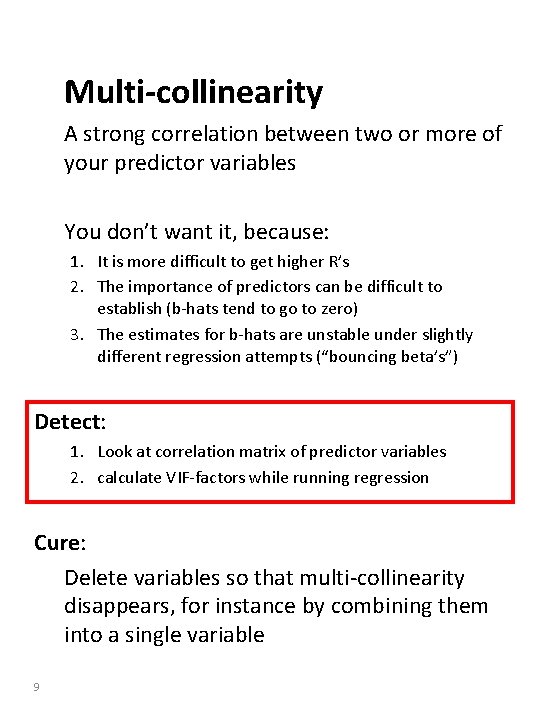
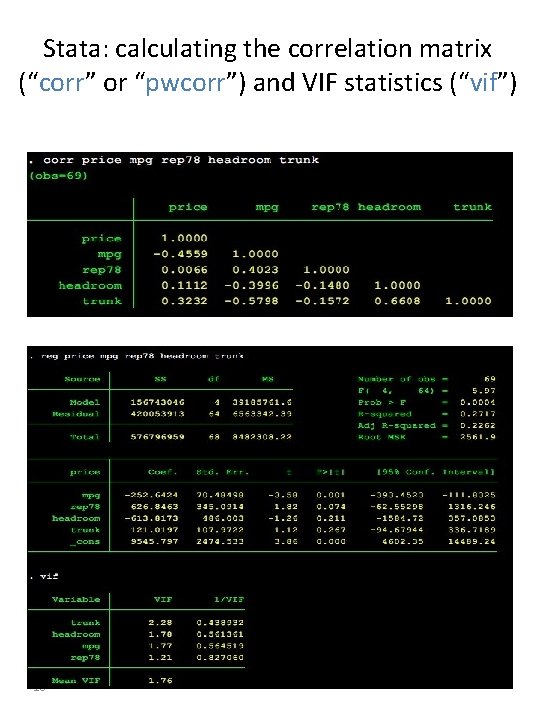
Multi-collinearity A strong correlation between two or more of your predictor variables You don’t want it, because: 1. It is more difficult to get higher R’s 2. The importance of predictors can be difficult to establish (b-hats tend to go to zero) 3. The estimates for b-hats are unstable under slightly different regression attempts (“bouncing beta’s”) Detect: 1. Look at correlation matrix of predictor variables 2. calculate VIF-factors while running regression Cure: Delete variables so that multi-collinearity disappears, for instance by combining them into a single variable 9
Stata: calculating the correlation matrix (“corr” or “pwcorr”) and VIF statistics (“vif”) 10
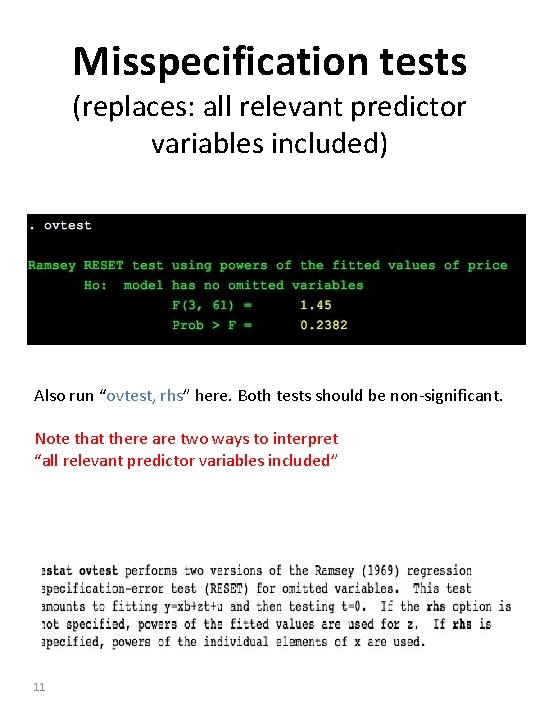
Misspecification tests (replaces: all relevant predictor variables included) Also run “ovtest, rhs” here. Both tests should be non-significant. Note that there are two ways to interpret “all relevant predictor variables included” 11
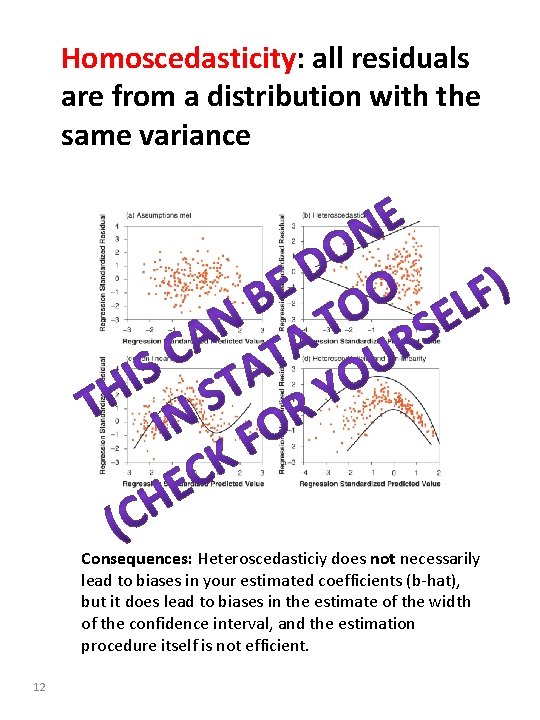
Homoscedasticity: all residuals are from a distribution with the same variance Consequences: Heteroscedasticiy does not necessarily lead to biases in your estimated coefficients (b-hat), but it does lead to biases in the estimate of the width of the confidence interval, and the estimation procedure itself is not efficient. 12
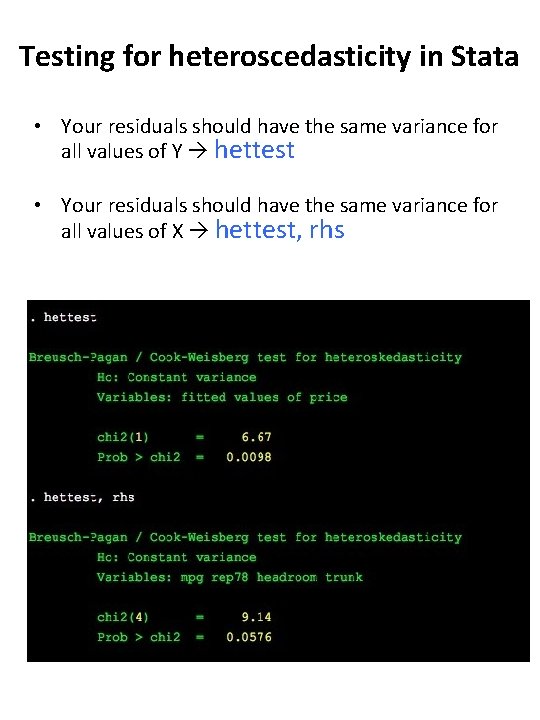
Testing for heteroscedasticity in Stata • Your residuals should have the same variance for all values of Y hettest • Your residuals should have the same variance for all values of X hettest, rhs
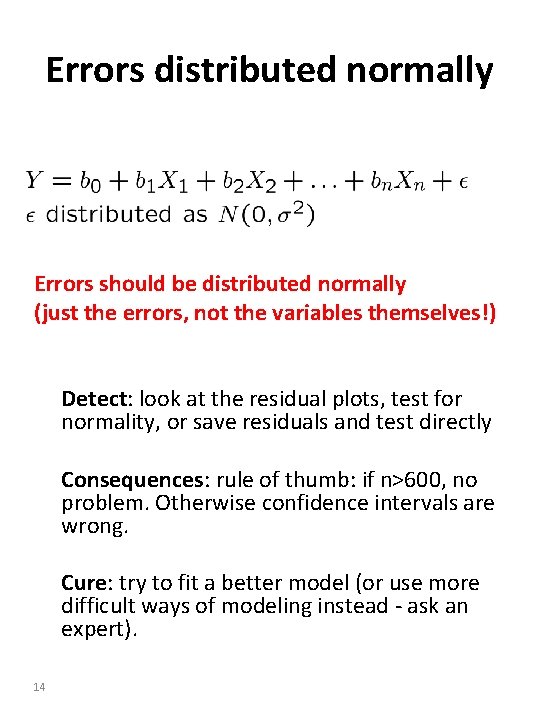
Errors distributed normally Errors should be distributed normally (just the errors, not the variables themselves!) Detect: look at the residual plots, test for normality, or save residuals and test directly Consequences: rule of thumb: if n>600, no problem. Otherwise confidence intervals are wrong. Cure: try to fit a better model (or use more difficult ways of modeling instead - ask an expert). 14
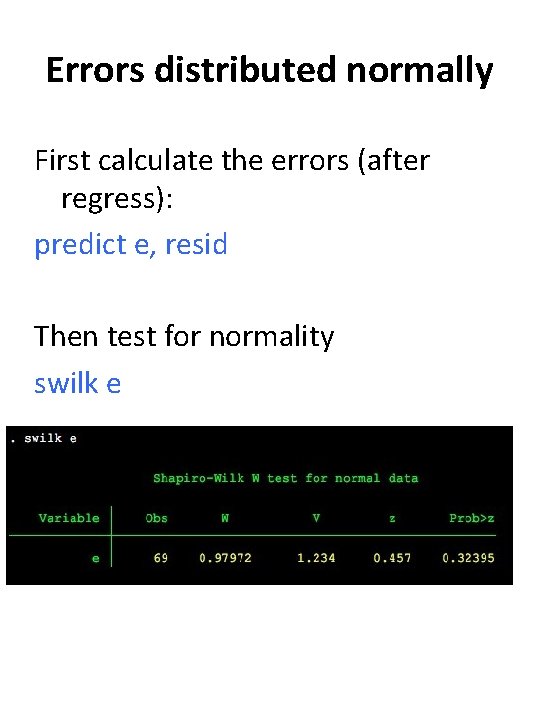
Errors distributed normally First calculate the errors (after regress): predict e, resid Then test for normality swilk e
Assumption checking in logistic regression with Stata Note: based on http: //www. ats. ucla. edu/stata/we bbooks/logistic/chapter 3/statalog 3. ht m
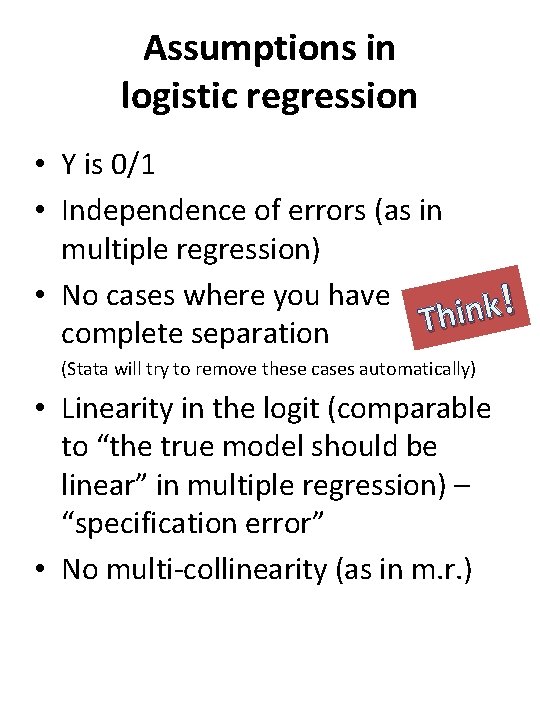
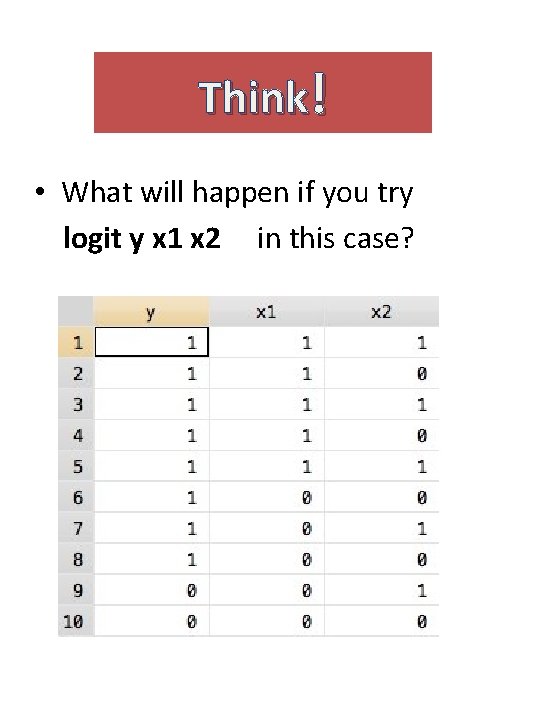
Assumptions in logistic regression • Y is 0/1 • Independence of errors (as in multiple regression) • No cases where you have ! k n i Th complete separation (Stata will try to remove these cases automatically) • Linearity in the logit (comparable to “the true model should be linear” in multiple regression) – “specification error” • No multi-collinearity (as in m. r. )
Think! • What will happen if you try logit y x 1 x 2 in this case?
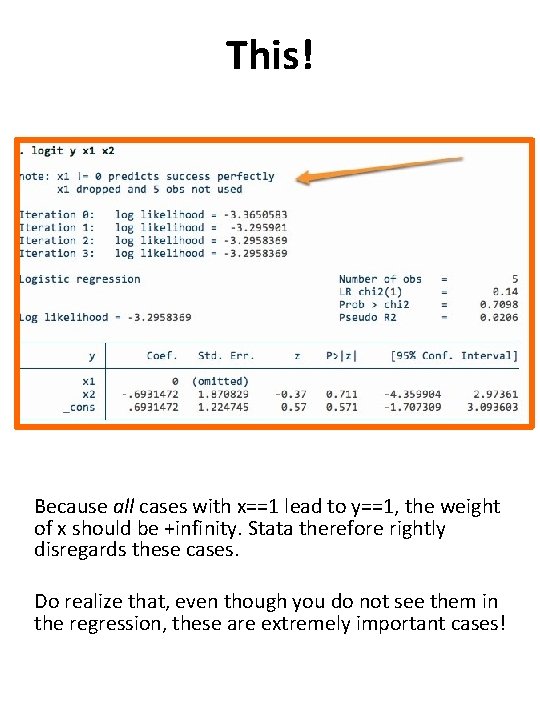
This! Because all cases with x==1 lead to y==1, the weight of x should be +infinity. Stata therefore rightly disregards these cases. Do realize that, even though you do not see them in the regression, these are extremely important cases!
(checking for) multi-collinearity • In regression, we had “vif” • Here we need to download a command that a user-created: “collin” (try “findit collin” in Stata)
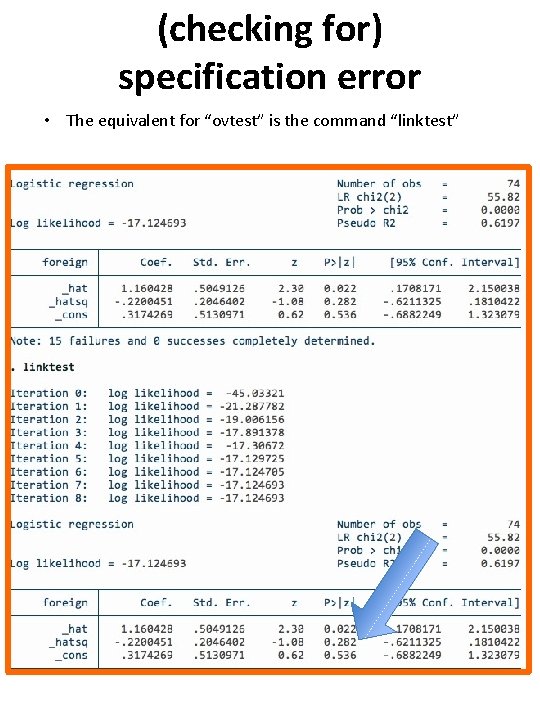
(checking for) specification error • The equivalent for “ovtest” is the command “linktest”
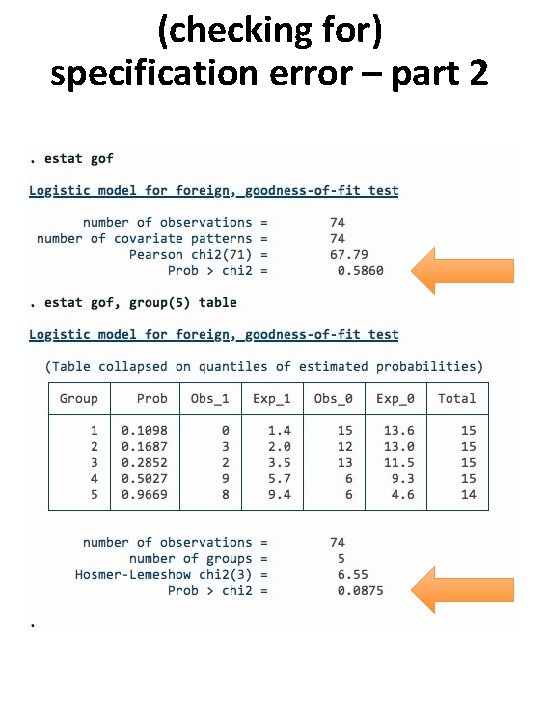
(checking for) specification error – part 2
Further things to do: • Check for useful transformations of variables, and interaction effects • Check for outliers / influential cases: 1) using a plot of stdres (against n) and dbeta (against n) 2) using a plot of ldfbeta’s (against n) 3) using regress and diag (but don’t tell anyone that I suggested this)
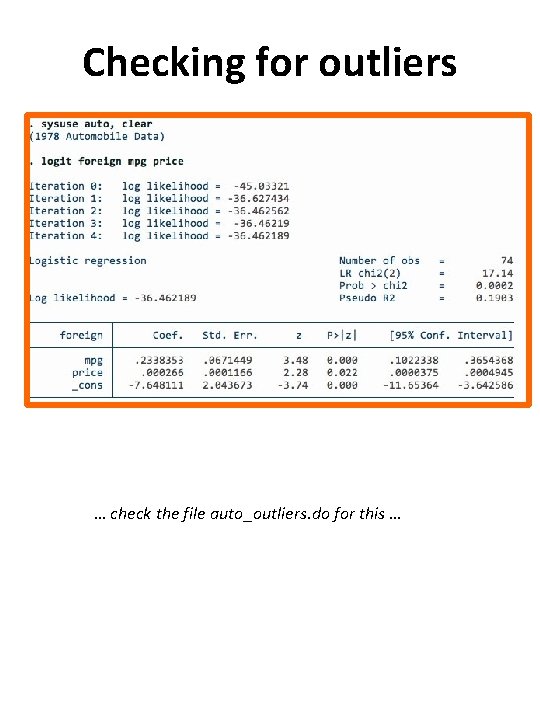
Checking for outliers … check the file auto_outliers. do for this …
Try the taxi tipping data