
FINANCIAL RATIO ANALYSIS AND BUDGET PREPARATION Mr Tony
FINANCIAL RATIO ANALYSIS AND BUDGET PREPARATION Mr. Tony Chan Lecturer Department of Accountancy The Hang Seng University of Hong Kong © Hong Kong Institute of Certified Public Accountants, 2019. All rights reserved.
OVERVIEW * Level 2 * REQUIRED C) Part I – An overall review of the Group’s financial performance … “Ratios not covered in Level 1” “Apply Average Figures” D) Part II – Formulate a business plan for the Group … (a) Trend Analysis (b) (c) Business plan - Marketing expense budget 2
Part 1: FINANCIAL RATIOS AND TREND ANALYSIS 3
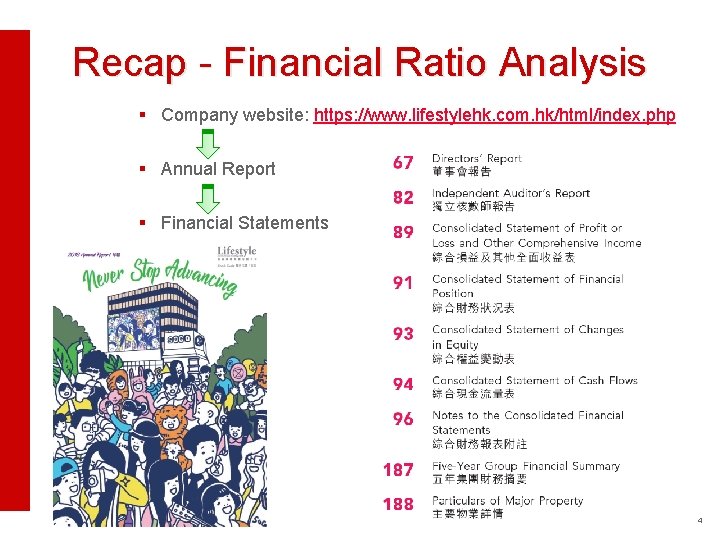
Recap - Financial Ratio Analysis § Company website: https: //www. lifestylehk. com. hk/html/index. php § Annual Report § Financial Statements 4
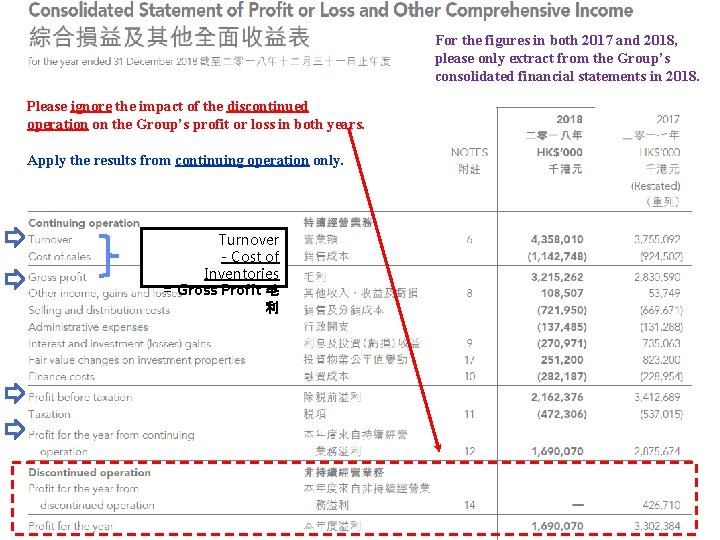
For the figures in both 2017 and 2018, please only extract from the Group’s consolidated financial statements in 2018. Please ignore the impact of the discontinued operation on the Group’s profit or loss in both years. Apply the results from continuing operation only. Turnover - Cost of Inventories = Gross Profit 毛 利 5
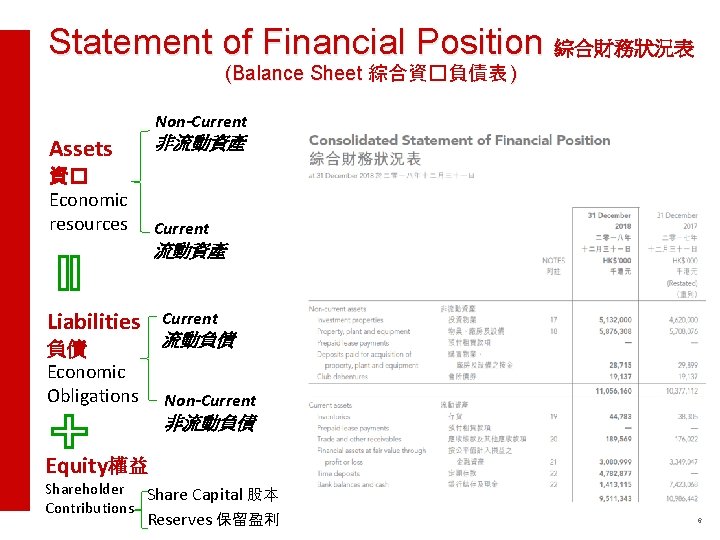
Statement of Financial Position 綜合財務狀況表 (Balance Sheet 綜合資�負債表 ) Non-Current Assets 資� Economic resources 非流動資產 Current 流動資產 Liabilities Current 負債 Economic Obligations Non-Current 流動負債 非流動負債 Equity權益 Shareholder Share Capital 股本 Contributions Reserves 保留盈利 6
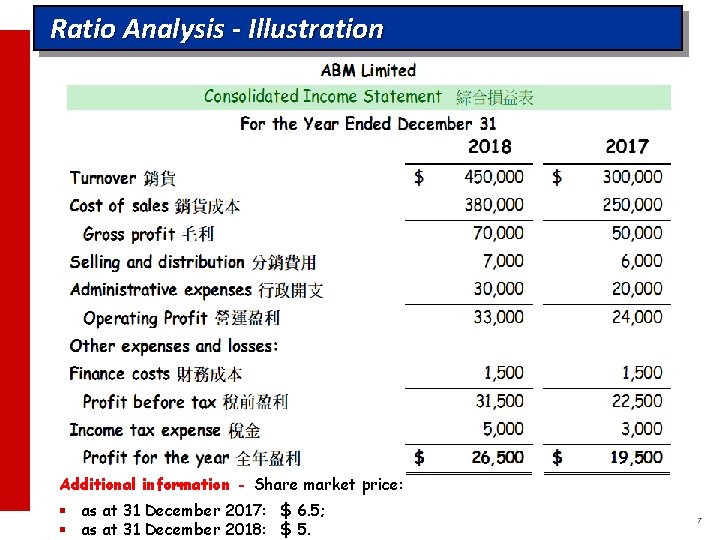
Ratio Analysis - Illustration 2018 2017 Additional information - Share market price: § as at 31 December 2017: $ 6. 5; § as at 31 December 2018: $ 5. 7
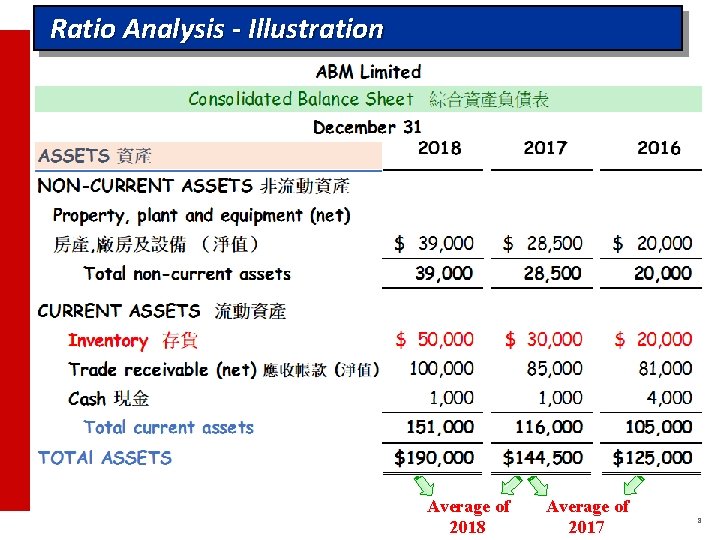
Ratio Analysis - Illustration Average of 2018 Average of 2017 8
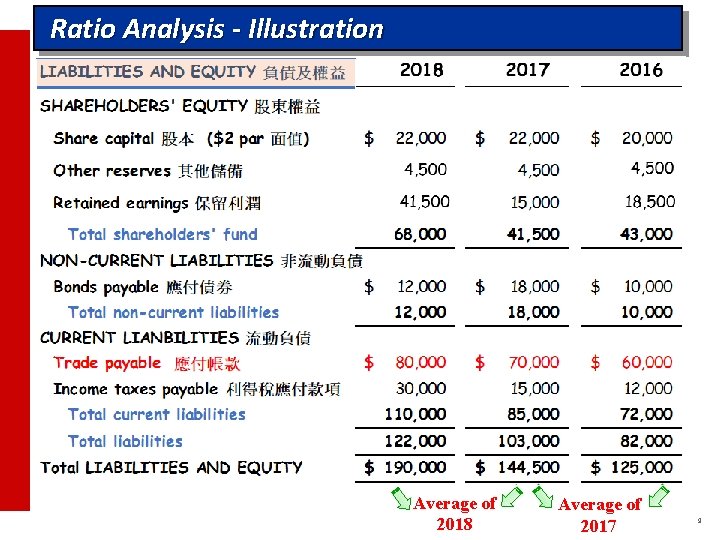
Ratio Analysis - Illustration Average of 2018 Average of 2017 9
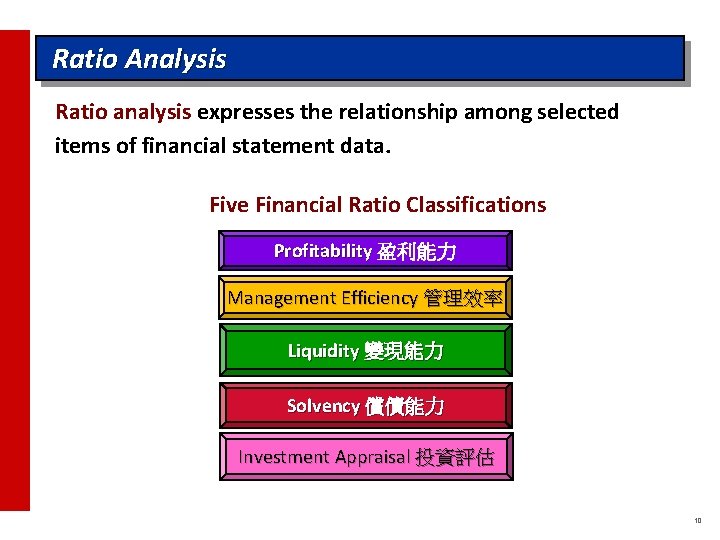
Ratio Analysis Ratio analysis expresses the relationship among selected items of financial statement data. Five Financial Ratio Classifications Profitability 盈利能力 Management Efficiency 管理效率 Liquidity 變現能力 Solvency 償債能力 Investment Appraisal 投資評估 10
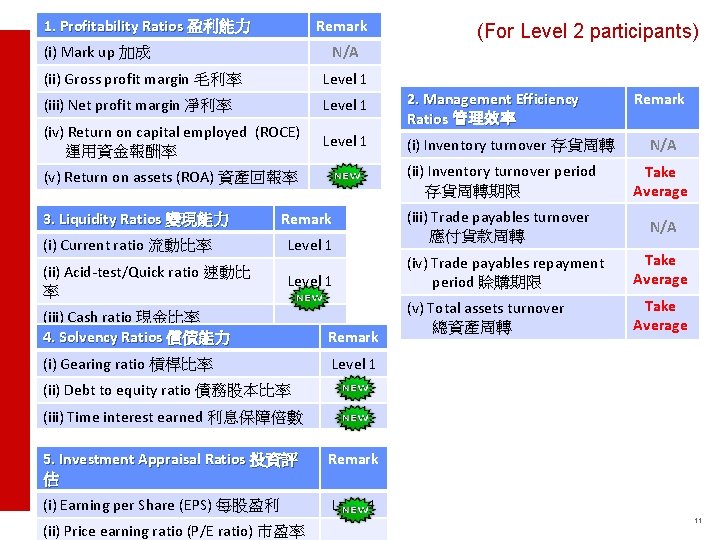
1. Profitability Ratios 盈利能力 Remark (i) Mark up 加成 N/A (For Level 2 participants) (ii) Gross profit margin 毛利率 Level 1 (iii) Net profit margin 凈利率 Level 1 (iv) Return on capital employed (ROCE) 運用資金報酬率 2. Management Efficiency Ratios 管理效率 Level 1 (i) Inventory turnover 存貨周轉 Remark N/A (v) Return on assets (ROA) 資產回報率 (ii) Inventory turnover period 存貨周轉期限 Take Average 3. Liquidity Ratios 變現能力 (iii) Trade payables turnover 應付貨款周轉 N/A Remark (i) Current ratio 流動比率 Level 1 (ii) Acid-test/Quick ratio 速動比 率 Level 1 (iii) Cash ratio 現金比率 4. Solvency Ratios 償債能力 Remark (i) Gearing ratio 槓桿比率 Level 1 (iv) Trade payables repayment period 賒購期限 Take Average (v) Total assets turnover 總資產周轉 Take Average (ii) Debt to equity ratio 債務股本比率 (iii) Time interest earned 利息保障倍數 5. Investment Appraisal Ratios 投資評 估 Remark (i) Earning per Share (EPS) 每股盈利 Level 1 (ii) Price earning ratio (P/E ratio) 市盈率 11
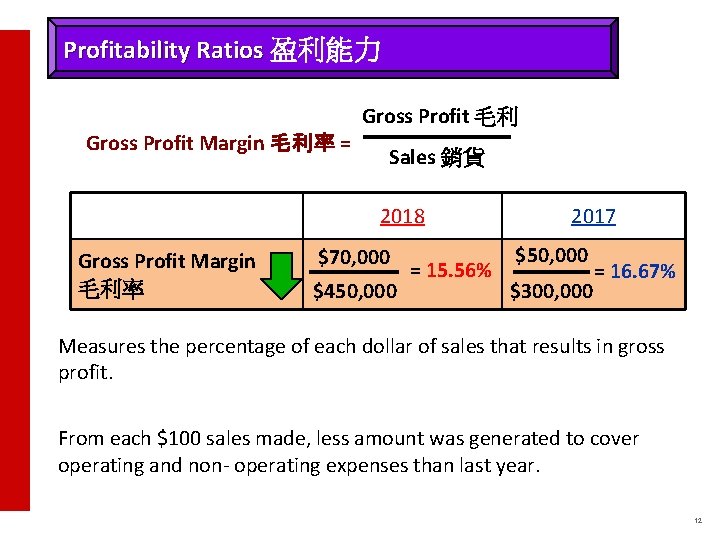
Profitability Ratios 盈利能力 Gross Profit 毛利 Gross Profit Margin 毛利率 = Sales 銷貨 2018 Gross Profit Margin 毛利率 $70, 000 $450, 000 = 15. 56% 2017 $50, 000 $300, 000 = 16. 67% Measures the percentage of each dollar of sales that results in gross profit. From each $100 sales made, less amount was generated to cover operating and non- operating expenses than last year. 12
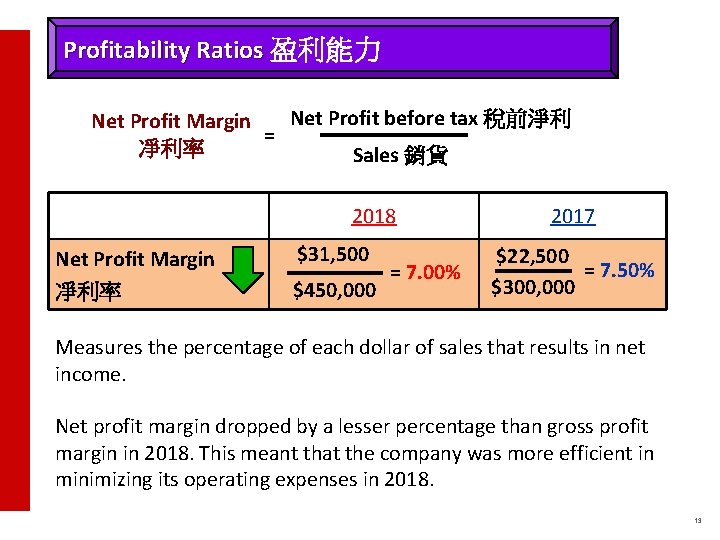
Profitability Ratios 盈利能力 Net Profit before tax 稅前淨利 Net Profit Margin = 凈利率 Sales 銷貨 2018 Net Profit Margin 凈利率 $31, 500 $450, 000 = 7. 00% 2017 $22, 500 = 7. 50% $300, 000 Measures the percentage of each dollar of sales that results in net income. Net profit margin dropped by a lesser percentage than gross profit margin in 2018. This meant that the company was more efficient in minimizing its operating expenses in 2018. 13
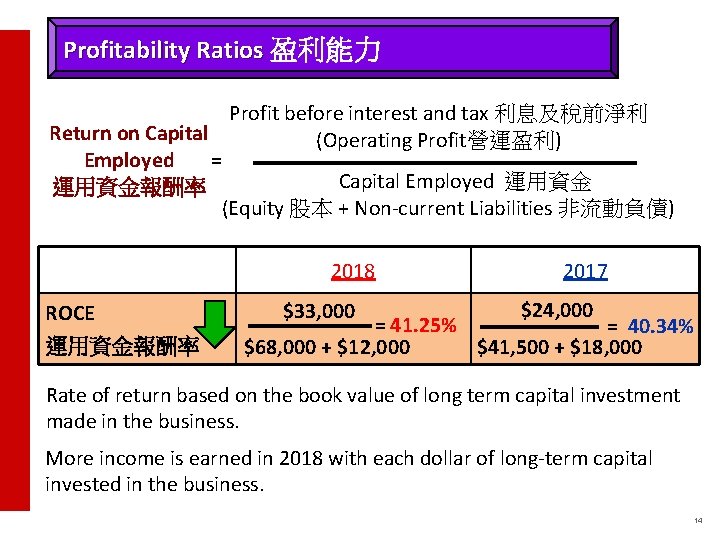
Profitability Ratios 盈利能力 Profit before interest and tax 利息及稅前淨利 Return on Capital (Operating Profit營運盈利) Employed = Capital Employed 運用資金報酬率 (Equity 股本 + Non-current Liabilities 非流動負債) 2018 ROCE 運用資金報酬率 $33, 000 2017 $24, 000 = 41. 25% = 40. 34% $68, 000 + $12, 000 $41, 500 + $18, 000 Rate of return based on the book value of long term capital investment made in the business. More income is earned in 2018 with each dollar of long-term capital invested in the business. 14
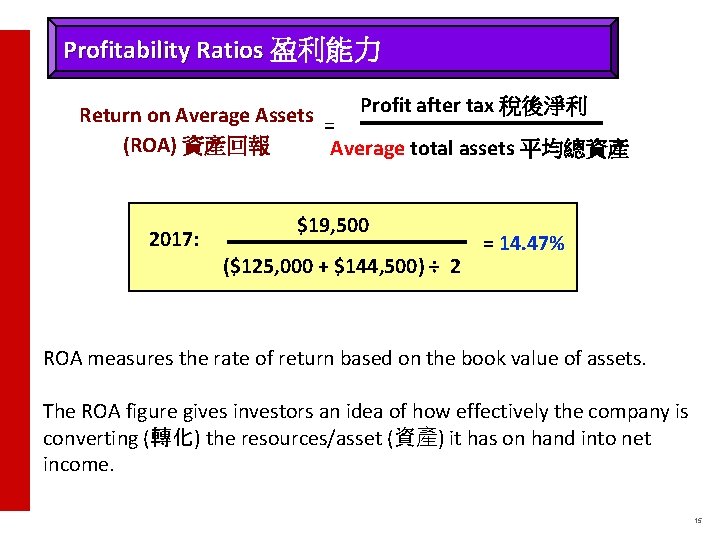
Profitability Ratios 盈利能力 Return on Average Assets = Profit after tax 稅後淨利 (ROA) 資產回報 Average total assets 平均總資產 2017: $19, 500 ($125, 000 + $144, 500) ÷ 2 = 14. 47% ROA measures the rate of return based on the book value of assets. The ROA figure gives investors an idea of how effectively the company is converting (轉化) the resources/asset (資產) it has on hand into net income. 15
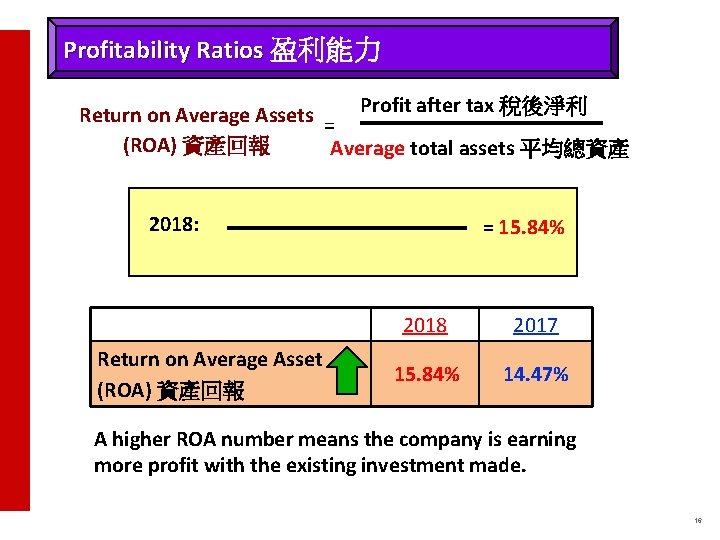
Profitability Ratios 盈利能力 Return on Average Assets = Profit after tax 稅後淨利 (ROA) 資產回報 Average total assets 平均總資產 2018: Return on Average Asset (ROA) 資產回報 = 15. 84% 2018 2017 15. 84% 14. 47% A higher ROA number means the company is earning more profit with the existing investment made. 16
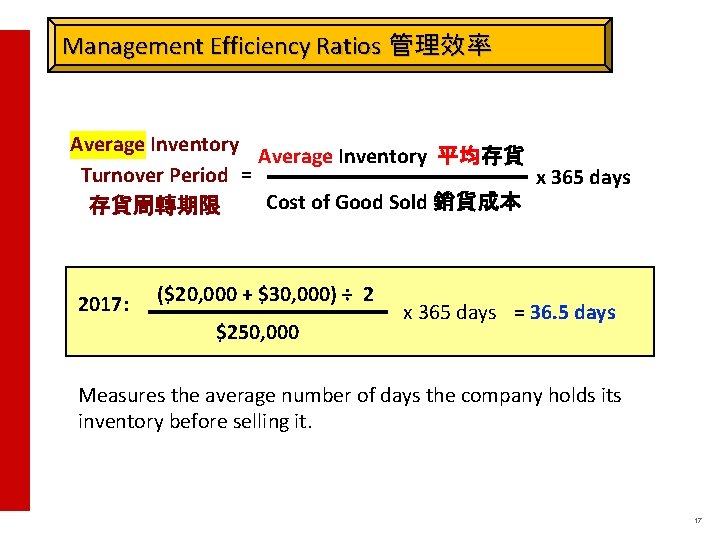
Management Efficiency Ratios 管理效率 Average Inventory 平均存貨 Turnover Period = x 365 days Cost of Good Sold 銷貨成本 存貨周轉期限 2017: ($20, 000 + $30, 000) ÷ 2 $250, 000 x 365 days = 36. 5 days Measures the average number of days the company holds its inventory before selling it. 17
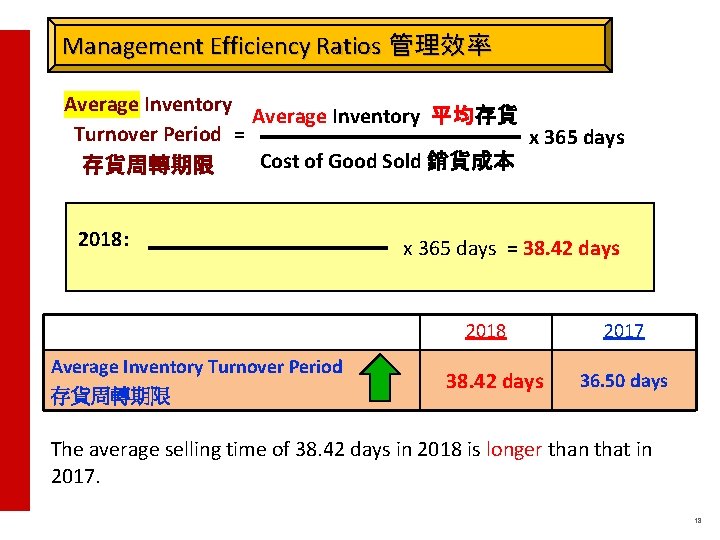
Management Efficiency Ratios 管理效率 Average Inventory 平均存貨 Turnover Period = x 365 days Cost of Good Sold 銷貨成本 存貨周轉期限 2018: x 365 days = 38. 42 days 2018 Average Inventory Turnover Period 存貨周轉期限 38. 42 days 2017 36. 50 days The average selling time of 38. 42 days in 2018 is longer than that in 2017. 18
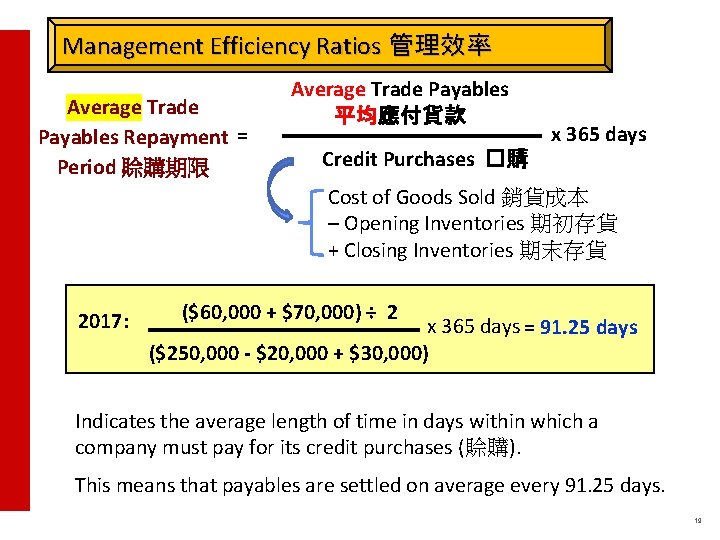
Management Efficiency Ratios 管理效率 Average Trade Payables Repayment = Period 賒購期限 Average Trade Payables 平均應付貨款 Credit Purchases �購 x 365 days Cost of Goods Sold 銷貨成本 – Opening Inventories 期初存貨 + Closing Inventories 期末存貨 2017: ($60, 000 + $70, 000) ÷ 2 x 365 days = 91. 25 days ($250, 000 - $20, 000 + $30, 000) Indicates the average length of time in days within which a company must pay for its credit purchases (賒購). This means that payables are settled on average every 91. 25 days. 19
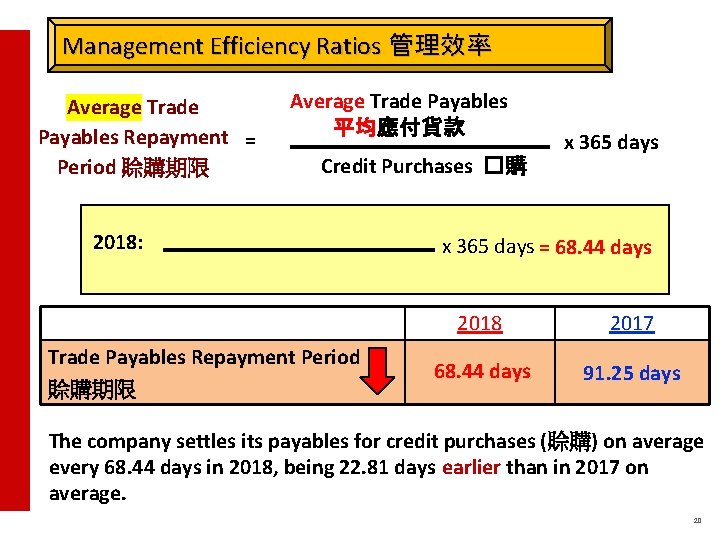
Management Efficiency Ratios 管理效率 Average Trade Payables Repayment = Period 賒購期限 Average Trade Payables 平均應付貨款 Credit Purchases �購 2018: x 365 days = 68. 44 days Trade Payables Repayment Period 賒購期限 2018 2017 68. 44 days 91. 25 days The company settles its payables for credit purchases (賒購) on average every 68. 44 days in 2018, being 22. 81 days earlier than in 2017 on average. 20
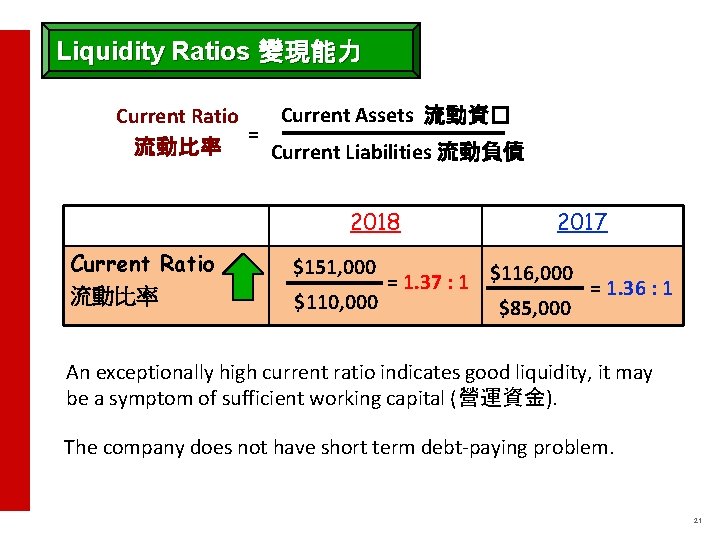
Liquidity Ratios 變現能力 Current Assets 流動資� Current Ratio = 流動比率 Current Liabilities 流動負債 2018 Current Ratio 流動比率 2017 $151, 000 = 1. 37 : 1 $116, 000 = 1. 36 : 1 $110, 000 $85, 000 An exceptionally high current ratio indicates good liquidity, it may be a symptom of sufficient working capital (營運資金). The company does not have short term debt-paying problem. 21
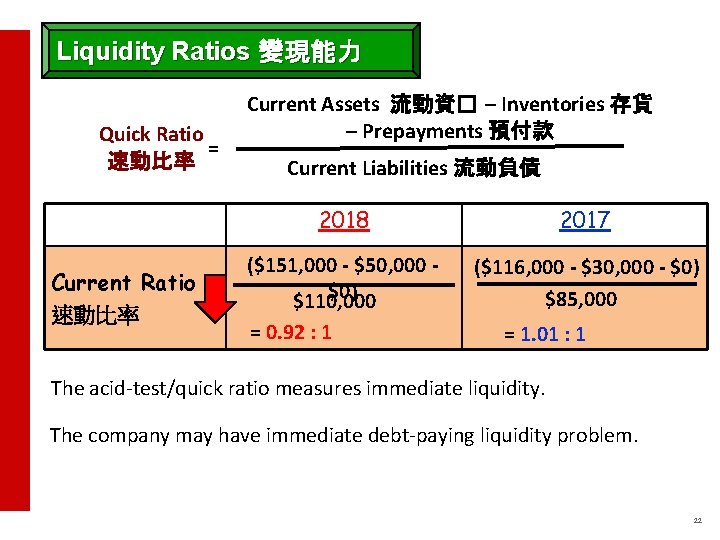
Liquidity Ratios 變現能力 Quick Ratio = 速動比率 Current Ratio 速動比率 Current Assets 流動資� – Inventories 存貨 – Prepayments 預付款 Current Liabilities 流動負債 2018 2017 ($151, 000 - $50, 000 $0) $110, 000 ($116, 000 - $30, 000 - $0) $85, 000 = 0. 92 : 1 = 1. 01 : 1 The acid-test/quick ratio measures immediate liquidity. The company may have immediate debt-paying liquidity problem. 22
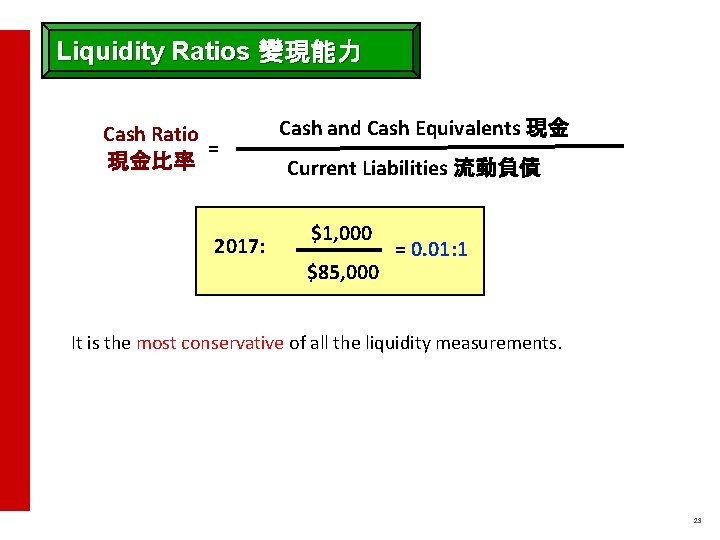
Liquidity Ratios 變現能力 Cash Ratio = 現金比率 2017: Cash and Cash Equivalents 現金 Current Liabilities 流動負債 $1, 000 $85, 000 = 0. 01: 1 It is the most conservative of all the liquidity measurements. 23
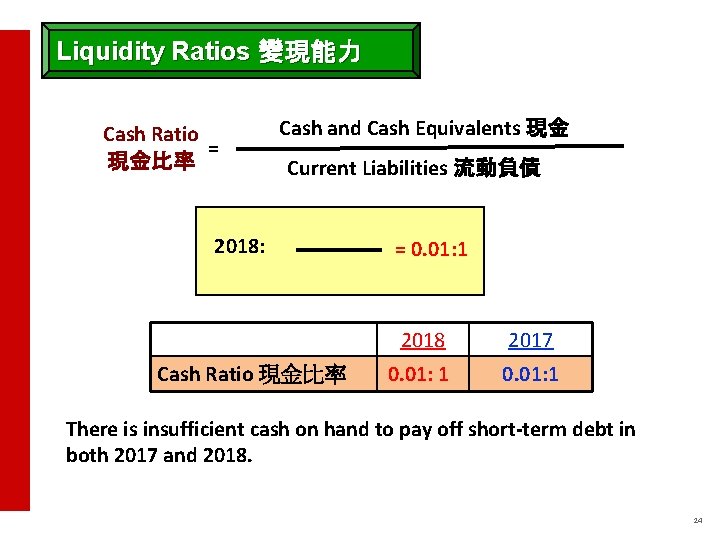
Liquidity Ratios 變現能力 Cash Ratio = 現金比率 Cash and Cash Equivalents 現金 Current Liabilities 流動負債 2018: Cash Ratio 現金比率 = 0. 01: 1 2018 2017 0. 01: 1 There is insufficient cash on hand to pay off short-term debt in both 2017 and 2018. 24
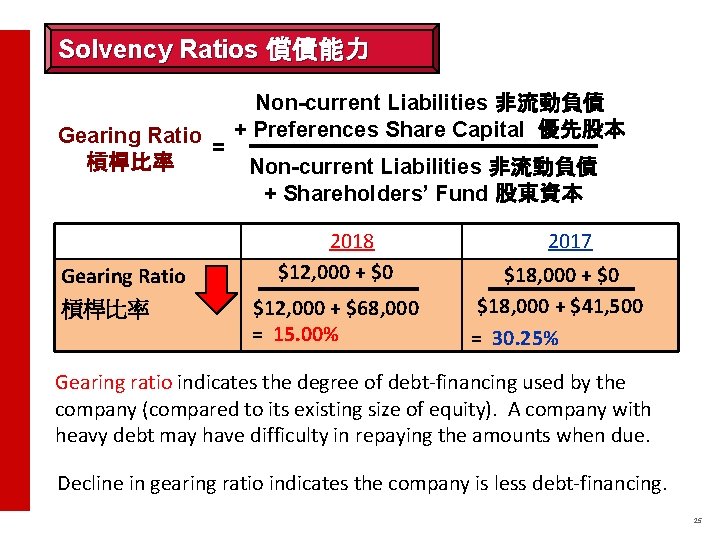
Solvency Ratios 償債能力 Gearing Ratio = 槓桿比率 Gearing Ratio 槓桿比率 Non-current Liabilities 非流動負債 + Preferences Share Capital 優先股本 Non-current Liabilities 非流動負債 + Shareholders’ Fund 股東資本 2018 $12, 000 + $0 $12, 000 + $68, 000 = 15. 00% 2017 $18, 000 + $0 $18, 000 + $41, 500 = 30. 25% Gearing ratio indicates the degree of debt-financing used by the company (compared to its existing size of equity). A company with heavy debt may have difficulty in repaying the amounts when due. Decline in gearing ratio indicates the company is less debt-financing. 25
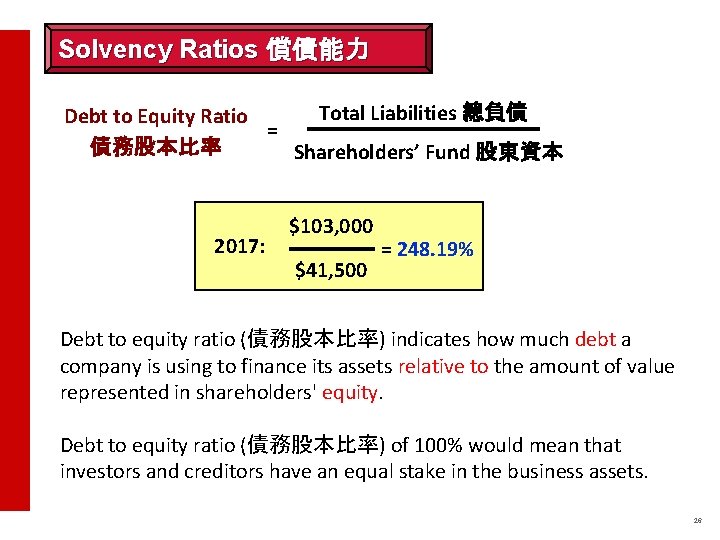
Solvency Ratios 償債能力 Total Liabilities 總負債 Debt to Equity Ratio = 債務股本比率 Shareholders’ Fund 股東資本 2017: $103, 000 $41, 500 = 248. 19% Debt to equity ratio (債務股本比率) indicates how much debt a company is using to finance its assets relative to the amount of value represented in shareholders' equity. Debt to equity ratio (債務股本比率) of 100% would mean that investors and creditors have an equal stake in the business assets. 26
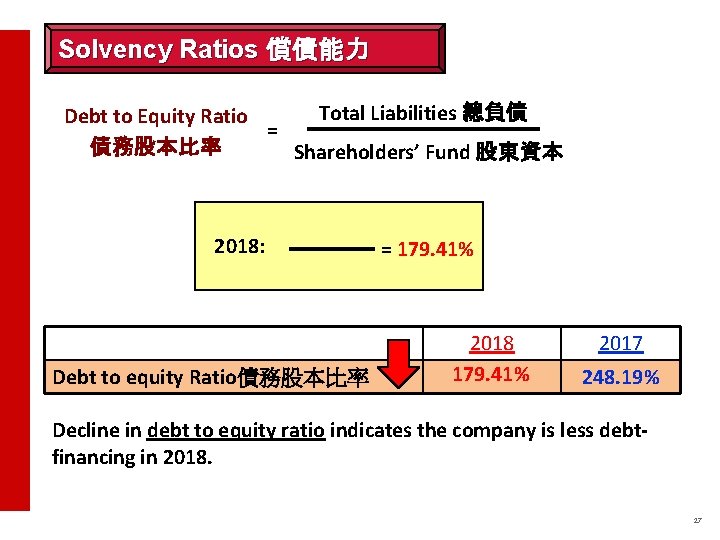
Solvency Ratios 償債能力 Total Liabilities 總負債 Debt to Equity Ratio = 債務股本比率 Shareholders’ Fund 股東資本 2018: Debt to equity Ratio債務股本比率 = 179. 41% 2018 179. 41% 2017 248. 19% Decline in debt to equity ratio indicates the company is less debtfinancing in 2018. 27
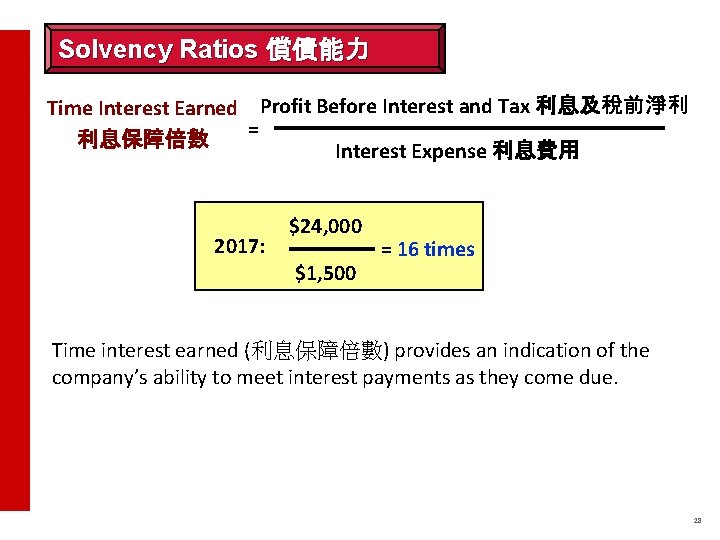
Solvency Ratios 償債能力 Time Interest Earned Profit Before Interest and Tax 利息及稅前淨利 = 利息保障倍數 Interest Expense 利息費用 2017: $24, 000 $1, 500 = 16 times Time interest earned (利息保障倍數) provides an indication of the company’s ability to meet interest payments as they come due. 28
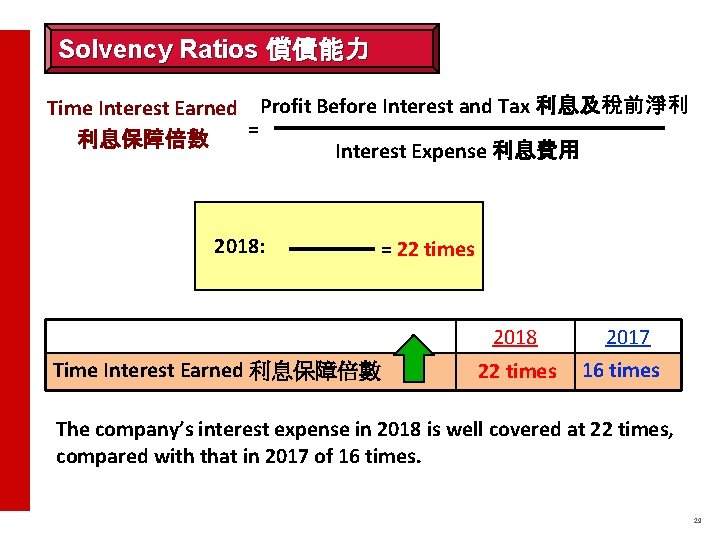
Solvency Ratios 償債能力 Time Interest Earned Profit Before Interest and Tax 利息及稅前淨利 = 利息保障倍數 Interest Expense 利息費用 2018: = 22 times 2018 Time Interest Earned 利息保障倍數 22 times 2017 16 times The company’s interest expense in 2018 is well covered at 22 times, compared with that in 2017 of 16 times. 29
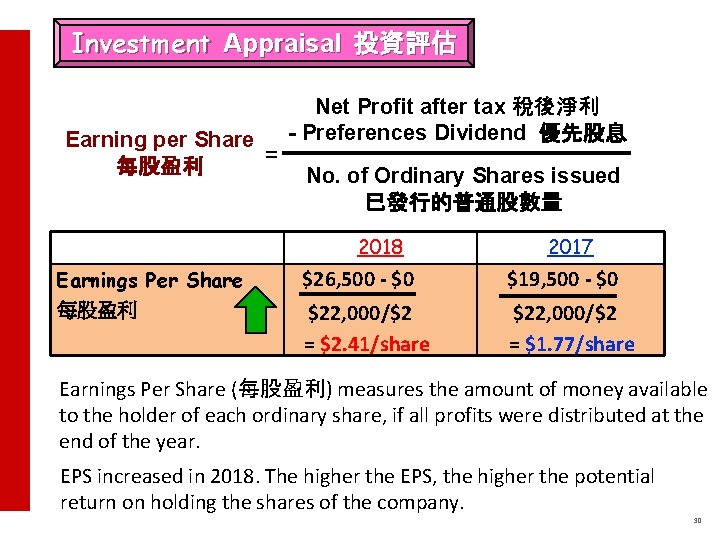
Investment Appraisal 投資評估 Earning per Share = 每股盈利 Net Profit after tax 稅後淨利 - Preferences Dividend 優先股息 No. of Ordinary Shares issued 已發行的普通股數量 2018 Earnings Per Share 每股盈利 2017 $26, 500 - $0 $19, 500 - $0 $22, 000/$2 = $2. 41/share $22, 000/$2 = $1. 77/share Earnings Per Share (每股盈利) measures the amount of money available to the holder of each ordinary share, if all profits were distributed at the end of the year. EPS increased in 2018. The higher the EPS, the higher the potential return on holding the shares of the company. 30
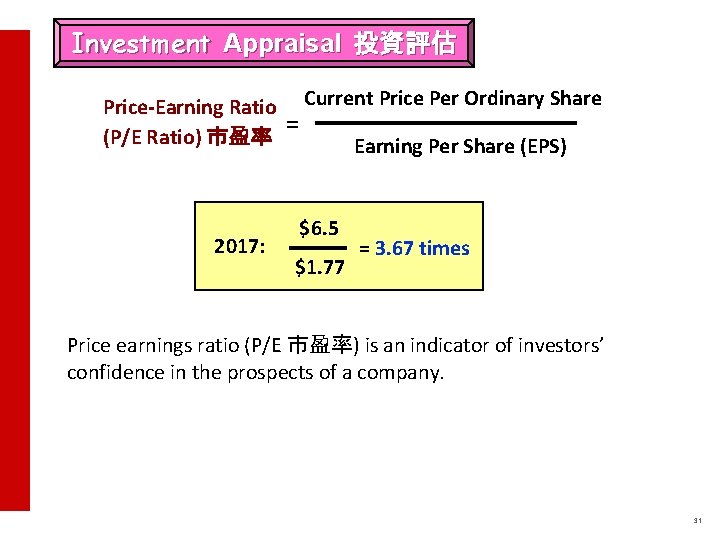
Investment Appraisal 投資評估 Price-Earning Ratio Current Price Per Ordinary Share = (P/E Ratio) 市盈率 Earning Per Share (EPS) 2017: $6. 5 $1. 77 = 3. 67 times Price earnings ratio (P/E 市盈率) is an indicator of investors’ confidence in the prospects of a company. 31
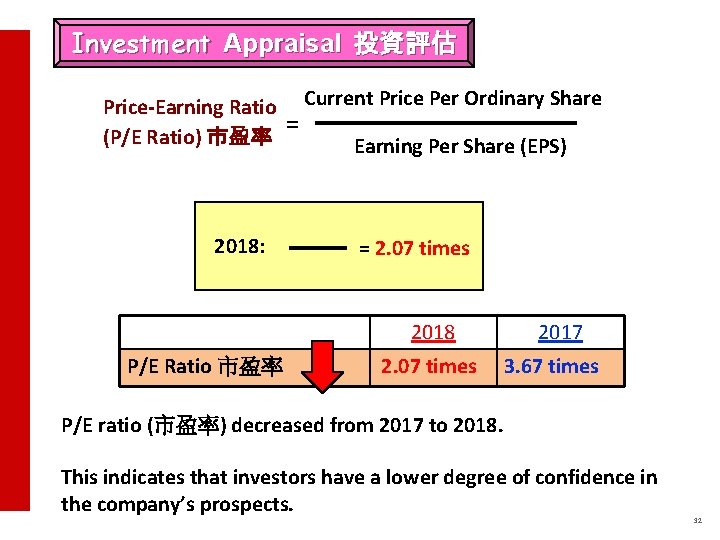
Investment Appraisal 投資評估 Price-Earning Ratio Current Price Per Ordinary Share = (P/E Ratio) 市盈率 Earning Per Share (EPS) 2018: = 2. 07 times 2018 P/E Ratio 市盈率 2. 07 times 2017 3. 67 times P/E ratio (市盈率) decreased from 2017 to 2018. This indicates that investors have a lower degree of confidence in the company’s prospects. 32
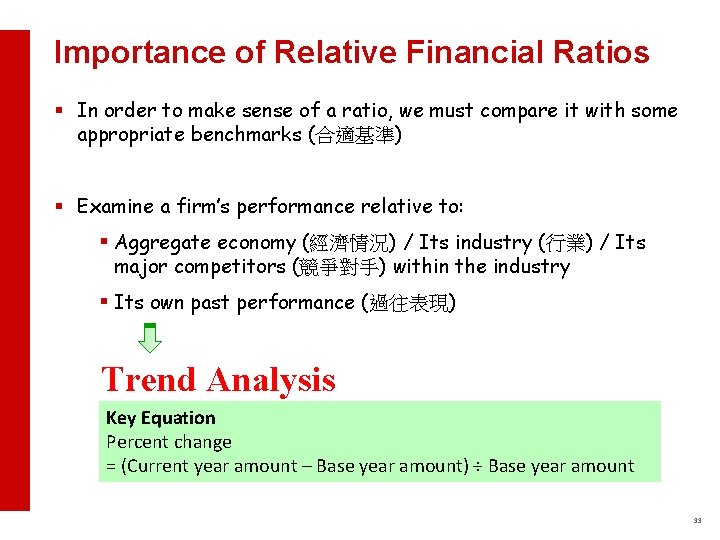
Importance of Relative Financial Ratios § In order to make sense of a ratio, we must compare it with some appropriate benchmarks (合適基準) § Examine a firm’s performance relative to: § Aggregate economy (經濟情況) / Its industry (行業) / Its major competitors (競爭對手) within the industry § Its own past performance (過往表現) Trend Analysis Key Equation Percent change = (Current year amount – Base year amount) ÷ Base year amount 33
Part 2: BUDGET PREPARATION 34
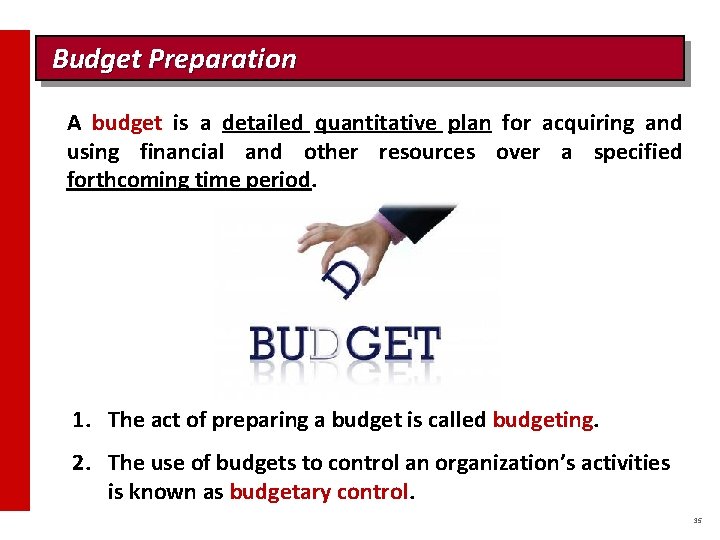
Budget Preparation A budget is a detailed quantitative plan for acquiring and using financial and other resources over a specified forthcoming time period. 1. The act of preparing a budget is called budgeting. 2. The use of budgets to control an organization’s activities is known as budgetary control. 35
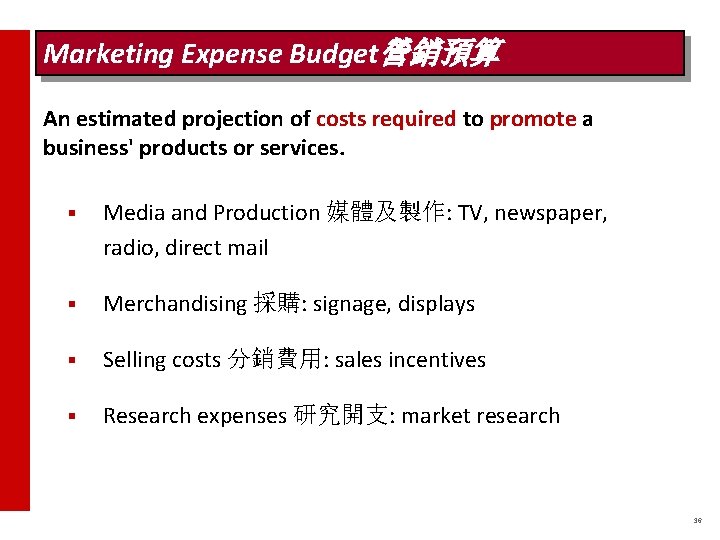
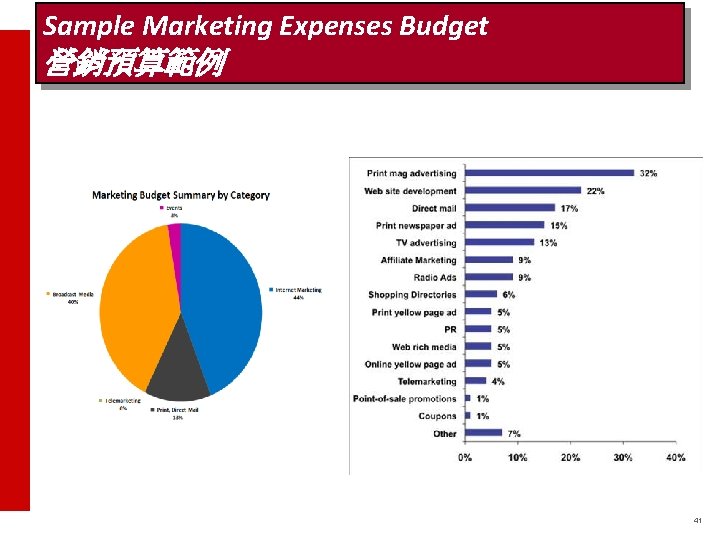
Marketing Expense Budget營銷預算 An estimated projection of costs required to promote a business' products or services. § Media and Production 媒體及製作: TV, newspaper, radio, direct mail § Merchandising 採購: signage, displays § Selling costs 分銷費用: sales incentives § Research expenses 研究開支: market research 36
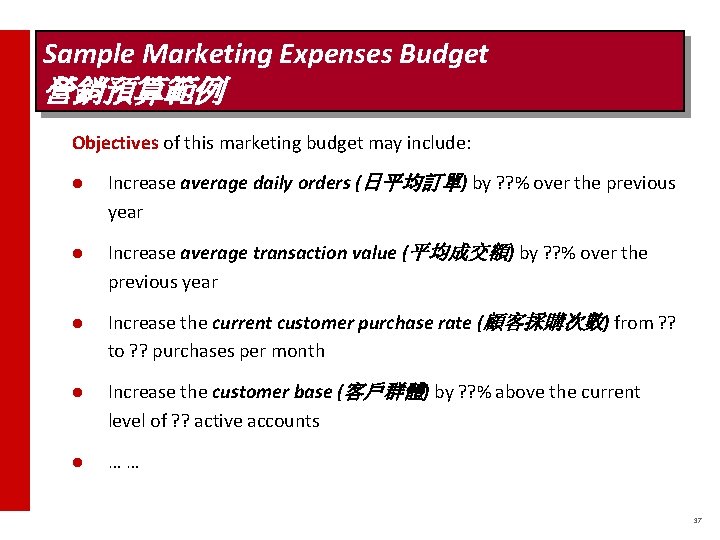
Sample Marketing Expenses Budget 營銷預算範例 Objectives of this marketing budget may include: l Increase average daily orders (日平均訂單) by ? ? % over the previous year l Increase average transaction value (平均成交額) by ? ? % over the previous year l Increase the current customer purchase rate (顧客採購次數) from ? ? to ? ? purchases per month l Increase the customer base (客戶群體) by ? ? % above the current level of ? ? active accounts l …… 37
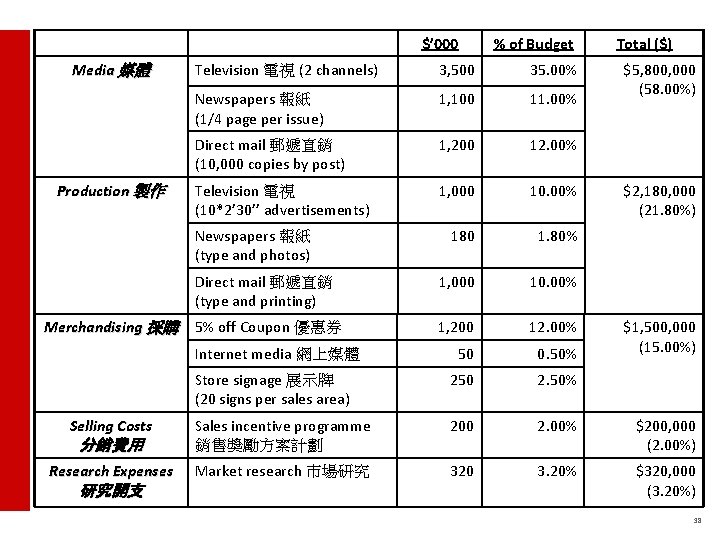
$’ 000 Media 媒體 % of Budget Total ($) Television 電視 (2 channels) 3, 500 35. 00% Newspapers 報紙 (1/4 page per issue) 1, 100 11. 00% Direct mail 郵遞直銷 (10, 000 copies by post) 1, 200 12. 00% Television 電視 (10*2’ 30’’ advertisements) 1, 000 10. 00% 180 1. 80% 1, 000 10. 00% 1, 200 12. 00% 50 0. 50% Store signage 展示牌 (20 signs per sales area) 250 2. 50% 200 2. 00% 分銷費用 Sales incentive programme 銷售獎勵方案計劃 $200, 000 (2. 00%) Research Expenses Market research 市場研究 320 3. 20% $320, 000 (3. 20%) Production 製作 Newspapers 報紙 (type and photos) Direct mail 郵遞直銷 (type and printing) Merchandising 採購 5% off Coupon 優惠券 Internet media 網上媒體 Selling Costs 研究開支 $5, 800, 000 (58. 00%) $2, 180, 000 (21. 80%) $1, 500, 000 (15. 00%) 38
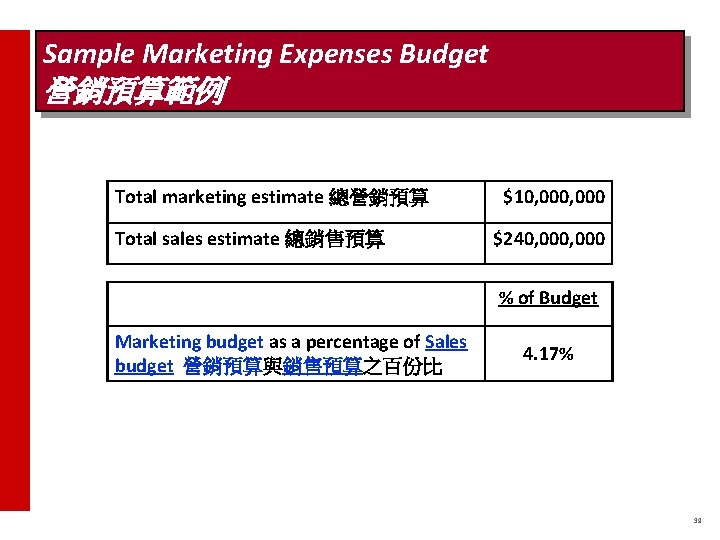
Sample Marketing Expenses Budget 營銷預算範例 Total marketing estimate 總營銷預算 Total sales estimate 總銷售預算 $10, 000 $240, 000 % of Budget Marketing budget as a percentage of Sales budget 營銷預算與銷售預算之百份比 4. 17% 39
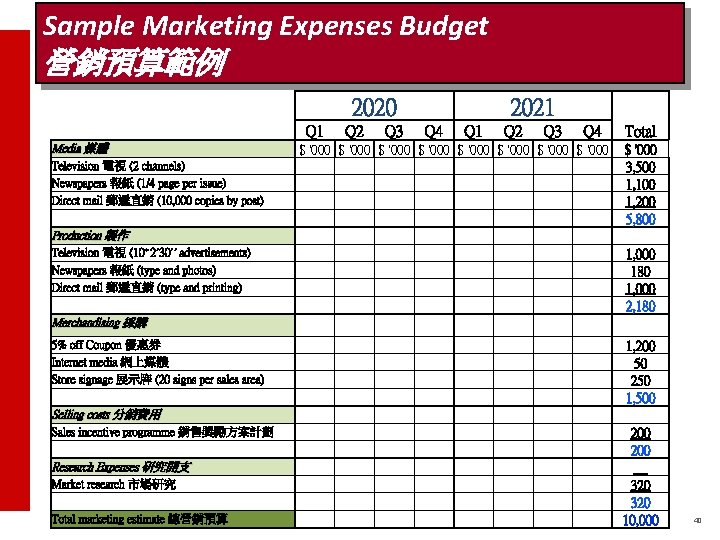
Sample Marketing Expenses Budget 營銷預算範例 2020 Q 1 Media 媒體 Q 2 2021 Q 3 Q 4 Q 1 Q 2 Q 3 Q 4 Production 製作 $ '000 3, 500 1, 100 1, 200 5, 800 Television 電視 (10*2’ 30’’ advertisements) Newspapers 報紙 (type and photos) Direct mail 郵遞直銷 (type and printing) 1, 000 180 1, 000 2, 180 5% off Coupon 優惠券 Internet media 網上媒體 Store signage 展示牌 (20 signs per sales area) Selling costs 分銷費用 Sales incentive programme 銷售獎勵方案計劃 Research Expenses 研究開支 Market research 市場研究 Total marketing estimate 總營銷預算 1, 200 50 250 1, 500 200 320 10, 000 Television 電視 (2 channels) Newspapers 報紙 (1/4 page per issue) Direct mail 郵遞直銷 (10, 000 copies by post) Merchandising 採購 $ '000 $ '000 Total 40
Sample Marketing Expenses Budget 營銷預算範例 41

42
- Slides: 42